Climate stripes updated to show third-hottest year

 University of Reading
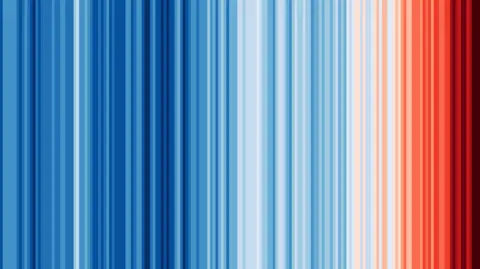
A university's graphic that shows the way global temperatures have increased has been updated to show 2025, the third-warmest year ever recorded.
The University of Reading's Prof Ed Hawkins, who created the climate stripes diagram, said while last year's average temperature was lower than 2023 and 2024, it was part of a trend.
"The last 11 years have been the warmest 11 years on record, and 2026 is almost certain to continue this sequence due to the relentless accumulation of greenhouse gases in our atmosphere," he said.
The stripes show change in average annual global temperatures since 1850. Red stripes show hotter years and blue show cooler years against the average of the period 1961-2010.
The diagram was updated on Wednesday following the release of annual global temperature data from bodies including the Copernicus Climate Change Service, Met Office and the World Meteorological Organisation.
An extra dark red stripe has been added to represent 2025.
2024 was the hottest year on record and the first to pass 1.5C warming, a threshold world leaders pledged to try to avoid in the 2015 Paris Agreement.
"Warmer temperatures have real impacts. Hotter heatwaves cause more health issues, heavier downpours cause greater flooding risks and rising sea levels causing more coastal flooding hazards," Hawkins added.
"We must urgently step up our efforts to cut emissions and prepare for the warming that is now inevitable."
The stripes were created in 2018. Since then, they have been projected onto the White Cliffs of Dover, used on Reading's shirts, at fashion shows and on racing cars.
