Granddad: Back in 1985 I played this guitar solo in Rio to a crowd of 100,000 people……
Grandmother: I used to bake…
Kids: Wow!!! Really!
Grandmother: Should I get my old rolling pin out and roll some pastry!?
Kids: YEAH!!!
Narrator: That’s right Granddad! Rock n Roll is over! All the kids want to do these days is BAKE!
V.O: Let’s kick some Cake!!
Narrator: Look at all those people there to see their hero. The edgy hard crust Baker himself, Simon the Pie Man.
Simon Pieman: Yeah, thankyou, Thankyou. Now I'm gonna show you my latest pie. It’s a concept pie.
I’m gonna show you that a PIE can be filled with INFORMATION! TASTY INFORMATION!!! Who’s with me!?Let’s make this pie, TOP OF THE CHARTS!
Narrator: Pie charts are brilliant at showing proportions, comparing the parts of something, because we’re very used to seeing actual pies being cut into portions. If someone said ‘I’ll halve this apple pie with you’ and offered you this much, you’d say ~
Youth: OI! That ain’t a half!
Narrator: And it’s because pie charts are so good at showing information, so easy to read, that you’ll find they’re used a lot. So, you’d better know how they work! They can be cut into slices that are fractions, percentages or angles, but don’t panic! It’s easy when you get your head round it! Let’s:
Narrator: Stroke the MATHS KITTEN for ANSWERS!
Narrator: Let’s start off slow. Let’s halve the pie. So we can express the slice of a pie as a fraction, a half; and because we can do this, we can also express fractions as percentages, so half is 50%, or in decimals, 0.5. And remember! A Pie is a circle, which is 360 degrees, so, we can also work out that the 2 pieces will be half of 360 which is 180 degrees.
It’s important to remember that Pie charts show data or information as proportions, not as actual amounts. Think of it as a whole pie showing you fractions, percentages or decimals as slices of the pie! To explain this better, bring me another pie!
This pie is cut into 5 slices we call sectors: a, b, c, d and e. We also know the angle of these sectors, A = 60o, B = 135o, C = 90o, D = 45o, E = 30o. But, if this Pie chart represents people, then C which is 90 degrees isn’t 90 people. And 90 degrees isn’t 90 percent! Be careful! Don’t mix up proportions with data! Infact, we don’t have any data yet, so let’s give you a clue
Narrator: This Pie Chart represents What Yesterday’s Lunch Queue Picked for Lunch. There’s a Key at the side.B represents 18 people. 18 people in the queue pick Pizza. But how many people in total were in the queue? Now, a lot of Maths is about using what you know to find out what you don’t. Focus on what you know. That B is 18 people AND 135 degrees as a proportion of 360 degrees. So from this, you can work out the total number of people represented by the entire pie chart and then work out each sector. We do this by representing what we know as a fraction 135 over 360 which can be simplified by dividing by 5, which gives us 27 over 72 and then simplify again by dividing by 9; 3 over 8. So we know that 18 people are three eighths of the total. If we divide 18 by 3 to give us 6, we know that one eighth must be 6 people. Finally, to find out the total number of people we multiply 6 by eight to get 48.
SO 48 is our total number of people.
Simon Pieman: Whaaat! How many people had chips instead of healthy, healthy cake!?!??
Narrator: I don’t think cake’s that healthy.
Well, our magic ingredient for working out the other sectors is 48 over 360, which simplifies as a fraction to 2 over 15. Just work out 2 fifteenths of the other sectors. For example, A is sixty degrees. Two fifteenths of sixty degrees is 8. And so on.
Remember! Pie charts show proportions and don’t mix up your data with your percentages or angles or anything else! What do you think International Baking Sensation!?
Simon Pieman: Don’t mix your PIES! Goodnight!
Simon Pieman: And remember…don’t stage dive kids.
Sensi: My pupil, it is time for you to practice… Fraction karate! Now chop the wood into thirds. And chop one of one of the thirds into quarters. Now what have you got?
Pupil: Very sore hands… ARRGGGGGHH!!!
Commentator1: Some great fraction action, from the plucky pupil, there Brian.
Commentator2: Yes Brian, she certainly cut that plank of wood down to size. Let's have a look at that again in super slow mo.
Commentator1: There we see the plank being cut into thirds. Textbook!
Commentator2: And now she’s chopping one of those thirds into four pieces. She’s turned that piece into quarters with her bare hands Brian.
Commentator1: They’re not a bears hands Brian they’re a humans hands. And those pieces she just chopped are twelfths of the original plank.
Commentator2: Brian?
Commentator1: Yes Brain?
Commentator2 You’ve really got to HAND it to her! HAND get it? HAND it to her. Haha ha ha ha haha!
Video summary
In this clip pie charts are introduced and an explanation is given to highlight that they show relative proportions.
There are examples to demonstrate the usefulness of pie charts and how we have an intuitive visual understanding of simple fractions and proportions, which pie charts exploit.
Numerically, the connection between fractions, decimals, percentages and the angles in a pie chart are explained.
The end sketch demonstrates calculating a fraction of a fraction.
This clip is from the series Kick Sum Maths.
Teacher Notes
This clip could be used to revisit fractions, decimals and percentages. A pie chart with some missing information could be used as a starting point, from which to calculate unknowns.
The end sketch (Fraction Karate) leads to calculating fractions of fractions, fractions of percentages, etc.
These clips could be used for teaching Maths at KS2 or at a beginner level in England, Wales and Northern Ireland and 1st and 2nd Level in Scotland.
As The Crow Flies. video
A demonstration of how to calculate the perimeter and area of simple and compound shapes with the help of the crow and Detective Stinker.

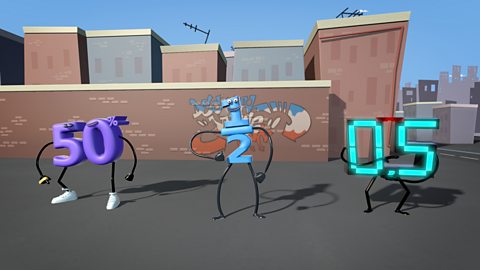
Decimal Dance Off 1. video
The structure of fractions, decimals and percentages are demonstrated through a 'Decimal Dance Off'.
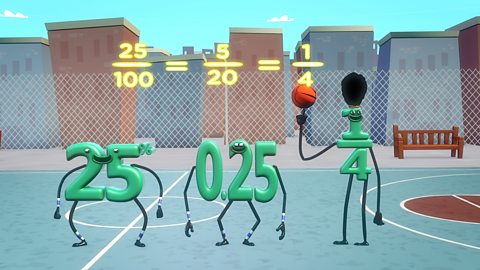
Decimal Dance Off 2 video
The connection between fractions, x decimals and percentages and how to convert between them are explored through a 'Decimal Dance Off'.
Geometry Rules OK. video
Introducing geometry, angles and shapes through a spoof house building show and an animation game show.
Let's Have Some Order. video
An explanation of why using the correct order in mathematical calculations is important.
Prime Suspects 1. video
Introducing prime numbers, composite numbers and factors in a sketch show featuring puppet Detective L Stinker and his animated friends.
Prime Suspects 2. video
Decompose numbers into prime factors. End sketches look at primes and simple sequences.
Scale And Polish. video
A look at the meaning of scale factors and how they allow us to represent large objects in two and three dimensions.
Why Maths Why? video
This clip encourages students to overcome their fear of maths. Learning a few skills will give them the power to tackle the trickiest maths challenges.

X Marks The Thought. video
An introduction to using algebra to solve simple equations by using inverse operations.