
Global temperature and Arctic ice update
The average global temperature for April on the UAH satellite measure jumped to +0.295C above the 30 year running mean.
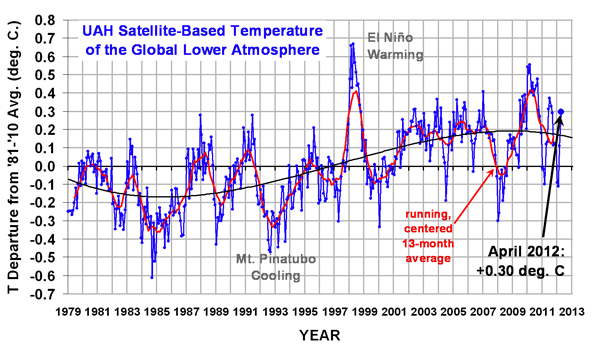
This equates to approximately +0.548C above the standard 1961-1990 average, used by the World Meteorological Organisation.
Significantly, April Arctic sea ice was close to the 1979-2012 average, and the highest in April for over 10 years, shown below.
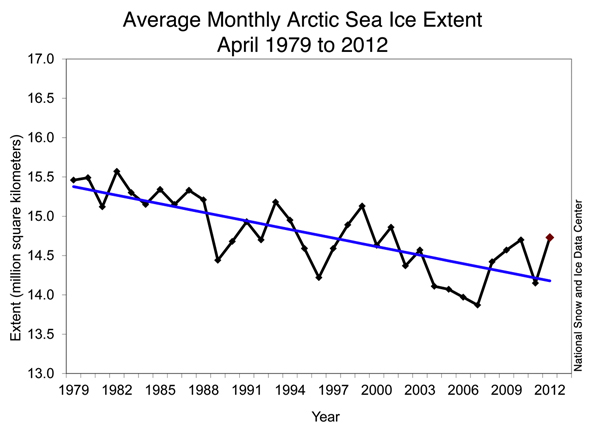
Experts though reported that much of the ice cover was thin, indeed since the end of April ice extent has fallen sharply.
Follow me on twitter @Hudsonweather
 Hello, I’m Paul Hudson, weather presenter and climate correspondent for BBC Look North in Yorkshire and Lincolnshire. I've been interested in the weather and climate for as long as I can remember, and worked as a forecaster with the Met Office for more than ten years locally and at the international unit before joining the BBC in October 2007. Here I divide my time between forecasting and reporting on stories about climate change and its implications for people's everyday lives.
Comment number 1.
At 18:24 15th May 2012, ManmadeupGW wrote:"Experts though reported that much of the ice cover was thin, indeed since the end of April ice extent has fallen sharply."
Now would these be the same experts who made headlines saying the arctic would be ice free by September 2012?
Paul
I am unfortunately to have been around for the Queens Jubilee my recollection was it poured down with rain?
Complain about this comment (Comment number 1)
Comment number 2.
At 18:30 15th May 2012, john_cogger wrote:So still warm? No cold trend? Still diminishing ice?
What a suprise. Still waiting for the onset of the cold cycle.
Complain about this comment (Comment number 2)
Comment number 3.
At 19:31 15th May 2012, poisonman wrote:This comment was removed because the moderators found it broke the house rules. Explain.
Complain about this comment (Comment number 3)
Comment number 4.
At 20:28 15th May 2012, openside50 wrote:tbf to paul poisonman - he is actually one of the good guys an almost lone sane voice within a warmist organisation - if you had been a long tome visitor to his blog you would have realised that
Complain about this comment (Comment number 4)
Comment number 5.
At 20:28 15th May 2012, Mick wrote:There is a good amount of 2 metre plus ice this year according to this US navy site.
https://www7320.nrlssc.navy.mil/hycomARC/navo/arcticictn_nowcast_anim30d.gif
And according to Nansen ice area and extent still pretty much on the longer term average so the claim of ice extent falling sharply seems premature.
https://arctic-roos.org/observations/satellite-data/sea-ice/ice-area-and-extent-in-arctic
Also the sea ice anomaly via the Cryosphere not looking that large either.
https://arctic.atmos.uiuc.edu/cryosphere/IMAGES/seaice.anomaly.arctic.png
Could be an interesting season, although current levels are normally considered a poor predictive guide to the peak summer melt, however, a staff member at NSIDC did predict an ice free or nearly ice free summer this year a few years back. Interesting times. :)
Complain about this comment (Comment number 5)
Comment number 6.
At 20:39 15th May 2012, Gadgetfiend wrote:#3 poisonman
That's the sort of post that gives sceptics a very bad name. Openside50 is right, this blog is very balanced and as such very refreshing.
Complain about this comment (Comment number 6)
Comment number 7.
At 20:42 15th May 2012, grumpyoldman58 wrote:More on Yamal. The new data is from 120 cores, not a "special one" https://wattsupwiththat.com/2012/05/15/mcintyre-gets-some-new-yamal-data-still-no-hockey-stick/
Complain about this comment (Comment number 7)
Comment number 8.
At 20:43 15th May 2012, john_cogger wrote:@3 poisonman
Please stay here, you are precious!
Complain about this comment (Comment number 8)
Comment number 9.
At 21:04 15th May 2012, poisonman wrote:I sincerely Apologize for my rant. Did not know he was one of the good guys. Sorry Paul. I retract my comment. Silly me....at least i can admit i made an error :o(
Complain about this comment (Comment number 9)
Comment number 10.
At 21:10 15th May 2012, QuaesoVeritas wrote:#3. - poisonman wrote:
"Sorry Paul how can you support or work for the FAILED Met office."
If you read the "about this blog" section, you will see that Paul no longer works for the Met. Office.
In any case, there is nothing what is written above related to Met.Office claims and since it is essentially factual, I don't see what evidence there can be to "debunk" it.
By the way, that doesn't make me a supporter of the M.O. either, but I don't think there is a "scam".
Complain about this comment (Comment number 10)
Comment number 11.
At 21:13 15th May 2012, lateintheday wrote:mick - cryosphere had server problems and has been stuck on that value for a while. Otherwise, I agree with you. The melt hasn't kicked in according to 'expert' forecast so far. Time will tell.
Also, for some reason NSIDC use a 20 year average - not the 30 year which we often read about for other measures. I also see that the DMI 80 N temp chart has been hugging average for a quite a while, although I understand they calculate their average across the full record.
Complain about this comment (Comment number 11)
Comment number 12.
At 21:15 15th May 2012, poisonman wrote:@ Quaesovertas as i have posted above i was completely out of order and have apologized for my ignorance.
Complain about this comment (Comment number 12)
Comment number 13.
At 21:18 15th May 2012, QuaesoVeritas wrote:Oops, I hadn't noticed this entry when I posted this in the previous blog, and as it is more on topic here, I will post it again:
I have been looking at the mean monthly temperature anomalies for the N.H., using RSS data.
Apart from the N.Polar region, i.e. 60 to 82.5 deg. the mean anomaly peaks in April & September, with the peak in April being higher than that in Sept. and are at their lowest in June and December.
However in the case of the N.Polar region, the peaks are in April and December, with low points in February and July. On average, the December peak is higher than that in April.
After September, the other regions anomalies tend to fall, whereas the N.Pole anomalies tend to rise until December, then fall.
Any ideas why the N.Pole would behave differently to the rest of the N.H.?
Here are the average N.Pole anomaly figures, in case anyone wishes to plot them:
JAN 0.257
FEB 0.103
MAR 0.182
APR 0.341
MAY 0.308
JUN 0.224
JUL 0.192
AUG 0.256
SEP 0.273
OCT 0.278
NOV 0.317
DEC 0.366
Whereas the anomalies for the NH excluding the N.Pole are:
JAN 0.102
FEB 0.117
MAR 0.138
APR 0.147
MAY 0.097
JUN 0.079
JUL 0.114
AUG 0.111
SEP 0.128
OCT 0.082
NOV 0.087
DEC 0.042
Complain about this comment (Comment number 13)
Comment number 14.
At 21:33 15th May 2012, openside50 wrote:Just had a look at the ice extent this year in the Antarctic - wow - way above the average recorded since satellite coverage made measurement possible
Odd that the south pole receives relatively little news coverage
Complain about this comment (Comment number 14)
Comment number 15.
At 22:23 15th May 2012, greensand wrote:13. QuaesoVeritas wrote:
"Any ideas why the N.Pole would behave differently to the rest of the N.H.?"
Interesting question, no immediate serious thoughts but should be good to have a look see.
"Here are the average N.Pole anomaly figures, in case anyone wishes to plot them:"
Over what timescale did you calculate the "average"?
Complain about this comment (Comment number 15)
Comment number 16.
At 22:40 15th May 2012, quake wrote:IJIS data is back up
https://www.ijis.iarc.uaf.edu/en/home/seaice_extent.htm
Cryosphere Today is probably going to be down for a while..
Complain about this comment (Comment number 16)
Comment number 17.
At 23:00 15th May 2012, greensand wrote:Arctic looking all sort of Arctic as it tends to do at this time of the year:-
https://www.dwd.de/bvbw/generator/DWDWWW/Content/Oeffentlichkeit/WV/WVFK/English/Dynamisches/Objective/osisafIceConcNH__m00s__en,templateId=poster,property=poster.png
Complain about this comment (Comment number 17)
Comment number 18.
At 07:54 16th May 2012, NeilHamp wrote:Just keeping this thread up to date with our forecasts for 2012
Figures in brackets are last year’s forecast
“Warmists”
+0.48 Met Office (+0.44)
+0.45 Newdwr54 (N/A)
+0.43 John Cogger (N/A)
“Neutralists”
+0.42 Mr Bluesky
+0.42 Lazarus
+0.41 quake (+0.36)
+0.40 Paul Briscoe
+0.40 Gagetfriend (+0.30)
+0.40 NeilHamp ( +0.27)
“Coolists”
+0.37 Lateintheday’s Holly Bush
+0.34 QuaesoVeritas (+0.31)
+0.29 millinia (+0.24)
+0.29 LabMunkey (+0.25)
+0.28 ukpahonta (+0.35) (2011 winning entry)
+0.24 Joe Bastardi
If ukpahonta is right again for 2012 it will certainly put the polar bear amongst the penguins
2012 forecasts have not yet been found for:-
SmokingDeepThroat (+0.39)
Ken Sharples( +0.18)
nibor25( +0.15)
jkiller56
Complain about this comment (Comment number 18)
Comment number 19.
At 08:26 16th May 2012, lateintheday wrote:QV @13
I'm confused by your numbers (doesn't take much) as I would have expected them all to be higher. Quickly looking at the NH monthly anomalies alone, wouldn't they average out to an annual anomaly under 0.1?
I understood that the NH had warmed more than the SH so something looks awry here. Maybe these are the anomalies against the last ten years base period?
Complain about this comment (Comment number 19)
Comment number 20.
At 09:30 16th May 2012, QuaesoVeritas wrote:#15. - greensand wrote:
"Over what timescale did you calculate the "average"?"
Over the entire RSS series.
The anomalies do seem to increase with time, so the next step is to look at shorter periods to see if the pattern still holds in more recent years, compared to the earlier ones.
Complain about this comment (Comment number 20)
Comment number 21.
At 09:39 16th May 2012, ukpahonta wrote:What a conundrum.
https://www.telegraph.co.uk/earth/earthnews/9267245/Snow-in-mid-May-as-forecasters-warn-of-possible-summer-washout.html
Complain about this comment (Comment number 21)
Comment number 22.
At 10:03 16th May 2012, Lazarus wrote:ManmadeupGW
No experts said that "the arctic would be ice free by September 2012".
What was reported was the opinion of one NASA scientist back in 2007 and based on the sharp fall in ice in 2007. He said "At this rate, the Arctic Ocean could be nearly ice-free at the end of summer by 2012".
One expert using qualifiers like;' based on a rate it could be nearly', is noting like your claim of 'multiple experts' saying would be and ice free. As a sceptic I see the difference, do you?
Complain about this comment (Comment number 22)
Comment number 23.
At 10:07 16th May 2012, QuaesoVeritas wrote:#19. - lateintheday wrote:
"I'm confused by your numbers (doesn't take much) as I would have expected them all to be higher. Quickly looking at the NH monthly anomalies alone, wouldn't they average out to an annual anomaly under 0.1?
I understood that the NH had warmed more than the SH so something looks awry here. Maybe these are the anomalies against the last ten years base period?"
The anomalies are relative to the normal RSS base period, i.e. 1979-98.
Please note that the second set of figures are the N.H. *minus* the N. Pole.
I have calculated this, by deducting the N.Pole anomaly from the N.H. anomaly, after applying a weighting based on surface area.
The mean anomalies for the N.H. *including* the N.Pole are:
JAN 0.124
FEB 0.115
MAR 0.144
APR 0.175
MAY 0.127
JUN 0.100
JUL 0.125
AUG 0.132
SEP 0.148
OCT 0.110
NOV 0.120
DEC 0.089
Note that the above anomalies are higher than the N.H. *excluding* the N.Pole where the N.Pole mean anomalies are highest, e.g. December. I think that my earlier figures are more representative of the N.H., as the N.Pole has a large impact on the overall figures.
The average annual anomaly for the N.H. *excluding* the N.Pole is 0.104c and that for the N.H. *including* the N.Pole, is 0.126c. The mean for the N.Pole alone is 0.256c, bearing in mind that the N.Pole (60 to 82.5 deg.) is approximately 1/5 of the N.H.
Another factor may be that the averages are over the period 1979 to 2011/12, and more recent anomalies are higher. As I said to greensand, I will be looking at how these have changed over time, but the purpose of the excercise was mainly to see how the anomalies vary over the course of the year.
Complain about this comment (Comment number 23)
Comment number 24.
At 10:12 16th May 2012, QuaesoVeritas wrote:#22. - Lazarus wrote:
"What was reported was the opinion of one NASA scientist back in 2007 and based on the sharp fall in ice in 2007. He said "At this rate, the Arctic Ocean could be nearly ice-free at the end of summer by 2012"."
Given that it was such an obviously stupid statement to make, one wonders why any scientist would make it, unless it was intended to raise alarm.
Complain about this comment (Comment number 24)
Comment number 25.
At 10:54 16th May 2012, ukpahonta wrote:This week, after reviewing his own new data, NASA climate scientist Jay Zwally said: "At this rate, the Arctic Ocean could be nearly ice-free at the end of summer by 2012, much faster than previous predictions."
https://news.nationalgeographic.com/news/2007/12/071212-AP-arctic-melt.html
One wonders why such an organisation would report it unless it was an effort, much like the sensationalism expected within red top tabloids, to increase sales.
Complain about this comment (Comment number 25)
Comment number 26.
At 11:32 16th May 2012, lateintheday wrote:Lazarus - looks like scientists (plural) to me according to this bbc story from 2007.
https://news.bbc.co.uk/1/hi/7139797.stm
Wednesday, 12 December 2007
Scientists in the US have presented one of the most dramatic forecasts yet for the disappearance of Arctic sea ice. Their latest modelling studies indicate northern polar waters could be ice-free in summers within just 5-6 years. Professor Wieslaw Maslowski told an American Geophysical Union meeting that previous projections had underestimated the processes now driving ice loss.
"Our projection of 2013 for the removal of ice in summer is not accounting for the last two minima, in 2005 and 2007," the researcher from the Naval Postgraduate School, Monterey, California, explained to the BBC. So given that fact, you can argue that may be our projection of 2013 is already too conservative."
Then of course, this was presented in alarmist fashion by you know who on an international stage, ensuring headlines around the world. . .
"Former US Vice President Al Gore cited Professor Maslowski's analysis on Monday in his acceptance speech at the Nobel Peace Prize ceremony in Oslo."
And Serreze had the opportunity to dismiss the claim but instead, added further credibility to it by saying . . .
“I think Wieslaw is probably a little aggressive in his projections, simply because the luck of the draw means natural variability can kick in to give you a few years in which the ice loss is a little less than you’ve had in previous years. But Wieslaw is a smart guy and it would not surprise me if his projections came out.”
Complain about this comment (Comment number 26)
Comment number 27.
At 11:41 16th May 2012, lateintheday wrote:Lazarus, if you check out the description of what scientists mean by "ice free" at the NSIDC icelights website then you'll find that ManmadeupGW was correct and qualifiers were not necessary.
QV - thanks for the very clear explanation. Was the Arctic Oscillation link of any use on the last thread?
Complain about this comment (Comment number 27)
Comment number 28.
At 11:44 16th May 2012, quake wrote:I am interested to know why people think a prediction of arctic sea summer sea ice disappearance by 2012/2013 was silly.
Maslowski gives reasoning behind the prediction:
"But the Monterey researcher believes these models have seriously underestimated some key melting processes. In particular, Professor Maslowski is adamant that models need to incorporate more realistic representations of the way warm water is moving into the Arctic basin from the Pacific and Atlantic oceans."
"My claim is that the global climate models underestimate the amount of heat delivered to the sea ice by oceanic advection," Professor Maslowski said.
"The reason is that their low spatial resolution actually limits them from seeing important detailed factors.
"We use a high-resolution regional model for the Arctic Ocean and sea ice forced with realistic atmospheric data. This way, we get much more realistic forcing, from above by the atmosphere and from the bottom by the ocean."
So what is wrong in his reasoning there? What makes his prediction silly? Ie so absurd that he shouldn't have given it?
Complain about this comment (Comment number 28)
Comment number 29.
At 12:04 16th May 2012, quake wrote:Arctic sea ice volume modelling shows continued decline since 2007 and it's getting very close to the 0 mark in summer:
https://neven1.typepad.com/.a/6a0133f03a1e37970b0168eb41b27b970c-pi
That model is not necessarily correct though and should be thought of as possibility. But in that respect it supports the possibility of summer arctic sea ice loss this or next year. We are very close now if volume is dropping that fast. As one of the scientists in the BBC article says: "In the end, it will just melt away quite suddenly. It might not be as early as 2013 but it will be soon, much earlier than 2040."
As the ice has got thinner in summer it's become more prone to the "right" conditions wiping it vast tracts of it. That happened in summer 2007. There was no warning, it just dived downwards. That hadn't happened before in the record, it's because the ice is in worse condition. In recent years the ice has got nearly as low in extent as 2007 without those same conditions, which backs up the idea that the ice thickness has declined further since then.
As the ice gets thinner it becomes more prone to that kind of stuff. Soon it won't require the "right" conditions to produce 2007 style levels any-more, it'll become a regular occurance and then you have to wonder how far it will drop if 2007 like conditions occur again but this time with thinner ice.
When it does go one summer in the future, it'll probably go suddenly without warning. I doubt it will be gradual, it will be a 2007 style drop on a larger scale.
Complain about this comment (Comment number 29)
Comment number 30.
At 12:17 16th May 2012, lateintheday wrote:Quake, I'm not sure it was silly - just alarmist, in that it flew in the face of most other predictions which range from 2030 - 2100, or even unlikely in the foreseeable future. Nevertheless, its central claim was repeated worldwide without much opposition from the scientific community.
Put another way, imagine if a respected scientist claimed ice age conditions would occur within 6 years, massively changing NH habitats and weather patterns. If this claim made the headlines around the world, one might expect other experts to stand up and call it tosh (in their opinion).
In this particular case, Serreze and others actually gave Maslowski's claim some credibility which added to the MSM story. I don't remember seeing much in the way of a retraction or even balanced reporting by the MSM. Although I admit, this could be because as a typical joe public, I'm more sensitive to scare stories which is of course, what the MSM editors bank on.
On a related note, earlier today I followed a link from the comments section at CA (DocMartyn) to this study.
https://met.no/Forskning/Publikasjoner/filestore/Ealat_Yamal_climaterep_dvs-1.pdf
I've only very briefly scanned it, but like the DMI maps we discussed earlier it appears to show significant historical variations in temps and ice cover since 1900, which make the recent variations look less 'death spiral' and more cyclical.
Complain about this comment (Comment number 30)
Comment number 31.
At 13:12 16th May 2012, Lazarus wrote:QuaesoVeritas wrote:
"Given that it was such an obviously stupid statement to make"
I disagree. It would have seen like a possible outcome given the data for 2007. Personally I don't think scientists should give opinions in public without supporting research but many do. Litzen often does.
2007 was the first year that the Northwest passage open - a forecast by Hansen made in 1981 - and it has open every summer since. Ice volume continues to decline and as Paul has pointed out, even though Ice Extent was around average this winter it was very thin. It will only take a warm year and similar weather conditions to 2007 for the Arctic to be mostly ice free (less than 50% of the accepted average) and that could still happen this year and I think likely within the next decade or so.
lateintheday wrote:
" looks like scientists (plural)"
Different kettle of fish. In this case it was research but the scientists forecast for 'ice free' was for 2013 and was always an outlier. The mainstream science view is stated in the article;
""My thinking on this is that 2030 is not an unreasonable date to be thinking of."
And later, to the BBC, Dr Serreze added: "I think Wieslaw is probably a little aggressive in his projections, simply because the luck of the draw means natural variability can kick in to give you a few years in which the ice loss is a little less than you've had in previous years. "
It is wrong to choose one single piece of research or scientist and use it as 'what the experts say' just as it would be wrong to use Monckton as a typical GW skeptic.
Complain about this comment (Comment number 31)
Comment number 32.
At 13:15 16th May 2012, QuaesoVeritas wrote:#12. - poisonman wrote:
"@ Quaesovertas as i have posted above i was completely out of order and have apologized for my ignorance."
Sorry, I hadn't seen your post #9 when I sent my post #10.
Complain about this comment (Comment number 32)
Comment number 33.
At 13:27 16th May 2012, QuaesoVeritas wrote:#31. - Lazarus wrote:
"I disagree. It would have seen like a possible outcome given the data for 2007. Personally I don't think scientists should give opinions in public without supporting research but many do. Litzen often does."
I don't think it is very sensible to project the outcome of a single extreme year and make predictions on that basis.
Using the same approach, based on the fall in global temperatures between 2011 and 2012, temperatures will be back to the 1961-90 average by 2014.
Complain about this comment (Comment number 33)
Comment number 34.
At 13:57 16th May 2012, ukpahonta wrote:"Using the same approach, based on the fall in global temperatures between 2011 and 2012, temperatures will be back to the 1961-90 average by 2014."
That is a bit extreme QV, my thinking on this is that 2020 is not an unreasonable date to be thinking of.
From a previous post having a bit of fun:
2012 0.28,
2013 0.34,
2014 0.36,
2015 0.32,
2016 0.26,
2017 0.19,
2018 0.12,
2019 0.05,
2020 0.00
Complain about this comment (Comment number 34)
Comment number 35.
At 14:32 16th May 2012, lateintheday wrote:Lazarus, I think it's a matter of perspective but not a different kettle of fish. There clearly was a GROUP of scientists behind the research and I remind you that Maslowski said . .
"So given that fact, you can argue that may be our projection of 2013 is already too conservative."
There is no other way to interpret this other than 2012 or earlier.
And despite his qualifying comments, was Serreze wise to to say to the media. . .
"But Wieslaw is a smart guy and it would not surprise me if his projections came out.”
I agree with your Monckton comment up to a point. The difference being that Serreze holds a senior position at NSIDC and IS regarded as an expert on arctic sea ice. Whereas Monckton is err . . . well . . . Monckton.
Complain about this comment (Comment number 35)
Comment number 36.
At 16:02 16th May 2012, QuaesoVeritas wrote:#27. - lateintheday wrote:
"QV - thanks for the very clear explanation. Was the Arctic Oscillation link of any use on the last thread?"
Sorry, I should have replied to you on that earlier.
I must admit that I have some difficulty in getting to grips with the implications of the AO, and what effect it has on Arctic weather.
What exactly is being referred to when it is described as "negative" or "positive", i.e. temperature or pressure. There is a graph of the AO index, but it isn't clear to me what that is an index of. No numbers I can get my teeth into.
I haven't had time to read any of the additional links, so clearly more reading required on my behalf.
I do notice that the page says that the AO has recently switched from positive to negative mode, which I think means that the ice should be less prone to melting, but I am not sure.
Complain about this comment (Comment number 36)
Comment number 37.
At 16:07 16th May 2012, QuaesoVeritas wrote:34.At 13:57 16th May 2012, ukpahonta wrote:
"Using the same approach, based on the fall in global temperatures between 2011 and 2012, temperatures will be back to the 1961-90 average by 2014."
#34. - ukpahonta wrote:
"That is a bit extreme QV, my thinking on this is that 2020 is not an unreasonable date to be thinking of."
Ah, but I was using the same approach as Jay Zwally!
Complain about this comment (Comment number 37)
Comment number 38.
At 16:43 16th May 2012, lateintheday wrote:QV - it's pressure apparently. These were the relevant bits. From the NSIDC website . . .
The AO, which ranges between two distinct modes, describes how pressure patterns are distributed over the Arctic region and the middle latitudes of the Northern Hemisphere. NSIDC director Mark Serreze, an expert on Arctic climate and weather, said, “When the Arctic Oscillation flips from one mode to another, that represents a fundamental change in the circulation of the atmosphere, the way the winds blow.” The AO can persist in one phase from anywhere from days to months. When pressure is higher than normal over the Arctic, and lower than normal over middle latitudes, the AO is in its negative mode. When it is positive, air pressure is lower than normal over the Arctic and higher than normal over middle latitudes.
“When the Arctic Oscillation is in its positive phase, the jet stream, which brings us much of our weather in middle latitudes, tends to shift to the north.” That means that in the positive phase of the AO, winter storms also shift north, leaving most of the U.S. warmer and drier than average.
When the AO is negative, the jet stream moves south, bringing winter weather with it. Last winter, for example, the strong winter storms that hit the Eastern United States and Europe were influenced in part by a strongly negative phase of the AO. NSIDC scientist Walt Meier noted that the AO is not a sole actor—it works in concert with other large-scale patterns to influence the weather. He said, “The heavy snows the last couple years were related to the AO as well as La Niña.”
When the Arctic Oscillation is in its negative mode, he said, the winds and ice tend to flow in a clockwise direction, generally keeping more of the older, thicker ice in the middle of the Arctic.
Complain about this comment (Comment number 38)
Comment number 39.
At 16:50 16th May 2012, ukpahonta wrote:#37 QV
Ah,hah!
I saw your Jay Zwally and raised a Dr Mark Serreze:
"My thinking on this is that 2030 is not an unreasonable date to be thinking of."
Slightly modified of course.
Light bulb!
Top trumps for UEA students, cards featuring climate scientists and their specific fields, number of papers published, citations, public statements...etc
Perhaps not, back to the day job.
Complain about this comment (Comment number 39)
Comment number 40.
At 18:32 16th May 2012, Mick wrote:#36.
This link may be useful, an essay drawing together several descriptions and links to other studies.
https://www.appinsys.com/GlobalWarming/AO_NAO.htm
There is a study that attributes somewhat of a major state change in the Arctic to the AO. A change that led to a major loss of multiyear ice.
Variations in the Age of Arctic Sea-ice and Summer Sea-ice Extent
Ignatius G. Rigor1,2 & John M. Wallace2
Polar Science Center, Applied Physics Laboratory, University of Washington
Department of Atmospheric Sciences, University of Washington
Geophys. Res. Lett., v. 31, doi:10.1029/2004GL019492, 2004.
The link to the document is on this page.
https://seaice.apl.washington.edu/IceAge&Extent/
Complain about this comment (Comment number 40)
Comment number 41.
At 18:44 16th May 2012, quake wrote:"Quake, I'm not sure it was silly - just alarmist, in that it flew in the face of most other predictions which range from 2030 - 2100, or even unlikely in the foreseeable future."
Maslowski had found a result using a more specialized model of sea ice and was reporting it. I disagree that he should not have reported it just because it didn't agree with prior predictions.
If predictions outside the mainstream should not be given to the media then several prominent climate sceptics would have to be muzzled from publicly claiming climate sensitivity is lower than the mainstream 2.5-4.5C range.
"Put another way, imagine if a respected scientist claimed ice age conditions would occur within 6 years, massively changing NH habitats and weather patterns."
The temperature drop from mid-2011 to now was due to La Nina and is known to be temporary. It can't lead to an ice age in 6 years.
The mechanisms of sea ice decline is far more uncertain. The "within 6 years" 2012/2013 predictions were certainly plausible back then and are still plausible today.
"In this particular case, Serreze and others actually gave Maslowski's claim some credibility"
Probably because they couldn't stand there and honestly claim that Maslowski was wrong.
Complain about this comment (Comment number 41)
Comment number 42.
At 20:04 16th May 2012, greensand wrote:20. QuaesoVeritas wrote:
"Over the entire RSS series."
Thanks QV and I see that you are also a mind reader:-)
"The anomalies do seem to increase with time, so the next step is to look at shorter periods to see if the pattern still holds in more recent years, compared to the earlier ones."
Exactly my thought, is the NH/Arctic "ratio" "on the move", if you get my drift. If I get the time I will try and check the Reynolds NH/Arctic numbers.
Complain about this comment (Comment number 42)
Comment number 43.
At 20:13 16th May 2012, QuaesoVeritas wrote:#38. - lateintheday wrote:
"QV - it's pressure apparently. These were the relevant bits. From the NSIDC website . . "
Thanks,
I saw that on the page, but I had difficulty in reconciling the term "negative" with high pressure over the arctic, and "positive", with low pressure. It's the terms "negative" and "positive" which I have difficulty with.
Also, if the AO can persist in one phase from "days to months", isn't it just anohter way of describing normal variation in N.H. atmospheric pressure? You could just as easily define a U.K. Oscillation, depending upon whether the pressure over the UK was high or low.
Complain about this comment (Comment number 43)
Comment number 44.
At 21:43 16th May 2012, newdwr54 wrote:NOAA made an interesting observation in their announcement of the April 2012 global surface temperature anomaly (+0.65C - fifth warmest April since 1880 globally).
They say:
"The global temperature departure from the 20th century average and the monthly rank were the highest since November 2010, near the onset of first back-to-back La Niñas in 2010." https://www.ncdc.noaa.gov/sotc/global/2012/4
The implication is that with the natural cooling brought about by the 2010 La Niñas having passed, the underlying global warming signal has more or less picked up again from where it left off.
The proof of the pudding for this will come in the next weeks and months. ENSO 3.4 has been in a 'neutral' state for a couple of months now. That being the case, and in the absence of any other obvious 'natural' forcing, global surface temps should be stabilising towards the long term mean. However the ENSO neutral conditions have coincided with an *increase* in observed global surface temperatures.
Despite neutral ENSO conditions, surface temperatures are rising. What's causing this?
Complain about this comment (Comment number 44)
Comment number 45.
At 22:51 16th May 2012, greensand wrote:44. newdwr54 wrote:
"What's causing this?"
Maybe it is whatever has been causing surface temperatures to rise since the LIA and or whatever caused similar rates of change from 1920 to 1940 including similar effects upon high latitude areas?
Or maybe, just, maybe to quote Stephen Fry "nobody knows!" Catagorically?
Complain about this comment (Comment number 45)
Comment number 46.
At 23:27 16th May 2012, newdwr54 wrote:Hi greensand:
I hope you agree with me that it will be a sad day when science shrugs its shoulders and says, like Stephen Fry, ""nobody knows! Categorically"?
The fact is that the scientific academies are already unanimously agreed about what's causing the observed warming and global heat build up. There is no real controversy at that level. We all know what it is they believe, as they have clearly stated their views, again and again.
Complain about this comment (Comment number 46)
Comment number 47.
At 23:45 16th May 2012, greensand wrote:46. newdwr54 wrote:
Hi DW
"I hope you agree with me that it will be a sad day when science shrugs its shoulders"
But it has! That is the whole point! Its CO2 look no further! The good and great say so, so it must be! Science does not and will not work that way! It is your following statement that is an absolute denial of the scientific method!
"The fact is that the scientific academies are already unanimously agreed about what's causing the observed warming and global heat build up. There is no real controversy at that level. We all know what it is they believe, as they have clearly stated their views, again and again."
A simple translation of which is "I believe so it must be"! Agreement does not and never will equate to fact no matter how many times it is stated.
Now explain why this "warming" is different from whatever has been causing surface temperatures to rise since the LIA and or whatever caused similar rates of change from 1920 to 1940 including similar effects upon high latitude areas?
Complain about this comment (Comment number 47)
Comment number 48.
At 00:12 17th May 2012, newdwr54 wrote:47. greensand wrote:
"Its CO2 look no further!"
I'm sorry, I can't agree with that. I can't agree that institutions like the UKRS and USNAS, etc would just blindly fall into some ideologically-driven view on such an important matter without carefully considering the alternatives. That view paints a depressingly bleak picture of the integrity and/or intelligence of the membership of these esteemed institutions.
As for my denying the scientific method:
We must assume that there is a certain level of expertise in these things, you and I. Just as we do with medicine. Just as we entrust people to run nuclear power stations, etc. You and I are not experts in any of these things. What qualifies us to say that the experts are wrong?
If the world weren't accumulating heat; if global average surface temps measured over appropriate time-scale weren't rising strongly, despite cooling ocean and orbital influences, then I'd agree that you would have a point.
But we now know, beyond any measure of reasonable doubt, that the world *is* accumulating heat energy (more has come in lately than has gone out). We know that when you measure surface temperatues using any data set you can name over the past 30 years temperatures are rising at an average rate of +1.6C per century.
I'm not an environmentalist, as I've previously been at pains to point out. I'm not even left-wing in most respects. In fact I work in the aviation industry, and potentially stand to lose a good deal from 'global warming'. But that doesn't mean it isn't true.
As ever time will tell. Let's hope you're right, and that some as yet unexplained and innocuous cause is behind the heat accumulation and warming, despite the massive scientific consensus supporting AGW.
Complain about this comment (Comment number 48)
Comment number 49.
At 00:23 17th May 2012, newdwr54 wrote:Just on a separate point re the post by Paul Hudson.
As ever Paul chose to show the UAH version of events, complete with Roy Spencer's totally inappropriate polynomial trend line (which Spencer says he adds for "entertainment purposes only"). In fact the graph above looks like a straight lift from Spencer's site.
Just for anyone who was curious to see what a UAH data set *linear* trend line looks like (i.e. one that reflects "temperatures over time", as opposed to one that offers "entertainment" value), I thought I'd post this link:
https://www.woodfortrees.org/plot/uah/plot/wti/trend
Complain about this comment (Comment number 49)
Comment number 50.
At 00:47 17th May 2012, greensand wrote:48. newdwr54 wrote
“That view paints a depressingly bleak picture of the integrity and/or intelligence of the membership of these esteemed institutions.”
Correct! My absoloute major concern. If you think that the way that “these esteemed institutions” have handled the accusations of malfeasance has any scientific never mind moral base then you are very sadly mistaken.
“As for my denying the scientific method”
You did! No question, you stated that because somebody else says so then it must be! No it isn’t, either prove it or butt out! Just quoting numerous agreements proves nowt!
“If the world weren't accumulating heat;”
Now explain why this "warming" is different from whatever has been causing surface temperatures to rise since the LIA and or whatever caused similar rates of change from 1920 to 1940 including similar effects upon high latitude areas?
Also explain what the mechanism is that allows the land of this planet to warm whist the oceans do not? I will modify Stephen Fry and say that "nobody YET knows", Catagorically!
Complain about this comment (Comment number 50)
Comment number 51.
At 01:16 17th May 2012, RobWansbeck wrote:@48, newdwr54 wrote:
“ … That view paints a depressingly bleak picture of the integrity and/or intelligence of the membership of these esteemed institutions. … “
I entirely agree. Perhaps you could ask Peter Gleick, the chair of the American Geophysical Union's Task Force on Scientific Ethics, for his opinion on the matter?
Complain about this comment (Comment number 51)
Comment number 52.
At 08:37 17th May 2012, lateintheday wrote:QV @43 regarding the AO.
I can see what you mean. My understanding was that they are implying that the low or high pressure variations over the UK (for example) are primarily caused by the AO and the shift in jet stream etc. The AO being to large extent, a weather controller for the NH. This is in contrast to the AO being the result of other weather patterns or simply part of the mix. How they've come to this conclusion is not explained on the icelights page itself.
The positive/negative phases seem to be titled the wrong way round intuitively, which adds to the confusion.
Complain about this comment (Comment number 52)
Comment number 53.
At 09:07 17th May 2012, lateintheday wrote:Quake, I didn't say he shouldn't have reported it. The point is that if the findings were considerably at odds with the mainstream, why were they not reigned in by the likes of Serreze. Let me put this another way.
When high profile AGW skeptics get a mention in the press, the reporters should and often do, ask the mainstream for their views. Can you imagine Hansen (or any of the NASA scientists) saying, "while we disagree, this Skeptic is a bright chap and it wouldn't surprise me if he were right."
If Serreze doesn't have a strong view on whether 'ice free arctic' will occur in 2012, 2030 or 2100 then clearly, he hasn't actually got a handle on it at all. That hasn't stopped him pronouncing 'death spiral' or 'the arctic is screaming'.
Complain about this comment (Comment number 53)
Comment number 54.
At 10:47 17th May 2012, QuaesoVeritas wrote:#44. - newdwr54 wrote:
"Despite neutral ENSO conditions, surface temperatures are rising. What's causing this?"
Actually, the very latest AMSU CH5 temperature figures suggest that temperatures have been falling since the beginning of May, and since temperatures normally rise at this time of year, the anomally has also been falling, even faster. The daily anomaly was about 0.238c on May 1st, but was only 0.048c on May 15th, although the cumulative mean is still above the end of April.
This would suggest that the warming which ocurred during March & April may at least have slowed down, so this may reflect the neutral ENSO conditions.
Complain about this comment (Comment number 54)
Comment number 55.
At 12:05 17th May 2012, lateintheday wrote:QV - looking again at your numbers for the N.H (sans N Pole) it seems the peak anomalies are obviously close to the equinoxes.
Would it not be reasonable to postulate that arctic sea ice extent is the cause of this. As the sun peeps its head over the horizon in spring at the higher latitudes, a slightly lower sea ice maximum extent means reduced albedo but more importantly, more open water (which is warmer than the air) to transfer heat to the atmosphere.
The ocean/atmosphere heat transfer is the major player here since insolation is still very weak. The anomalies reduce throughout the summer as insolation becomes the major or perhaps equivalent factor in setting the temps.
In September, the weakening insolation allows the ocean/atmosphere heat transfer to take over again, thus increasing the anomaly if there is lower than average sea ice minimum extent. (Which of course there has been)
Once sea ice growth begins in earnest, there would be little in the way of insolation to bump up anomalies, since albedo during late autumn early winter is effectively non existent. The growth in sea ice follows its natural course and dampens the ocean/atmosphere heat transfer which in turn lowers the potential anomaly.
I think that the seasonal growth in arctic sea ice has been a little slower/later than average for some years, and perhaps that explains why the North polar region continues to show an anomaly increase through to December. By January however, the maximum extent is eventually reached. This maximum continues to be reasonably close to average, hence the reduction in the anomaly until the cycle begins again.
I suppose a similar argument may be made for atmospheric CO2 seasonal variation, although that could lead to 'sensitivity' issues which would be difficult to resolve.
Complain about this comment (Comment number 55)
Comment number 56.
At 13:24 17th May 2012, ManmadeupGW wrote:@ Lazuras
I do not intend to deal with your arguments about the Junkett scientists who annually predict ice free conditions in the arctic other posters have dealt with you admirably on this.
You make this statement:
"2007 was the first year that the Northwest passage open - a forecast by Hansen made in 1981 - and it has open every summer since."
Of course it ain't true. Furthermore it is misleading. So how many large ships are sailing every year throught the northwest passage? Well, 10 with Ice breakers?
https://www.enr.gov.nt.ca/_live/pages/wpPages/soe_human_activities.aspx
A record number of vessels transited through the Northwest Passage in 2010.
Since the first crossing of the Northwest Passage by Amundsen in 1906, few ships (less than 1 every 10 years on average) had successfully completed the full passage until 1969, when the oil tanker SS Manhattan, refitted with an ice-breaker bow, crossed the Passage from east to west, and thenreturned east. That trip resulted in ten transits being recordedthat summer, as four icebreakers escorted the oil tanker. The number of completed trips through the Arctic Ocean increased in the late 1970s, mostly due to the availability of icebreakers and other ships capable of navigating in difficult northern waters. This is particularly the case for Arctic tourism10.
More recently, there has been an increase in ship-based research in the Northwest Passage and the Beaufort Sea, attributable to concern over the effects of climate change in arctic marine ecosystems, culminating in more research efforts during the International Polar Year7.
From the 1980s on, voyages through the Passage have become an annual event. The number of transits increased from 4 per year in the 1980s to 20 per year in 2009-2010. These transits are mostly completed by icebreakers on coast guard and research duties, passenger ships offering Arctic tourism opportunities, and tug and supply vessels, some with barges. Other types of ships completing the passage include oil/fuel tankers, drill ships, seismic vessels, cable vessels, and buoy tenders. The greatest portion of the increase in transits since the late 1980s is due to an increase in shipping activities by tug-supply vessels - half of them with icebreaking capacity - involved in the oil and gas industry in the Beaufort Sea.
Complain about this comment (Comment number 56)
Comment number 57.
At 13:31 17th May 2012, QuaesoVeritas wrote:lateintheday,
In relation to the AO, the NSIDC page states that the positive phase tends to bring warmer weather to middle latitudes, while the negative phase presumably tends to bring colder weather. It isn't clear what the corresponding effects are on the N.Pole region temperatures.
If the mid latitudes are warmer during a positive phase, there should be a positive correlation between the AO index and temperature anomalies.
I downloaded the AO data since 1950, and compared that with RSS temperature anomalies since 1979, and calculated the correlation between the AO and RSS over 12 month and 10 year rolling periods.
In the case of the RSS anomalies for the region 20 to 60 degrees (which I have calculated), the 12 month rolling correlation fluctuates wildly from positive to negative, although the majority are positive, and the range is between about +0.9 and -0.7.
For the 10 year rolling correlation, the figures are always positive, ranging from about +0.17 and +0.47. So the correlation is positive, although not strongly or consistently so.
In the case of the RSS N.Polar region, 60 to 82.5 deg., again the 12 month correlation fluctuates wildly between about -0.8 and +0.7 and the 10 year is consistently negative, between about -0.07 and -0.29, so in the case of the N.Pole, there appears to be a weak negative correlation between AO and RSS anomalies.
So this does seem to support the "theoretical" effects of positive and negative AO phases, although as I say, the longer term correlation isn't high.
I am not sure what the significance of the above is for the large fluctuations in N.Pole anomalies.
I will respond on your post #55 later.
Complain about this comment (Comment number 57)
Comment number 58.
At 13:35 17th May 2012, QuaesoVeritas wrote:ManmadeupGW,
I also suspect that the advent of satellite navigation and other high-tech aids has made it easier to navigate the N.W. passage.
Complain about this comment (Comment number 58)
Comment number 59.
At 15:00 17th May 2012, quake wrote:Re 56. ManmadeupGW
"Of course it ain't true."
It is true. Amundsen took 3 years to navigate it, having to stop each winter and wait for the ice to clear again. It wasn't open. Icebreakers are breaking through ice. Ie it isn't open.
Only in recent years has the Northwest passage opened allowing non-reinforced boats to get through
https://news.bbc.co.uk/1/hi/world/americas/6995999.stm
Complain about this comment (Comment number 59)
Comment number 60.
At 16:58 17th May 2012, lateintheday wrote:"I will respond on your post #55 later"
That sounds ominous QV. It was just a science illiterate's musings, put forward since no one else had jumped in. I'll put my crash helmet on when 'later' arrives!
Complain about this comment (Comment number 60)
Comment number 61.
At 20:21 17th May 2012, QuaesoVeritas wrote:#60. - lateintheday wrote:
"That sounds ominous QV. It was just a science illiterate's musings, put forward since no one else had jumped in. I'll put my crash helmet on when 'later' arrives!"
Not really, just haven't had time to read it and take it all in yet.
Complain about this comment (Comment number 61)
Comment number 62.
At 20:24 17th May 2012, QuaesoVeritas wrote:Tonight at 20:30 on ITV1+1:
The Great British Weather:
"Jonathan Maitland investigates the impact of our changing climate as Briatain goes from the hottest March since 1957 to the wettest April since records began".
I don't suppose they will mention that the MO forecast a dry April!
Sorry such short notice.
Complain about this comment (Comment number 62)
Comment number 63.
At 23:43 17th May 2012, newdwr54 wrote:Just a further comment on the UAH graph featured by Paul Hudson in the above post. The trend line used is third-order polynomial. Don't panic. I'm not sure what it means either. In basic terms, and I stand to be corrected by more or less anyone, a polynomial trend is a type of linear trend, but one that reacts to short term fluctuations, depending on what 'order' you chose to set it at (1-6).
In other words, if you have a temperature series running from point 'A' (Dec 1979 is the UAH point 'A') to point 'B' (April 2012 in the UAH series) then you can either just add a simple linear trend line, which is the numerical "Trend" value that UAH actually *do* publish monthly in their data release; or you can mess around with polynomial trends to achieve the desired effect for public consumption.
If, for whatever reason, you aren't keen on publishing your graph with a simple linear trend (even though it runs along a simple linear series - time!), then polynomial trends offer you a raft of options.
Roy Spencer started out by issuing his UAH data to blogs such as WattsUpWithThat with no trend line - for whatever reason. After correspondence with a certain Canadian engineer a few years back, Spencer added a fourth order polynomial trend to the UAH data. This type of trend line shows up to three peaks and troughs in any long term linear data set.
At the time, this left an obvious 'downturn' at the end of the latest temperature series, implying that the data had entered a 'cooling' period. As it turned out, the data depicted using the fourth order trend began to flat line, and Roy once again issued his data with no trend line (even though UAH continued publishing the strongly warming linear value in numerical form).
More recently Spencer has used the option of a third-order linear trend. This has once again produced the 'apparently' desired effect of leaving the trend line once again looking like global temperatures have just entered a cooling period (see the graph above).
If you use the same UAH data and apply a 4th order trend now, you will find that the latest end of the curve is flat. If you use a 6th order trend, you will find a sharp upward peak in the latter end of the data. But Roy has elected to use a 3rd order trend - "for entertainment purposes".
Basically what I'm saying is that Roy Spencer is chopping and changing his choice of trend line to suit his underlying views - that there is no warming worth worrying about. This is deeply misleading in my view. By reproducing Spencer's graph without caveats, Paul Hudson is responsible for spreading Spencer's misinformation, again, in my view.
Complain about this comment (Comment number 63)
Comment number 64.
At 23:53 17th May 2012, newdwr54 wrote:54. QuaesoVeritas wrote:
"Actually, the very latest AMSU CH5 temperature figures suggest that temperatures have been falling since the beginning of May, and since temperatures normally rise at this time of year, the anomally has also been falling, even faster."
Can you confirm whether May 2012 to date is above or below average in the AMSU ch5 series? I have it slightly above.
Complain about this comment (Comment number 64)
Comment number 65.
At 00:47 18th May 2012, lateintheday wrote:newdwr54 . . . but I thought you trusted scientists? Here you make a very serious accusation against both the host of this blog and, whether you like it or not, a very well respected scientist. Further, you do this whilst admitting a lack of statistical skill which would otherwise qualify you to comment on the appropriateness of a polynomial fit.
Excuse me, but I thought that stepping beyond one's level of competence and talking out of the wrong orifice was my job on this blog.
(That said, PH should have included Spencer's standard caveat.)
Complain about this comment (Comment number 65)
Comment number 66.
At 00:53 18th May 2012, RobWansbeck wrote:@63, newdwr54 wrote:
“ … Just a further comment on the UAH graph featured by Paul Hudson in the above post. The trend line used is third-order polynomial. Don't panic. I'm not sure what it means either. In basic terms, and I stand to be corrected by more or less anyone, a polynomial trend is a type of linear trend, but one that reacts to short term fluctuations, depending on what 'order' you chose to set it at (1-6). … “
A linear trend is a first-order polynomial although it can't be a polynomial because there is only one x term, e.g. y = ax + c. A second-order polynomial adds an x squared term and a third-order adds an x cubed term etc.
Polynomials are not linear since linear means a straight line relationship and are not really trends. They are simply equations chosen to give a required degree of fit; as a rule a higher order will give a better approximation to a given data set.
When y is known to be a function of x a polynomial can sometimes give a good approximation to what otherwise might be a very difficult problem.
In this case it really is 'for amusement purposes only'.
Complain about this comment (Comment number 66)
Comment number 67.
At 02:02 18th May 2012, Lazarus wrote:ManmadeupGW
What quake said.
;-)
Complain about this comment (Comment number 67)
Comment number 68.
At 07:52 18th May 2012, QuaesoVeritas wrote:#64. - newdwr54 wrote:
"Can you confirm whether May 2012 to date is above or below average in the AMSU ch5 series? I have it slightly above."
Not entirely sure which figure you are referring to.
As at the 15th., I have the daily temp. 0.017c above the daily average but likely to be below any day now, the cumulative May figure about 0.147c above the cumulative average, but the cumulative 2012 figure 0.076c below the cumulative average.
Complain about this comment (Comment number 68)
Comment number 69.
At 08:00 18th May 2012, QuaesoVeritas wrote:#63. - newdwr54 wrote:
"Basically what I'm saying is that Roy Spencer is chopping and changing his choice of trend line to suit his underlying views - that there is no warming worth worrying about. This is deeply misleading in my view. By reproducing Spencer's graph without caveats, Paul Hudson is responsible for spreading Spencer's misinformation, again, in my view."
I agree that Roy Spencer seems to be using whichever polynomial that looks like temperatures are declining. I think that the last time I checked, the 3rd order polynomial was the only one which currently showed a decline.
However, I disagree that Paul Hudson is being misleading by simply reproducing the graph from Spencer's web page.
The 1st order, or linear trend does show the long-term trend, but I don't think it is any more indicative of how temperatures are going in the shorter term than the 3rd order one.
Complain about this comment (Comment number 69)
Comment number 70.
At 08:05 18th May 2012, QuaesoVeritas wrote:#66. - RobWansbeck wrote:
"In this case it really is 'for amusement purposes only'."
Yet Roy Spencer happens to use the 3rd order polynomial, which shows a recent decline, when in my opinion, some of the other polynomials, which show a recent rise, are even more "entertaining".
Complain about this comment (Comment number 70)
Comment number 71.
At 08:56 18th May 2012, MangoChutney wrote:@openside50 #14
FYI
RADARSAT data seems to suggest:
Overall, however, the observed changes have little impact on the mass balance of the region. We therefore conclude that in contrast with their counterparts in the Amundsen and Bellingshausen Seas (Rignot et al., 2008) the ice streams and ice shelves in the broad region under investigation herein have not been changed in a significant way in the past 12 yr, which suggests that the ice dynamics of the entire region does not have a strong impact on the mass budget of the Antarctic continent.
"Twelve years of ice velocity change in Antarctica observed by RADARSAT-1 and -2 satellite radar interferometry" Scheuchl et al 2012
Only 12 years worth of data, but of interest the next time somebody suggests we will all drown when the ice melts.
Complain about this comment (Comment number 71)
Comment number 72.
At 11:34 18th May 2012, QuaesoVeritas wrote:Apparently the latest WWF "Living Planet Report", suggests that "economic growth should be abandoned", for the sake of the planet.
https://www.theregister.co.uk/2012/05/16/wwf_living_planet_report/
I haven't read the report, so I only have "The Register" comments to go on, but I have to say that on the basis of that, I go along with the WWF on this.
But it's nothing to do with "climate change", but with the sustainability of human activity.
The idea that we can continue with the current rates of population and economic growth for much longer, is fundamentally flawed.
Unfortunately, as a sceptic on "climate change", I find myself on the same side as those who disagree with this.
Complain about this comment (Comment number 72)
Comment number 73.
At 11:56 18th May 2012, MangoChutney wrote:@72 QuaesoVeritas
The problem with those that advocate population control is population control is always for others not for them or theirs (not that I'm suggesting QV agrees with this, I don't know him/her)
Complain about this comment (Comment number 73)
Comment number 74.
At 12:13 18th May 2012, greensand wrote:72. QuaesoVeritas wrote:
Thanks for the link, just put it up at BH. Will have a look at the report later.
"The idea that we can continue with the current rates of population and economic growth for much longer, is fundamentally flawed."
I understand your concerns and I do not have any real answers but doubt very much that bring all down to the lowest common dominator will gain much traction.
Also I am quite sure that any proposed reform must be based on sound scientific proof if not it will fail.
Complain about this comment (Comment number 74)
Comment number 75.
At 12:20 18th May 2012, QuaesoVeritas wrote:#73. - MangoChutney wrote:
"The problem with those that advocate population control is population control is always for others not for them or theirs (not that I'm suggesting QV agrees with this, I don't know him/her)"
I am not sure that anyone is advocating "population control", more "population restraint".
In any case, even "population control" wouldn't cause any actual harm to anyone currently living. In fact, it would have major benefits.
I don't actually think that it is likely that there will be any significant voluntary restraint in either population or economic growth, but it may be imposed upon us by circumstances beyond our control.
It is what the authors of "Limits to Growth" call "overshoot and collapse", which, given human psychology, is almost inevitable at some stage.
Complain about this comment (Comment number 75)
Comment number 76.
At 12:49 18th May 2012, RobWansbeck wrote:@70, QuaesoVeritas wrote:
“ Yet Roy Spencer happens to use the 3rd order polynomial, which shows a recent decline, when in my opinion, some of the other polynomials, which show a recent rise, are even more "entertaining". “
Real climate scientists have developed techniques to show a recent rise from almost any data. Check-out Michael Mann's end reflection or Stefan Rahmstorf's infamous method and more recently Tamino's choice of smoothing parameter.
Perhaps Roy Spencer is having a laugh at the real climate scientists who expect their methods to be taken seriously. :)
Complain about this comment (Comment number 76)
Comment number 77.
At 20:25 18th May 2012, QuaesoVeritas wrote:Hmm, I was continuing my calculations of the average N.Pole monthly anomalies, according to RSS, splitting the series into the periods 1979-1988, 1989-1998, 1999-2008, and 2009-2011/12, to see how the anomalies have changed with time.
Then I noticed an apparently strange phenomenon, i.e. that the average monthly anomalies for 1979-88 and 1989-1998, were equal and opposite to one another, so that when you added them together, the average monthly anomalies were all zero.
After a while, I realised that this was because the base period for RSS is 1979-1998, so by definition, the average anomalies for that period are all zero.
I am still trying to get my head around this, but I think it makes the monthly anomalies useless for calculating any seasonal pattern, at least over the base period.
Complain about this comment (Comment number 77)
Comment number 78.
At 09:10 19th May 2012, Tim wrote:John Cogger. I wondered why you thought you was such an expert in climate change? Do you have a vested interest in making a living out of this scam? Remember before April we had drought conditions, within month everything was normal. The weather will right things in its own time, without man's intervention. It all reminds me of King Canute.
Complain about this comment (Comment number 78)
Comment number 79.
At 09:14 19th May 2012, Tim wrote:I remember Al Gore and his inconvenient truth. If he got rid of a few houses and cars, then that would be better than preaching to others about the damage we are doing to the planet. He is probably one of the worst offenders for flying around the world. He wants other people to sacrifice, while he carries on being greedy. Prince Charles also springs to mind.
Complain about this comment (Comment number 79)
Comment number 80.
At 18:40 19th May 2012, john_cogger wrote:@78 Tim
I'm as much as an expert as everyone else on here. i.e. not much.
I do have a vested interest, so do you, so does everyone, as we all live on this little blue dot.
The weather will right things? Is this a law of averages thing? Or science?
Complain about this comment (Comment number 80)
Comment number 81.
At 08:44 20th May 2012, Tim wrote:John thanks for being honest. I rate health very highly on my agenda, will become a vegan at some stage and have no issue with wind turbines around every village, if they are really cost effective. But what I don't like are scientists who sometimes know less than us, scaring people into knee jerk reactions. In my occupation I come up against the NHS who are far less experts on health than myself, they deal with the effect not the cause.
Complain about this comment (Comment number 81)
Comment number 82.
At 11:47 20th May 2012, mjmwhite wrote:Take away the RT bias and there is a story here
https://www.youtube.com/watch?v=Egy4drxs8l8
"Tens of millions of pounds of UK aid money has been spent forcibly sterilising Indian women. Many have died being mistreated, causing outrage from those who suspect Britain simply wants to curb the country's population for alterior motives. RT's Priya Sridhar has the details of this controversial programme"
Complain about this comment (Comment number 82)