How could I record my data?
All science investigations or experiments produce data.
Recording data accurately is essential to make sure that all results are reliable and trustworthy.
Scientists use a range of methods to record and collect data, from handwritten sheets to artificial intelligence (AI) assisted digital records.
A simple way to record data is by using a table.
Tables
Tables are ideal for collecting data during an experiment. They allow the results to be read simply before they are interpreted.
Tables organise data in rows and columns. It is important to use clear headings for each column to help people understand what the date represents.
For example, if you were to conduct an experiment on plant growth, you might organise a table like this:
| Plant | Growth | Amount of water |
|---|---|---|
| Sunflower | 3cm | 20ml |
| Cress | 1cm | 20ml |
| Basil | 2cm | 20ml |
Tallying
You can record your results on a tally chart as you go along.
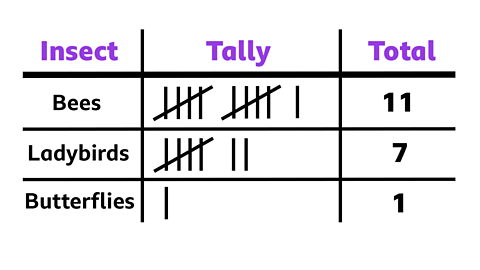
Tallying is a simple way of recording data using groups of five, which makes it easier to see the total.
For example, if you were to conduct an investigation into insects found in a garden, you might create a tally to record your data.
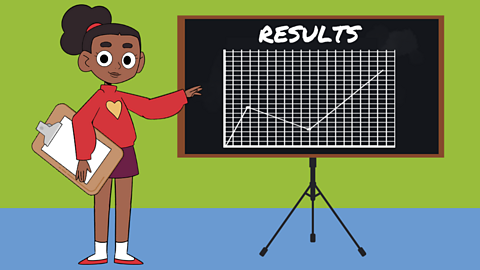
Watch: Recording and presenting data
Fran: To find the answers to their questions, scientists make lots of observations and take lots of measurements to learn more aboutthe world.
This information is called data.
And scientists look closely at this information.
How you record and present your data can be the difference between success and failure?
The information we gather during an experiment or an observation does need to be recorded so we can make sense of it later anddraw conclusions.
And to do this, you can use tally charts or tables.
Tables are a great way to record our data.
Now let's see how my researcher is recoding and presenting their data.
Child: I just finished my experiment to see how the shadow changes when I move my torch closer or further from away from my toy.
I've recorded my findings in this table.
Here I put my variable which is what I'm changing, which is the distance of the torch from my toy in centimetres.
And here is where I've recorded my results, which is the length of the shadow created in centimetres.
So, now I have my data how do I make sense of it?
I need to use a graph.
But which one?
We have bar charts, pie charts, line graphs, and scatter graphs.
I think I'm going to use a line graph, because I'm comparing two sets of data.
Along the bottom we have the distance of the torch from our object in centimetres.
Up the side we put the length of shadow we recorded for each distance.
Then we mark our results with a little 'X' and connect them with a line.
Now, I can clearly see my data.
Fran: So next time you're conducting an experiment, remember to think about how you're going to record and present your data.
How could I present my data?
When collecting data from a science experiment, it is also important to consider which is the best way to present it.
Presenting data the right way helps others to understand your findings.
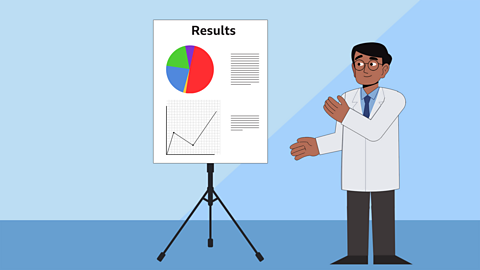
Charts and graphs
Once results are collected in a table, scientists often use graphs to present their data in a way that shows patterns.
Types of graph
| Bar chart | Good for comparing different groups | Example: Plant growth in different sunlight conditions |
| Line graph | Useful for showing changes over time | Example: Temperature changes during an experiment |
| Pie charts | Great for showing part of a whole | Example: Distribution of colours in a set of sweets |
| Scatter graphs | Can show relationships between two variables | Example: Measuring rainfall |


It's important to remember when drawing a graph, to label the axes (horizontal and vertical) clearly so that people can see which one represents the independent variables, and which represents the dependent variables.
Images and diagrams

Drawings or photographs are useful to show observations.
They are brilliant in showing visual changes that would otherwise be tricky to imagine.
Labelled, scientific drawings can aid a scientific explanation to help understanding.
Written descriptions

Alongside your data presentation, write a clear explanation of what the data means.
Use simple language to describe your findings, highlight key points and explain any trends you can see.
By organising and presenting your data thoughtfully, you can help others appreciate and understand the results of your experiment.
Examples of how to present data
Results from experiments are often presented in tables and shown in charts and graphs to make them easier to understand.
Here are four examples looking at eye colour, reactions and age, heart rate and exercise activities.
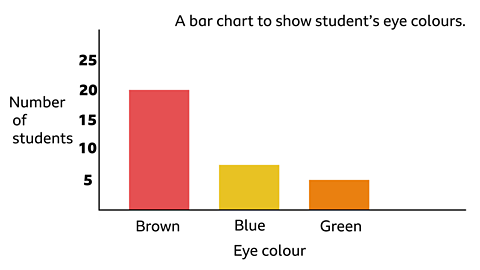
Example 1
| Eye colour | Students in class |
|---|---|
| Brown | 20 |
| Blue | 8 |
| Green | 2 |
Example 2
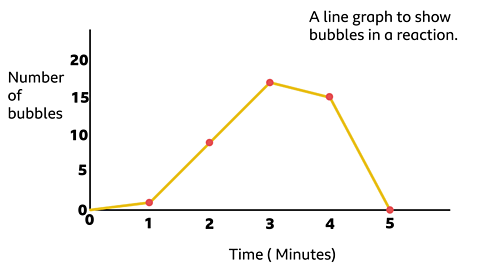
| Time taken (in minutes) | Bubbles produced in reaction |
|---|---|
| 1 | 1 |
| 2 | 9 |
| 3 | 17 |
| 4 | 15 |
| 5 | 0 |
Example 3
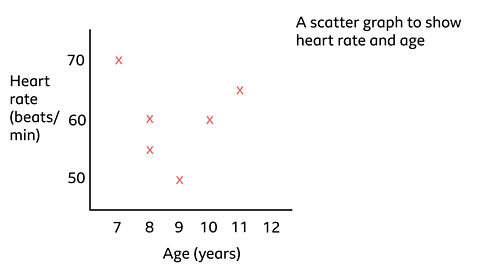
| Age (years) | Heart rate (beats per minute) |
|---|---|
| 8 | 55 bpm |
| 8 | 60 bpm |
| 10 | 60 bpm |
| 7 | 70 bpm |
| 9 | 50 bpm |
| 11 | 65 bpm |
Example 4
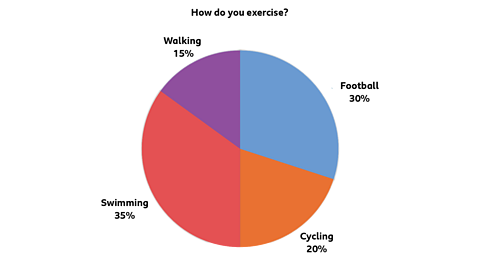
| How do you exercise? | Percentage |
|---|---|
| Football | 30% |
| Cycling | 20% |
| Swimming | 35% |
| Walking | 15% |
Can you explain why the sets of data in the examples above are presented using a bar chart, line chart, scatter graph and a pie chart?
- Example one
This data records eye colour which is discrete data, therefore we can use a bar chart to present the data as it is a series of whole numbers. - Example two
This experiment records bubbles during a reaction over a length of time. This is continuous data so is best presented in a line graph. - Example three
This looks to see if there is any pattern between age and heart rate, so it is best presented in a scatter graph. - Example four
The survey records the different ways people exercise by using percentages. Pie charts are useful for visually representing data as proportions of a whole.
Important words

Data – Information that results from experiments, tests and research.
Dependant variables – The variable that a scientist measures or observes.
Experiment – A scientific procedure, often in a laboratory, that produces results.
Findings – Also known as results, findings are the information and data received at the end of a test or experiment.
Graphs – Visual ways of presenting data, these can include bar charts, line graphs, pie charts and scatter graphs.
Independent variables – The variable that a scientist changes on purpose to see how it affects something else.
Observations – Viewing and noticing patterns and unusual things in scientific experiments, tests and data.
Presenting data – How data and results are presented, such as in graphs and tables or scientific reports.
Table – A simple way to record and organise data with rows and columns.
Tally – A way of recording data by counting in groups of five.
Activities
Activity 1 – Take the quiz
Activity 2 – Practice questions
Here are a couple of practice scenarios. How would you present the scientificdata in each example?
- Firstly, how would you present the data of colours of car you see?

This data would be best presented in a bar chart, because the colours can be in any order.
How would you best present data recording the number of birds in your garden or local park at different times of the day?

This data would be best presented in a line graph, because the times of day will all be in order.
Activity 3 – Displaying results

New game! Horrible Science: Stinky Space. game
Join Pipette on her epic mission and learn some revolting facts about space along the way.

More on Working scientifically
Find out more by working through a topic
- count10 of 10
- count1 of 10

- count2 of 10
- count3 of 10