Types of scientific results
Results from scientific investigations or experiments can come in lots of different ways.
If your experiment was to investigate the leaves on the plants in your garden or local park, then it is likely that you would draw them or take photographs. Scientific drawings are often very simple sketches.
If results come as numbers, scientists usually put them in a table. This is a much easier way of presenting data than writing.
Watch: Presenting data
Fran: When scientists complete an investigation, we often have a lot of data.
And data is the word we use to describe what we find.
And data presentation helps make our findings clear, easy to read and meaningful.
And there are many ways to present data.
You can use a drawing, you can use a labelled diagram, a bar graph or chart, or a table.
And you need to pick the right one for your investigation and lay out the information clearly so it can be understood by whoever is reading it.
So, let's find out how one of my investigators is presenting their data.
Child: I'm investigating how much the gas in these fizzy drinks weigh.
First, I'm going to pour some of the liquid into my glass and measure the weight before we let the gas out.
I have a table to record my results.
Now we shake our drink and let the gas out slowly.
I'm going to do this for 30 seconds.
Time to weigh again.
The difference between the first and second measurements will give me the weight of my gas.
Time to test it out on my other two drinks.
Now that I have all my results, I think I need a bar graph.
For a title lets do 'Weight of Gas in Fizzy Drinks'.
Ok, now we need to label our axes, so we've got X axis, I'll do 'Name of drinks', and then I'll do 'Weight in grams' for this one.
Now I'm all done.
You can see that the gas in the orange drink weighs more than the gas from the lemonade and the cola.
Fran: Brilliant job!
So, remember, when you're investigating you need to think about the best way to present your findings, so that everyone can learn from your investigation.
Have you ever seen a flag being raised, or wondered how a mechanical clock works? Let’s take a look at some of the simple mechanisms that they use.
Pulleys and gears.
When a flag is raised, it will often be lifted using a pulley mechanism.
A pulley is a wheel on a fixed axle. The wheels normally have a groove in them, to guide a rope or cable through.
One end of the rope is attached to a load that needs to be lifted. Then the other end of the rope is looped through the groove on the pulley wheel.
When you pull the opposite end of the rope, the pulley mechanism changes the direction of the force applied, which lifts a load like this.
The more pulley wheels you add to the mechanism, the less force is required to move the load. Pulleys are used to help lift many things. Lifts, window blinds and cranes often use pulley systems. Let’s change gear to look at gears.
Gears are also wheels attached to a fixed axle, but rather than a groove, they have little teeth that can slot together with other gear wheels. When one gear wheel turns, the other turns too, in the opposite direction.
If the gear wheels are different sizes, they can be used to change the rotating speed and the turning force of the other gear wheel.
For example, if we have a larger gear wheel attached to a smaller gear wheel like this, when we turn the larger gear wheel, the smaller gear wheel rotates more quickly. This is how bicycles work.
They use a chain to connect the gears. When you turn the pedals, the force turns the larger gear. This then turns the smaller gear, which rotates much more quickly on the back wheel, making the bicycle move forward.
Some bicycles also have gear systems that allow you to change the size of the gear wheel, making it easier to pedal uphill.Gears are also used in clocks, watches and engines.
So, there we are, gears and pulleys.
Mechanisms that use wheels and circular motion to make things move.
Results in a table
Here are some examples of tables created from two different experiments.

Example 1
This shows a table created from an experiment showing the height at which a toy car will roll down a ramp on different surfaces.
| Material | Height the toy car started to roll (in cm) |
|---|---|
| Wood | 6cm |
| Sandpaper | 8cm |
| Carpet | 10cm |

Example 2
You could also draw a table to show how long it takes an ice cube to melt.
| Time passed (in mins) | Height of the ice cube (in mm) |
|---|---|
| 1 minute | 80mm |
| 2 minutes | 75mm |
| 3 minutes | 68mm |
Presenting and publishing results
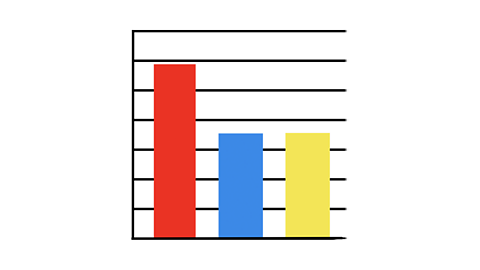
This same information can be shown in a bar chart. The size of the bar shows the size of the value.
When scientists find out something new that is important they write a report about it. These are often published in scientific magazines. Scientists also make posters of their findings and talk about them with other scientists in meetings.
Important words
Important words about presenting data!
Bar chart - A bar chart, or bar graph, shows data in rectangular blocks.
Experiment - A scientific task to find out the answers of a specific problem.
Investigate - To examine data or facts around a particular subject.
Results - The products of an experiment, results show you what you found.
Scientist - Someone who studies and becomes an expert in any of the natural sciences.
Activities
Activity 1 – Quiz
Activity 2 – Conduct an experiment and present your data
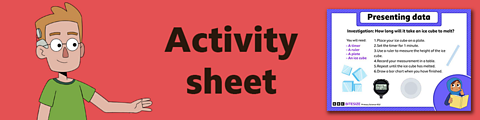
Year 3 investigation: When will it move?
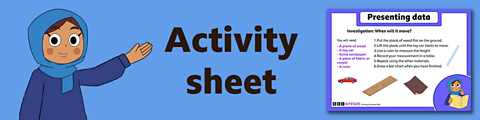
Year 4 investigation: How fast does an ice cube melt?
New game! Horrible Science: Stinky Space. game
Join Pipette on her epic mission and learn some revolting facts about space along the way.

More on Working scientifically
Find out more by working through a topic
- count4 of 10

- count6 of 10

- count7 of 10