Key points
Link together two or more outcomes. In selecting people at random for a survey a combined event could be choosing a person over 25 who wears glasses, this combines choosing a person over 25 and choosing a person who wears glasses. involve two or more separate A possible outcome, for example ‘heads’ when a coin is tossed.. Rolling a die and flipping a coin or rolling two dice produce combined events.
The Multiplying the number of outcomes of each event to find the total number of possible outcomes of a combined event. can be used to find the total number of outcomes of combined events.
The A potential result. When a coin is tossed there are two possible outcomes, ‘head’ or ‘tail’. When a normal die is rolled there are six possible outcomes, 1, 2, 3, 4, 5 and 6. of combined events may be listed or written in the form of a table called a The sample space is the set of all possible outcomes. For a single event this can be a list of outcomes, written in set notation S = {…….}. For combined events this is usually presented in a table. The sum of all the probabilities for all the events in a sample space is 1. . These can be used to find the probability of a particular outcome.
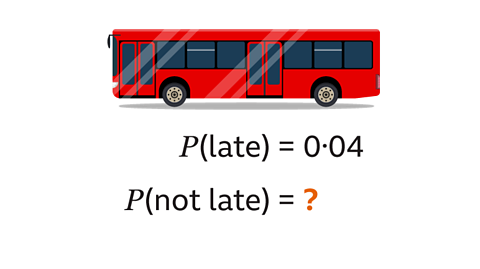
The The chance of an event happening. The probability of an event has a value from 0 to 1 and is written as a fraction, a decimal or as a percentage. The notation for the probability of an event is P(event). is usually written as a fraction. The total number of possible outcomes is the denominator. The number of times the outcome is possible is the numerator.
Listing outcomes to find the probability of combined events
Taking a logical and organised approach will make sure that all the outcomes are found. Just using the first letter of words, eg B for ‘blue’ can make listing faster.
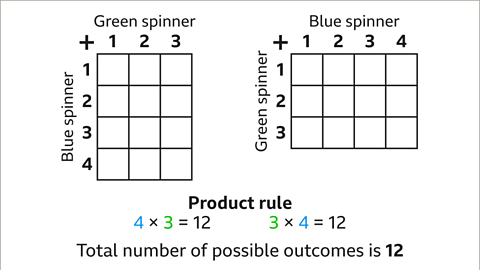
To work out the total number of outcomes use the product rule:
- Multiply the number of outcomes for each event.
To list all the outcomes for a pair of combined events:
- Start with one event, write down one of its outcomes paired with each outcome of the second event.
- For the same event, write down another of its outcomes paired with each outcome of the second event.
- Repeat until all the outcomes of the first event have been paired with each outcome of the second event.
Where there are three or more events, write the list carefully to make sure all outcomes are listed.
Write the probability of the combined events as a fraction.
- The denominator is the total number of possible outcomes.
- The numerator is the number of times the particular outcome occurs.
- It may be possible to simplify the fraction.
Examples

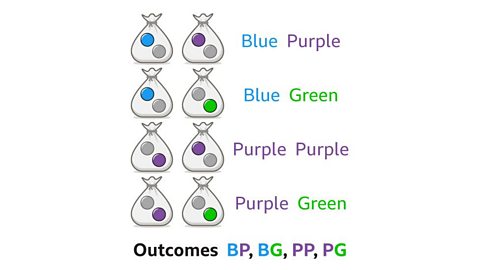
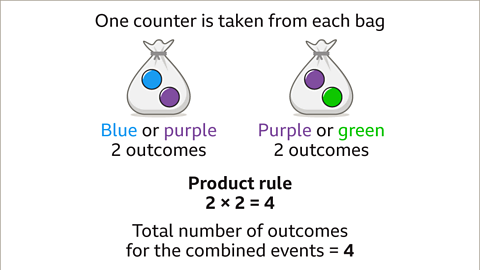
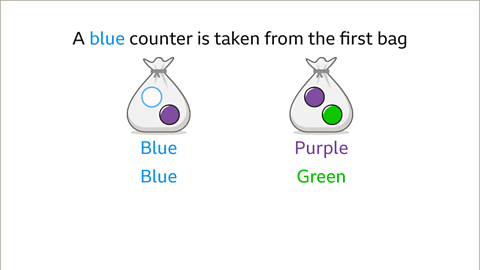
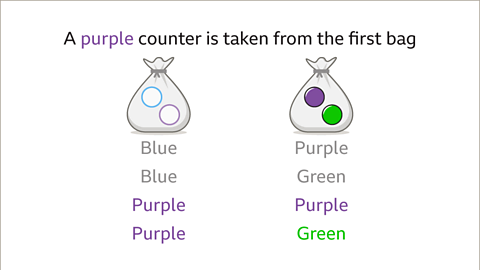
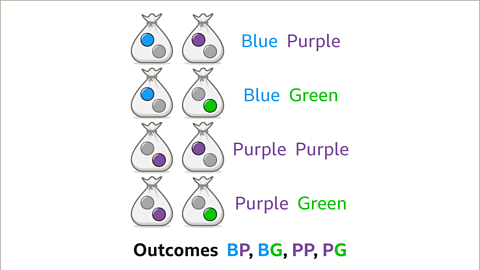
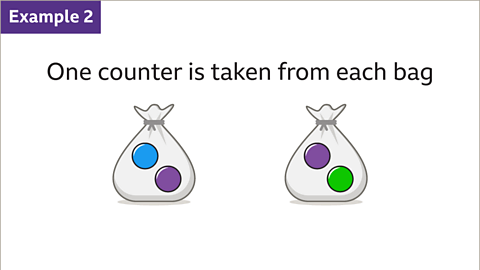
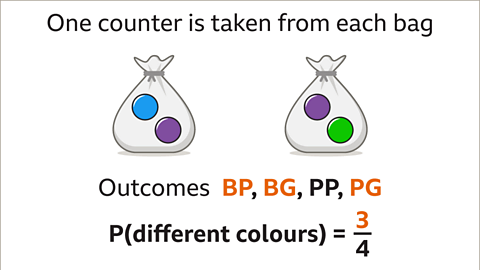
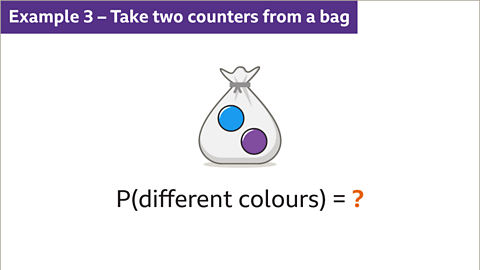
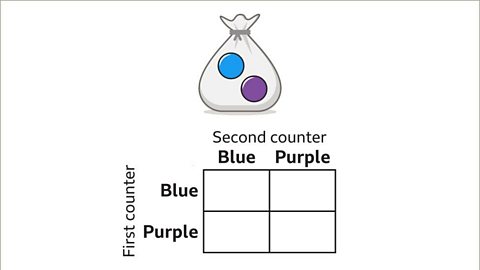
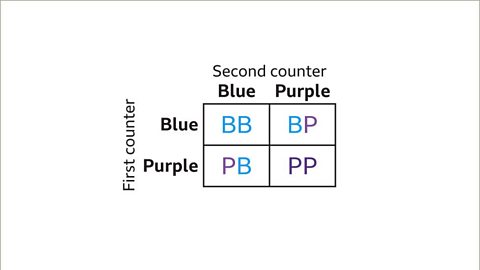
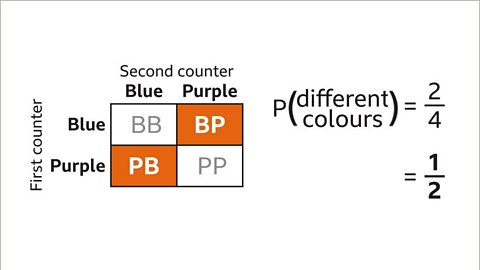
Image caption, Two bags contain counters. The first bag has one blue counter and one purple counter. The second bag has one purple counter and one green counter. One counter is taken from each bag. Find the total number of possible outcomes and list them.
1 of 7
Questions
Question 1:
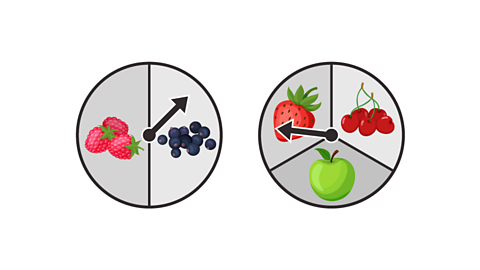
Two spinners are twirled to decide which two types of fruit should go into a lunch box. The first spinner represents raspberries and blueberries. The second spinner represents strawberries, cherries and apples.
Find the probability that both portions of fruit are berries.
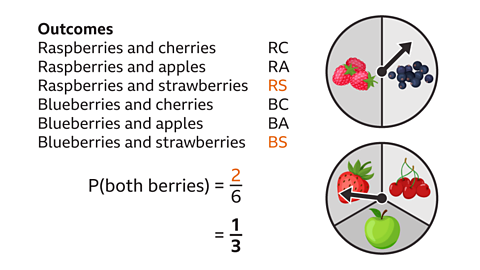
By listing, the outcomes are:
Raspberries and cherries, raspberries and apples, raspberries and strawberries, blueberries and cherries, blueberries and apples, and blueberries and strawberries.
These can also be written as RC, RA, RS, BC, BA and BS. There are six possible outcomes.
P(both portions are berries) = ⅓
The denominator of the fraction is 6 (total number of possible outcomes).
Two of the outcomes are all berries (RS and BS).
The fraction ²⁄₆ simplifies to ⅓
P(both portions are berries) = ⅓
Question 2:
Three spinners are used to select a starter, main and dessert for a three-course meal.
Use the product rule to find the total number of possible three-course meals.
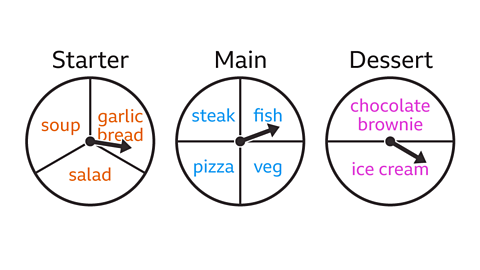
The starter has three choices (three possible outcomes).The main has four choices (four possible outcomes).The dessert has two choices (two possible outcomes).
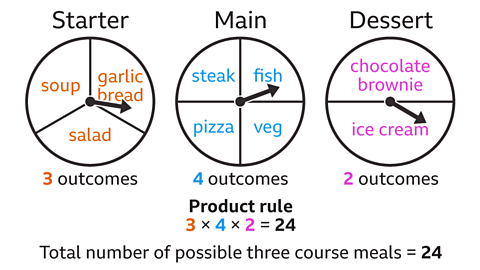
The total number of outcomes for a three-course meal can be found using the product rule. Multiply the number of outcomes for each event (starter, main and dessert).
3 × 4 × 2 = 24
There are 24 possible three course meals.
Using sample space diagrams to find the probability of combined events
A The sample space is the set of all possible outcomes. For a single event this can be a list of outcomes, written in set notation S = {…….}. For combined events this is usually presented in a table. The sum of all the probabilities for all the events in a sample space is 1. diagram is a grid used to show all the A potential result. When a coin is tossed there are two possible outcomes, ‘head’ or ‘tail’. When a normal die is rolled there are six possible outcomes, 1, 2, 3, 4, 5 and 6. of two Link together two or more outcomes. In selecting people at random for a survey a combined event could be choosing a person over 25 who wears glasses, this combines choosing a person over 25 and choosing a person who wears glasses.. The dimensions of the grid can be multiplied to give the total number of outcomes (this is the product rule).
To draw a sample space diagram:
- Draw a grid, with dimensions showing the number of outcomes for one A possible outcome, for example ‘heads’ when a coin is tossed., by the number of outcomes for the second event. The orientation of the grid makes no difference to the number of outcomes.
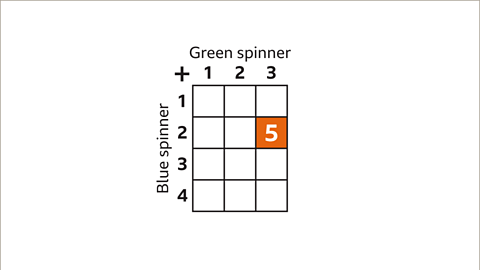
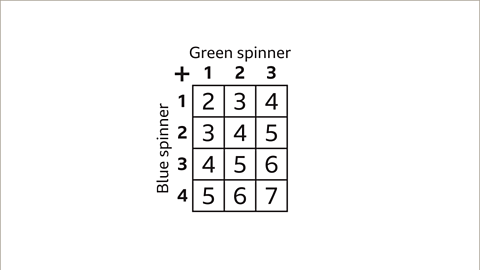
- Label each side of the grid with the outcomes of each event. The cells of the grid are filled with the combined outcome. This may be the result of a calculation or written to represent a combination of events.
Use the sample space diagram to work out the probability of the combined event as a fraction.
- The denominator is the total number of possible outcomes.
- The numerator is the number of times the particular outcome occurs.
- It may be possible to simplify the fraction.
Examples
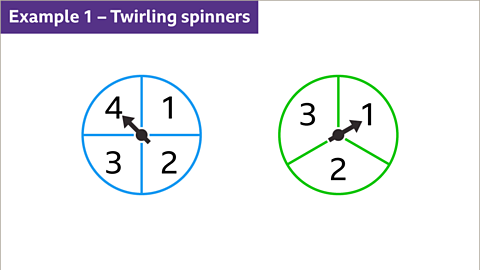
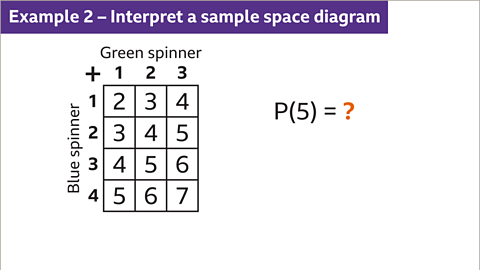
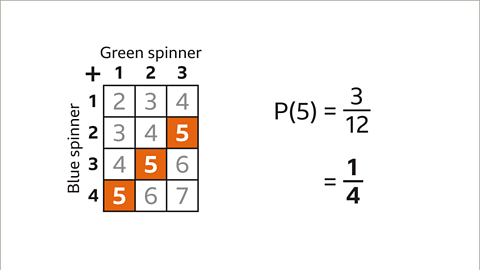
Image caption, A fair blue spinner is labelled 1, 2, 3 and 4. A fair green spinner is labelled 1, 2 and 3. Each spinner is twirled, and the numbers added together. Use a sample space diagram to find all the outcomes.
1 of 10
Question
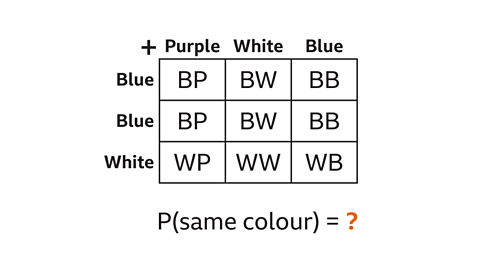
Two bags contain counters. The first bag contains two blue and one white counter. The second bag contains one blue, one purple and one white counter.
The sample space diagram shows all the possible outcomes of taking one counter from each bag.
Use the sample space diagram to find the probability of taking two counters of the same colour.
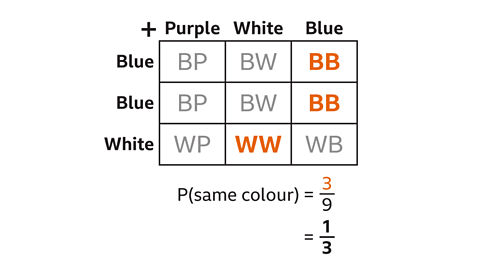
There are nine possible outcomes.
The denominator of the fraction is 9
There are three outcomes where the colours are the same, BB, BB and WW.
The numerator of the fraction is 3
The probability that the two colours are the same is ³⁄₉.
The fraction can be simplified.
P(same colour) = ⅓
Probability activity
Play this game to explore probabilities. You're given a choice of four dice that don't all have standard faces. The numbers that appear on the dice are given in the table.
Try to find the combination of dice that gives you the highest probability of rolling a total of 7.
Practise working out probability of combined events
Practise working out probability of combined events with this quiz. You may need a pen and paper to help you with your answers.
Quiz
Real-life maths
A An illness that is inherited through DNA from parents via their genes. is an inherited medical condition. It can be passed from parents to their children. Examples include cystic fibrosis, sickle cell disease and haemophilia.
Doctors can carry out tests to identify whether a baby has an inherited condition if a parent is affected by it or knows they are a Someone who has a copy of a mutation (change) in their genes but does not have the disorder..
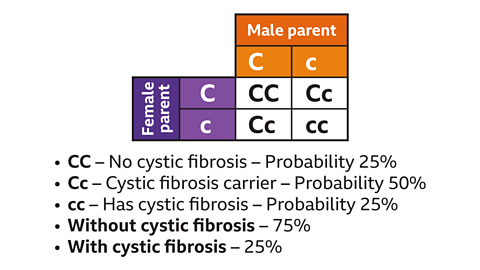
These conditions are passed on to children through the A small section of DNA that gives a characteristic. that make up the The store of genetic information for all living things, passed from parents to offspring. of their parents. For example, cystic fibrosis can be inherited if both parents carry the A recessive gene is only observed in the phenotype (set of observable characteristics) if no dominant gene is present. gene, even though they do not suffer from cystic fibrosis themselves. A scientist with special training in the study of DNA, genes and inherited genetic characteristics. use Punnett squares to work out the probability of something being inherited. They are like a sample space diagram used for working out probabilities of combined events.
In the Punnett square above, C represents the gene without cystic fibrosis and c is the gene for cystic fibrosis. These are the potential outcomes for two parents that are carriers of the cystic fibrosis genes and their probability of having a child with cystic fibrosis.
Play Sudoku with BBC Bitesize!
Every weekday we release brand new easy, medium and hard Sudoku puzzles. Perfect for testing your skill with numbers and logic.

More on Calculating probabilities
Find out more by working through a topic
- count2 of 5
- count3 of 5