Key points
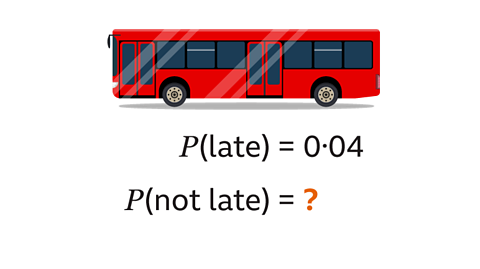
Probability calculated, based on experimental/real data. The number of times the event happens divided by the total number of trials. (experimental probability) is an estimate of The chance of an event happening. The probability of an event has a value from 0 to 1 and is written as a fraction, a decimal or as a percentage. The notation for the probability of an event is P(event). worked outfrom collected data. The expected probability based on known facts. The probability of flipping a tail with a fair coin is ½. In practice an experiment may not give this exact value although the relative frequency (experimental probability) will get closer to the expected probability as the number of trials increases. is based on known facts.
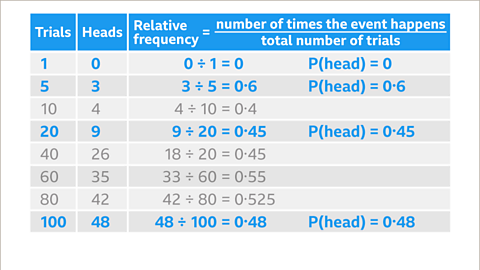
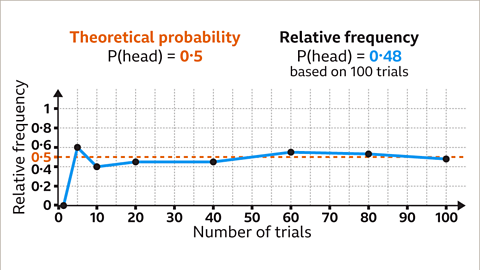
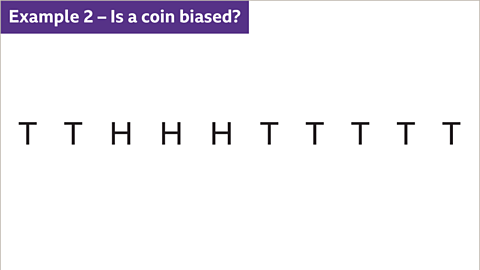
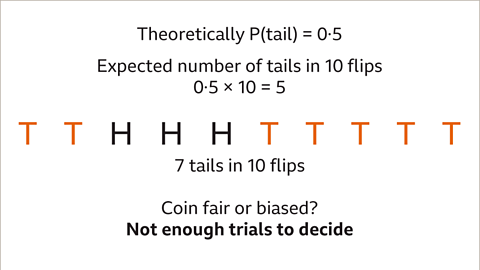
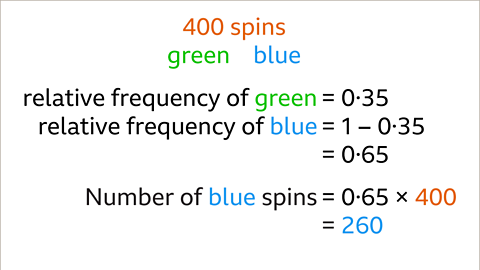
The relative frequency is compared to the theoretical probability to decide whether a coin or a die is Unbiased. The probability of each outcome is equal. The probability of rolling each number on a fair die is the same, each number has the same chance of occurring. The die is unbiased. or Not fair. The greater the number of trials, the more reliable the data for the relative frequency.
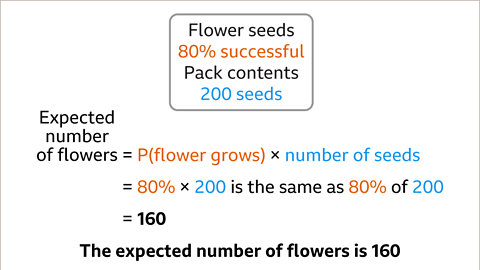
The The probability of an event multiplied by the number of trials gives the expected number of outcomes for that event for a given number of trials. is calculated by multiplying the probability of an event by the number of trials.
Understanding experimental probability
Experimental probability is the relative frequency of an A possible outcome, for example ‘heads’ when a coin is tossed. and is based on collected data. Theoretical probability is based on factual data.
The greater the number of trials, the more reliable the relative frequency.
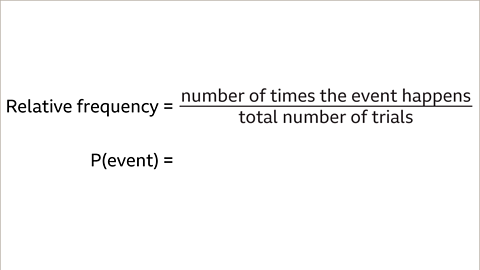
The relative frequency is calculated by dividing the number of times an event happens by the total number of trials. This can have a value from 0 to 1 and may be written as a fraction or a percentage, although it is most often expressed as a decimal.
The An agreed way of writing mathematical ideas. Eg, coordinates are written as (𝒙, 𝒚). for relative frequency is the same as for theoretical probability, P(event).
Examples
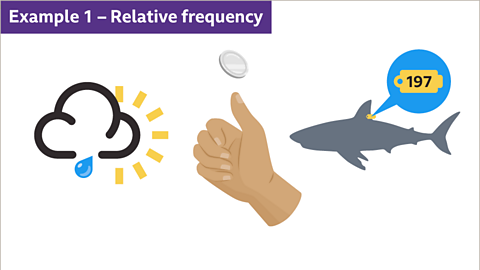
Image caption, Relative frequency is based on collected data. This could be to do with collecting data about the weather, flipping a coin or for scientific purposes, like tagging sharks to find out where they travel to in the ocean.
1 of 10
Questions
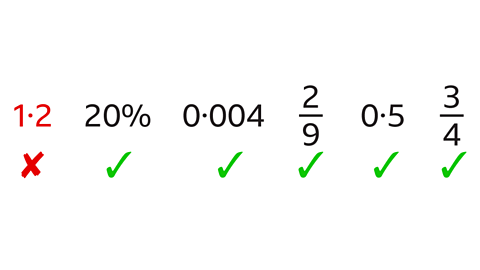
Question 1: Which of these values cannot represent a relative frequency?
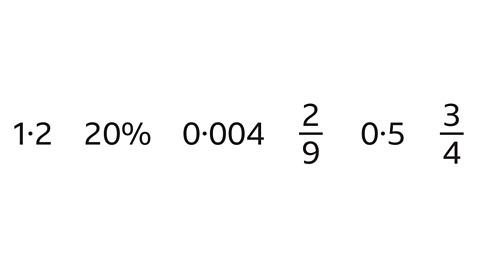
1۰2 cannot represent a relative frequency.
Relative frequency can have any value from 0 to 1 and may be expressed as a fraction, decimal or percentage.
The only value that cannot represent a relative frequency is 1۰2 because it is greater than 1
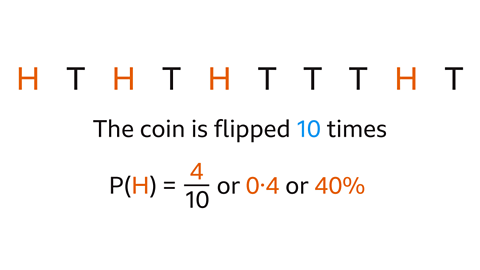
Question 2: The results of flipping a coin 10 times are shown. What is the relative frequency for the coin landing on heads?
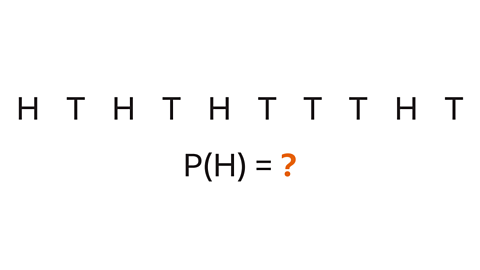
The coin lands on heads 4 times. The total number of trials is 10
The relative frequency is the number of heads divided by the total number of trials.
4 ÷ 10 = 0۰4
P(H) = 0۰4
This may be written as a fraction, decimal or percentage, \( \frac{4}{10} \) or 0∙4 or 40%
Calculating and using the expected number of outcomes
To find the number of expected outcomes:
- Multiply the probability of an A possible outcome, for example ‘heads’ when a coin is tossed. by the number of trials.
To decide whether a coin or a die is Unbiased. The probability of each outcome is equal. The probability of rolling each number on a fair die is the same, each number has the same chance of occurring. The die is unbiased. :
- Multiply the The expected probability based on known facts. The probability of flipping a tail with a fair coin is ½. In practice an experiment may not give this exact value although the relative frequency (experimental probability) will get closer to the expected probability as the number of trials increases. by the number of trials to find the expected number of outcomes.
- Compare the expected number of outcomes to the actual number of outcomes.
- A big difference would suggest some Not fair. The reliability of the comparison is best when there have been many trials.
- To predict an expected number of outcomes for a future event:
- Multiply the Probability calculated, based on experimental/real data. The number of times the event happens divided by the total number of trials. of the event by the number of trials.
Examples
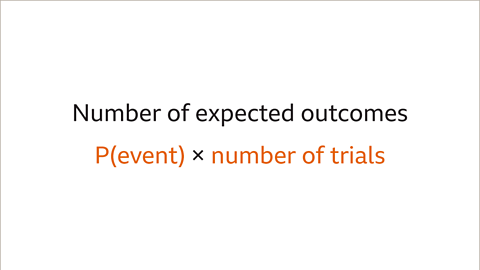
Image caption, The expected number of outcomes of a particular event is calculated by multiplying the probability of that event by the number of trials.

1 of 10
Question
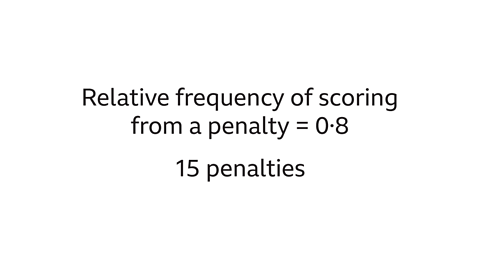
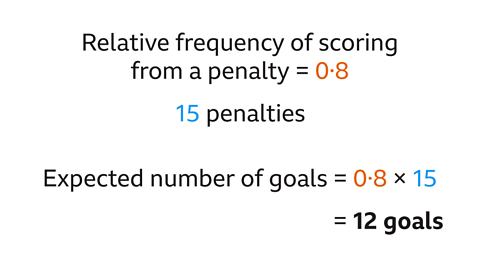
The relative frequency of a hockey player scoring from a penalty is 0۰8
How many goals are expected from 15 penalties?
The expected number of goals is the relative frequency of scoring a goal from a penalty multiplied by the number of penalties taken.
0۰8 × 15 = 12
The player is expected to score 12 goals.
Practise working out experimental probability and relative frequency
Practise working out experimental probability and relative frequency with this quiz. You may need a pen and paper to help you with your answers.
Quiz
Real-life maths

A A scientist who studies animals, plants and microscopic life in the world’s oceans. studying the fish in a lake may use relative frequency in a process called capture-recapture which helps them to estimate the total number (𝑵) of fish in the lake.
This method works by assuming that each fish has an equal chance of being captured. For example, a sample of 80 fish could be taken, which are all then tagged. Later a second sample of 30 fish is taken and the number of them that are tagged is recorded. In this case, two of the fish are tagged.
The relative frequency of picking a tagged fish is \( \frac{2}{30} \), which is the same as the original \( \frac{80}{𝑵} \).
To find the population of fish in the lake the formula 𝑵 = \( \frac{(80×30)}{2} \) is used. The number of fish in the lake is estimated to be 1200
This technique is used to estimate animal populations as well as in studies of human populations. It can help to produce more accurate information relating to rates of disease and other health conditions.
Play Sudoku with BBC Bitesize!
Every weekday we release brand new easy, medium and hard Sudoku puzzles. Perfect for testing your skill with numbers and logic.

More on Calculating probabilities
Find out more by working through a topic
- count2 of 5
- count3 of 5
- count4 of 5