Key points
- The chance of an event happening. The probability of an event has a value from 0 to 1 and is written as a fraction, a decimal or as a percentage. The notation for the probability of an event is P(event). is the chance of an event happening. It is expressed as a value on a scale from 0 to 1. It can be written as a fraction, a decimal or a percentage.
- Where an A possible outcome, for example ‘heads’ when a coin is tossed. is impossible, its probability is 0 and where it is certain its probability is 1. This can be presented visually on a This is a scale between 0 (zero) and 1. 0 means the event is impossible. 1 means the event is certain. .
- A probability scale allows the probability of events to be placed in order of The chance that a particular outcome will occur.. The probabilities marked on the probability scale may be used to make statements comparing different outcomes.
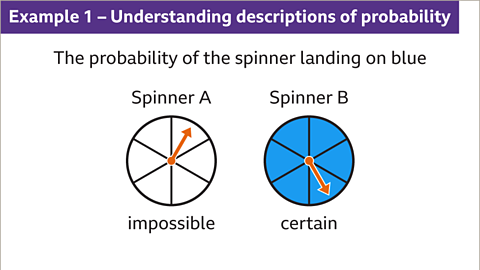
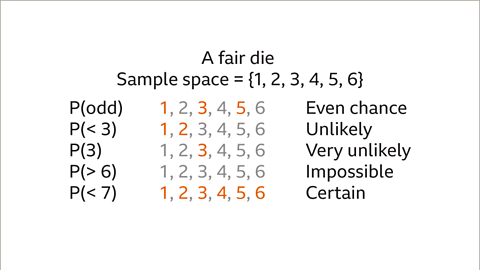
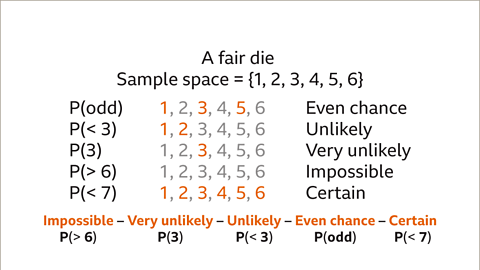
- The vocabulary used in probability includes impossible, unlikely, even chance, likely and certain. These descriptions can help order the likelihood of a set of events.
Describing probabilities
- The probability (chance) of something happening can be described using particular words:
Certain
Very likely
Likely
Even chance
Unlikely
Very unlikely
Impossible
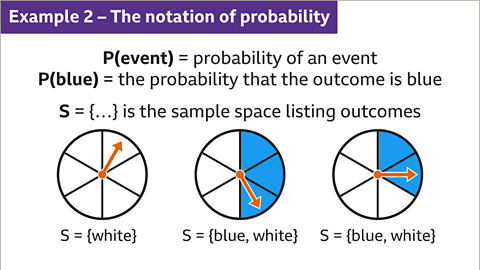
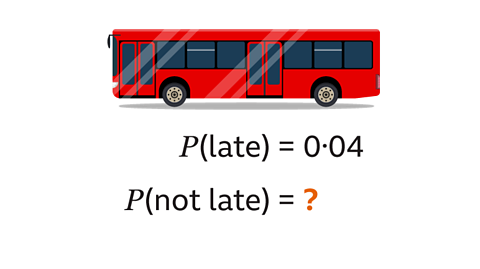
The An agreed form of presentation for mathematical information. for writing the probability of an event is P(event).
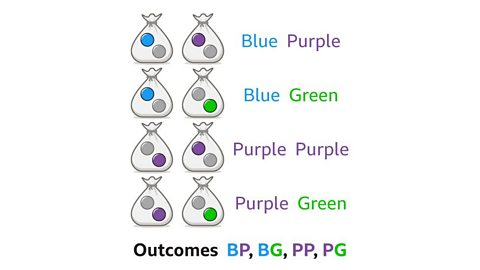
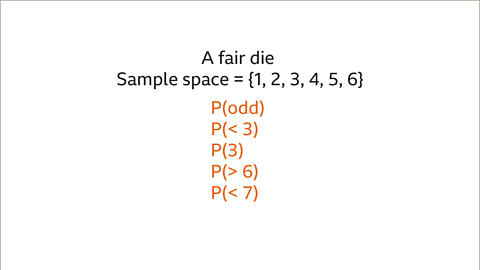
The The sample space is the set of all possible outcomes. For a single event this can be a list of outcomes, written in set notation S = {…….}. For combined events this is usually presented in a table. The sum of all the probabilities for all the events in a sample space is 1. is the set of all possible outcomes. This can be written as a list, S = {……}.
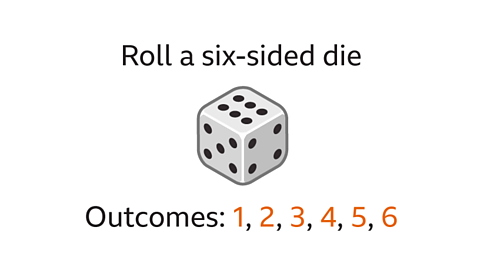
- For example if a fair coin is tossed the possible A potential result. When a coin is tossed there are two possible outcomes ‘head’ or ‘tail’. When a normal die is rolled there are six possible outcomes, 1, 2, 3, 4, 5 and 6. are {H, T} for heads or tails. The probability of getting a head is written as P(H).
The greater the proportion of times an event can happen the greater (or more likely) the probability. Events can be ordered by the probability of them happening (how likely each event is).
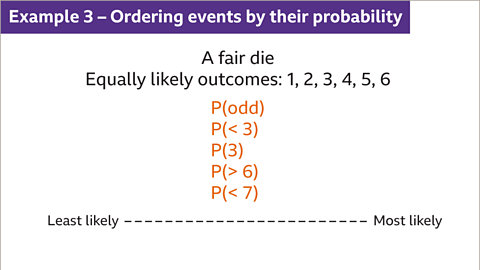
Examples
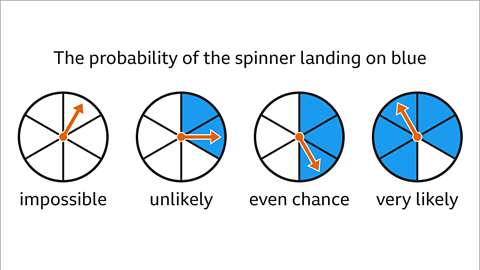
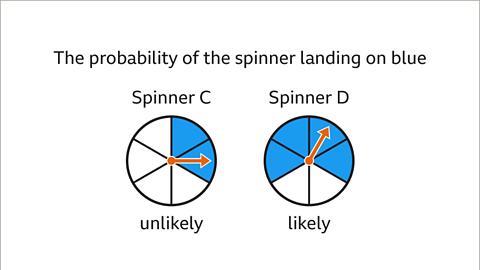
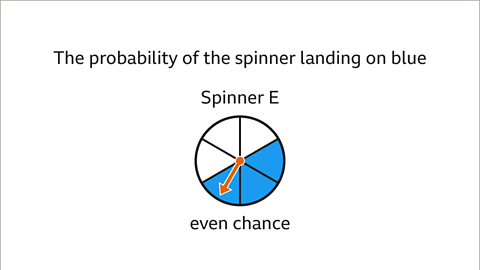
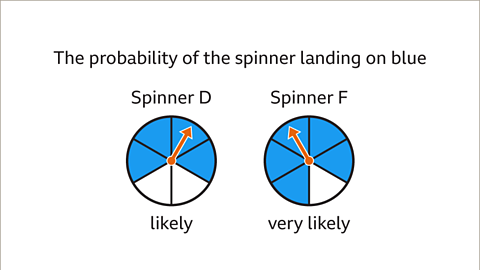
Image caption, The probability of the spinner landing on blue can be described in words.
1 of 10
Practise sample spaces and outcomes
Practise describing different probabilities with this quick quiz.
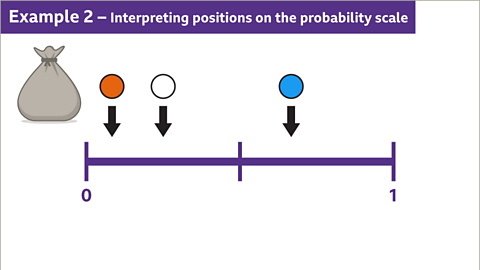
Understanding the probability scale
The probability scale can be labelled in fractions, decimals or percentages.
The scale goes from 0 to 1 (0% to 100%):
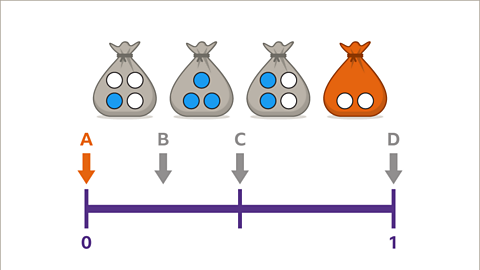
- An impossibleA possible outcome, for example ‘heads’ when a coin is tossed. has a probability of zero (0%)
- A certain event has a probability of 1 (100%)
- Other events have probabilities between 0 and 1
The probabilities of events can be compared using their positions on the This is a scale between 0 (zero) and 1. 0 means the event is impossible. 1 means the event is certain. .
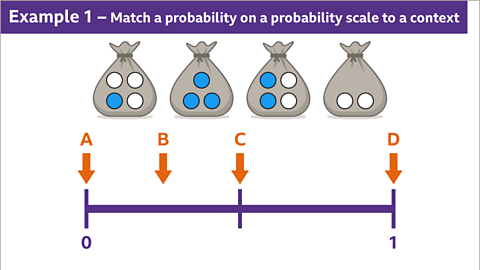
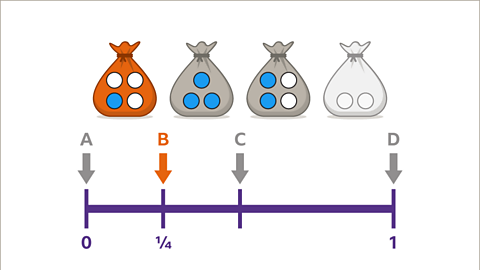
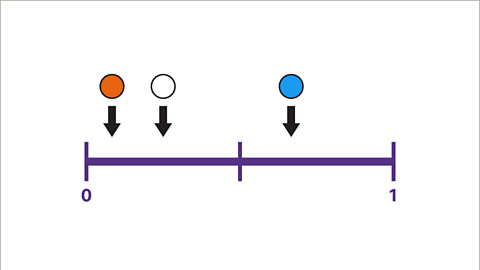
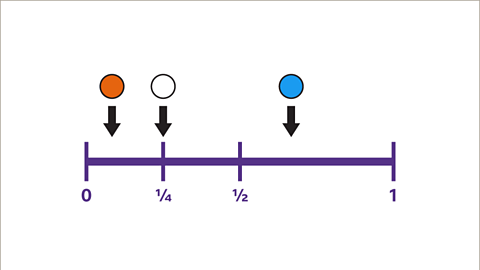
The probability scale can be subdivided into equal intervals to show other probabilities:
- For example, four intervals labelled from 0 to 1 with subdivisions marked ¼ and ½ and ¾. This is the same as 0% and 100% with subdivisions marked 25%, 50%, and 75%.
Examples
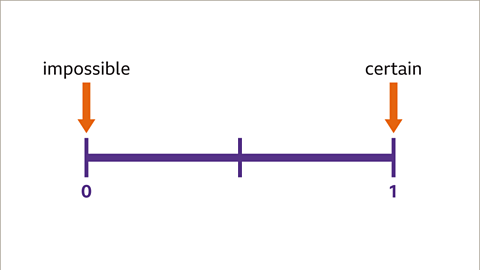
Image caption, The probability scale is labelled from 0 to 1. An impossible event has a probability of 0. A certain event has a probability of 1. Other events have probabilities between 0 and 1

1 of 10
Question
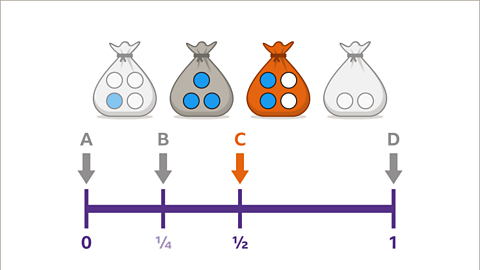
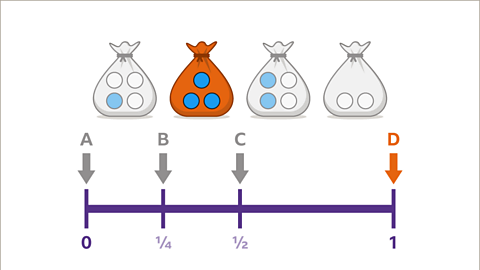
A box of chocolates contains toffees and fudges. The probability scale shows the probability of taking a toffee from the box.
Decide if each statement below is true or false or if there is not enough information to tell.
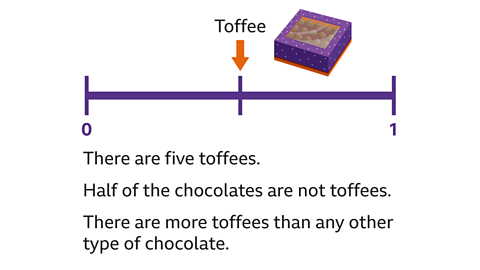
The probability scale shows that there is an even chance (50%, ½) of picking a toffee. Half of the chocolates are toffees. There are only toffees and fudges in the box so if half are toffees, half are fudges.
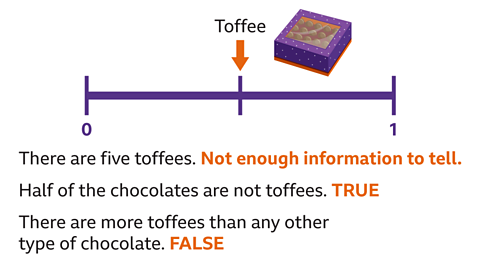
There are five toffees.
There is not enough information to tell. The number of chocolates in the box is not given. There will only be five toffees in the box if there are ten chocolates in total.
Half of the chocolates are not toffees.
True. They are either toffees or fudges. Half are toffees, so half are not toffees.
There are more toffees than any other type of chocolate.
False. There are equal amounts of toffees and fudges so there cannot be more toffees than another type of chocolate.
Practise describing probabilities
Practise describing probability and using the probability scale with this quiz. You may need a pen and paper to help you with your answers.
Quiz
Real-life maths
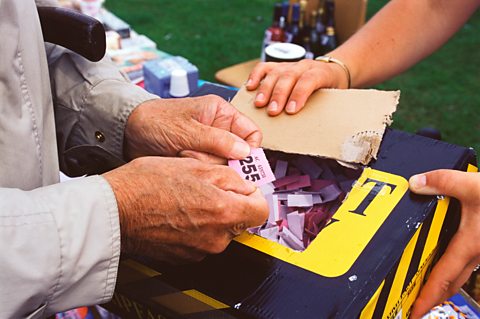
Charities often raise money by having raffles. In a raffle, tickets are selected by lucky-dip. Usually, tickets that end in a zero or a five win a prize, which means one ticket in every five will win a prize.
Charities need to calculate how many tickets they need to sell and how much prizes cost in order to make a profit for the charity. Even though the chance of winning is unlikely, raising money for charity and the bonus of a possible prize makes it worthwhile.
Other raffle ticket prizes may be selected during the event and are not based on the ticket number. The chance of winning one of these prizes is less as there are fewer prizes for more tickets.
Play Sudoku with BBC Bitesize!
Every weekday we release brand new easy, medium and hard Sudoku puzzles. Perfect for testing your skill with numbers and logic.

More on Calculating probabilities
Find out more by working through a topic
- count2 of 5
- count3 of 5
- count4 of 5