Key points
Venn diagrams are often used to find the probability of events. They are used to sort data into sets, which may be presented showing all the individual A piece of information, a letter or a number, in a set. Also described as a member of the set. or showing the number of elements in each An identified area on a diagram or graph.. The notation for ‘the number of elements in set \(A\)' is \(n(A)\).
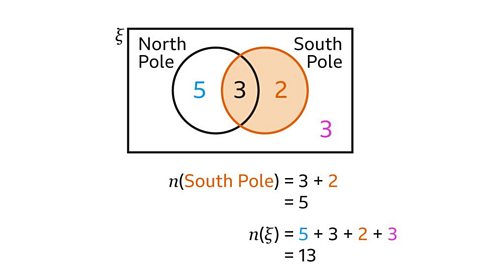
To calculate the probability of an event the number of elements in the relevant region and the total number of elements in the The set of all the elements being considered. The Greek letter ξ (Xi) is used., \(n(ξ)\), must be known.
The probability of an event not happening uses the complement of the region on the Venn diagram.
Calculating probabilities from a Venn diagram
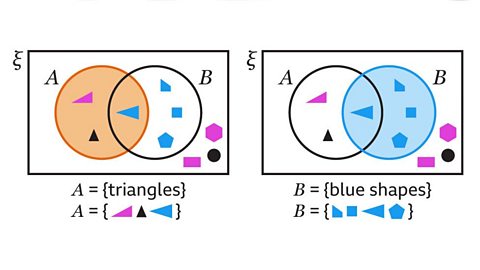
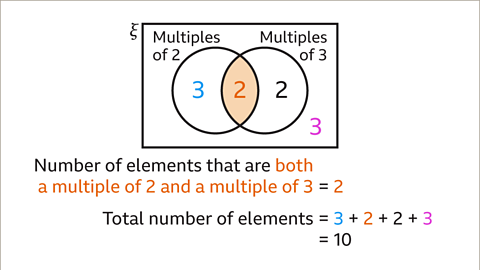
For a A simple visual diagram with overlapping circles, used to show the relationships between two different groups or sets. that shows all the elements in the Venn diagram:
- Count the number of elements in each region.
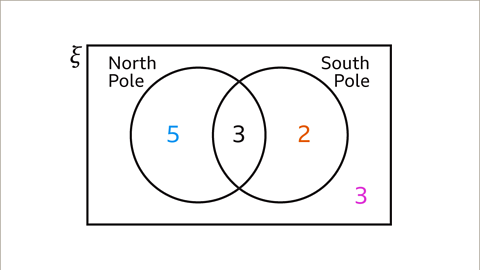
- Redraw the Venn diagram, writing the number of elements instead of individual elements.
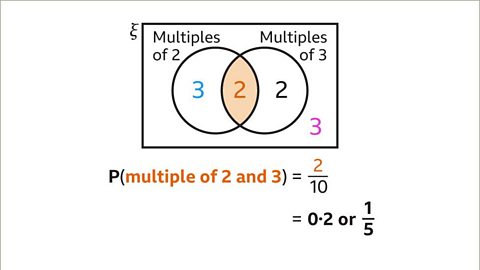
To calculate the The chance of an event happening. The probability of an event has a value from 0 to 1 and is written as a fraction, a decimal or as a percentage. The notation for the probability of an event is P(event). of an event:
- Find the number of elements in the region that represents the event, this is \(n\)(event).
- Find the total number of elements, this is \(n(ξ)\).
- Divide the number of elements of the event by the total number of elements.
Examples
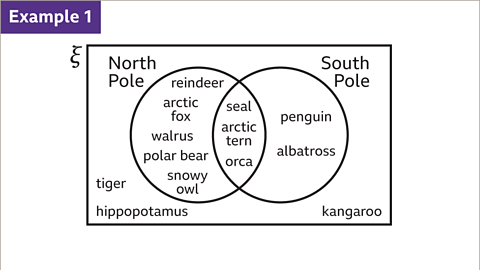
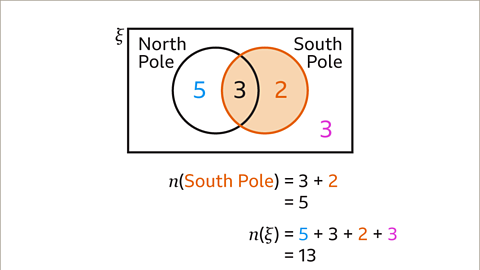
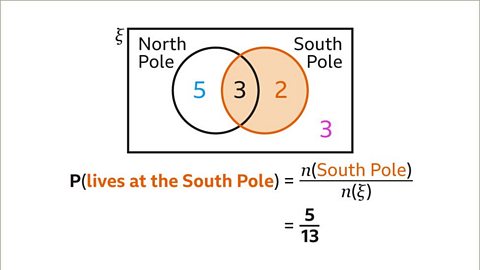
Image caption, A group of animals are sorted into where they may naturally be found. Work out the probability that one of the animals, chosen at random, lives in the Antarctic (South Pole).

1 of 9
Question
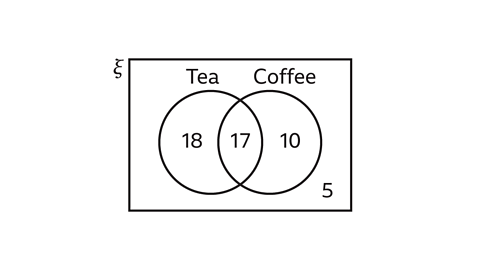
The Venn diagram shows the result of some people saying whether they like tea and coffee.
Find the probability that a person chosen at random likes either tea or coffee but not both.
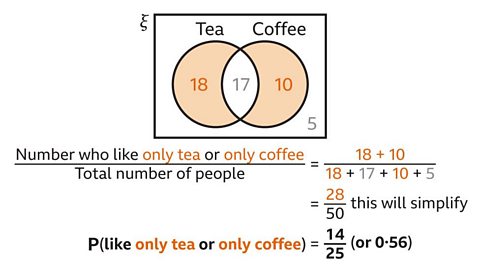
P(like only tea or only coffee) is the number of people who like only tea plus the number of people who like only coffee, divided by the total number of people asked.
18 people like only tea. 10 people like only coffee.
18 + 10 = 28
The total number of people is 50
28 ÷ 50 = ²⁸⁄₅₀ or ¹⁴⁄₂₅ or 0۰56
P(like only tea or only coffee) = ¹⁴⁄₂₅ or 0۰56
Calculating probabilities from Venn diagrams and using set notation
Probabilities using set An agreed form of presentation for mathematical information.:
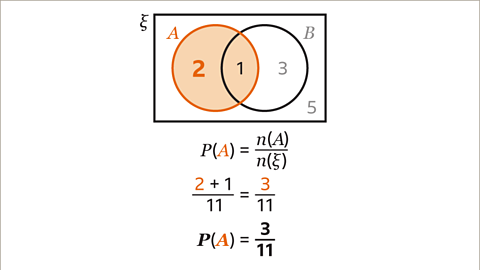
- P(\(A\)) is the probability of the event represented by set \(A\).
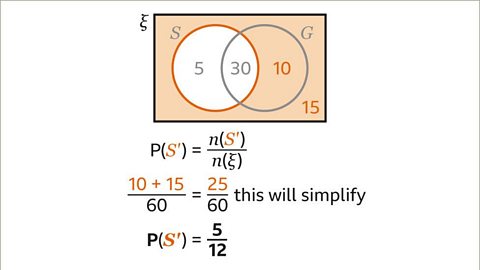
- P(\(A'\)) = P(not \(A\)). \(A’\) is the On a Venn diagram, the region that is not in the set. 𝑷’ is the complement of set 𝑷 and is the region outside the circle for set 𝑷. 𝑷’ = {elements that are not in 𝑷}. of A collection of information or letters or numbers. The members of the set can be listed inside curly brackets,{ }. A set may be described in words inside curly brackets { }. On a Venn diagram a set is shown as a circle. \(A\).
- P(\(A\)∩\(B\)) = P(\(A\) and \(B\)). \(A\)∩\(B\) is the intersection of set \(A\) and set \(B\).
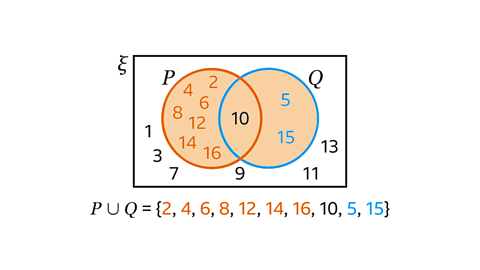
- P(\(A\)ᴜ\(B\)) = P(\(A\) or \(B\) or both). \(A\)ᴜ\(B\) is the union of set \(A\) and set \(B\).
To calculate the probability of an event:
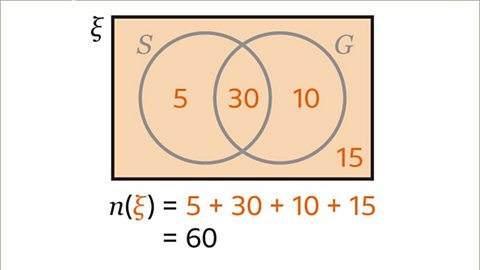
- Find the number of elements in the Venn diagram, this is \(n\)(\(ξ\)).
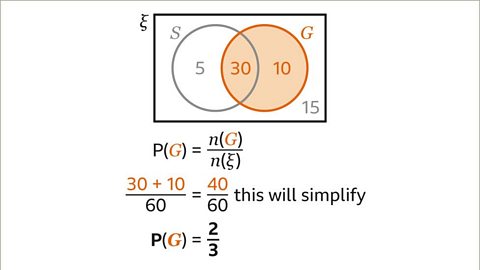
- P(\(A\)) = \(n\)(\(A\)) ÷ \(n\)(\(ξ\))
- The answer may be written as a fraction, decimal or percentage.
Examples
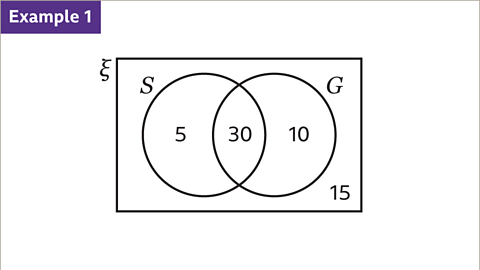
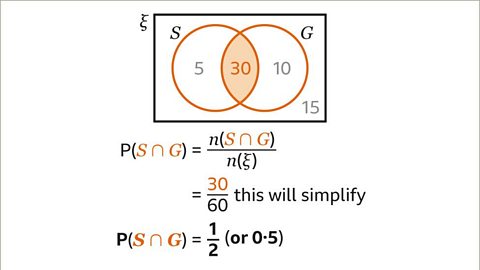
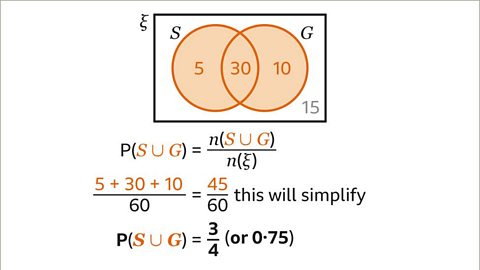
Image caption, The Venn diagram shows two holiday destinations that people have travelled to, 𝑺 = {Spain} and 𝑮 = {Greece}. Find the following probabilities. P(𝑮), P(𝑺’), P(𝑺∩𝑮) and P(𝑺ᴜ𝑮).
1 of 9
Question
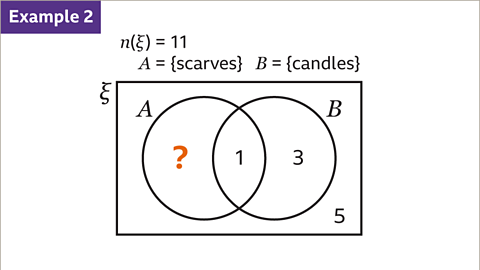
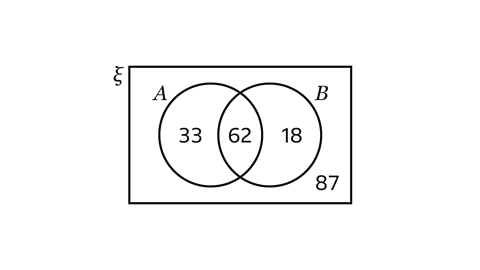
The Venn diagram shows items people donate to charity.
\(A\) = {clothing} and \(B\) = {books}.
Find P(\(B’\)).
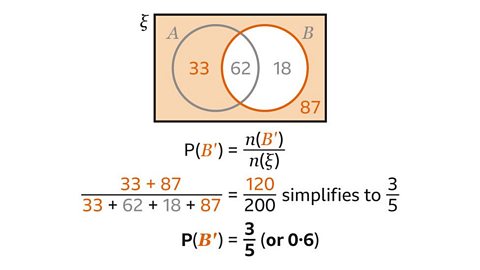
P(\(B’\)) is the probability that a person does not donate books. This is the region outside the circle for people who do donate books.
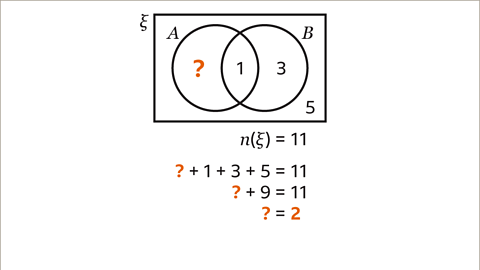
\(n(ξ)\) is found by adding all the values.
33 + 62 + 18 + 87 = 200
\(n(B’)\) is found by adding the values outside set \(B\), 33 + 87 = 120
P(\(B’\)) = ¹²⁰⁄₂₀₀ which simplifies to ⅗. This is the same as 0۰6
Practise working out finding probabilities from Venn diagrams
Practise working out finding probabilities from Venn diagrams with this quiz. You may need a pen and paper to help you with your answers.
Quiz
Play Sudoku with BBC Bitesize!
Every weekday we release brand new easy, medium and hard Sudoku puzzles. Perfect for testing your skill with numbers and logic.

More on Sets and Venn diagrams
Find out more by working through a topic
- count1 of 5
- count2 of 5
- count3 of 5
- count4 of 5