Key points

- A diagram used to sort data. are a visual way of representing A collection of information or letters or numbers. The members of the set can be listed inside curly brackets, { }. A set may be described in words inside curly brackets { }. On a Venn diagram a set is shown as a circle.. They consist of one or more circles inside a rectangle. The circles usually overlap.
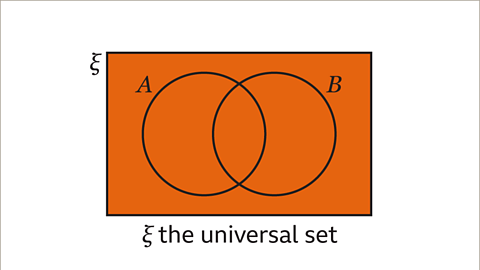
- All the data being considered is contained inside the rectangle. This is called the The set of all the elements being considered. The Greek letter ξ (Xi) is used to represent the universal set. and is represented by the Greek letter ξ (Xi). Each circle represents a set.
- Set An agreed form of presentation for mathematical information. is used to describe different regions of a Venn diagram.
Understanding and interpreting a Venn diagram
Set notation is used to describe different An identified area on a diagram or graph. on a Venn diagram:
- ξ represents the universal set.
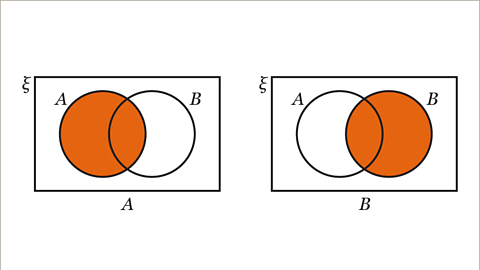
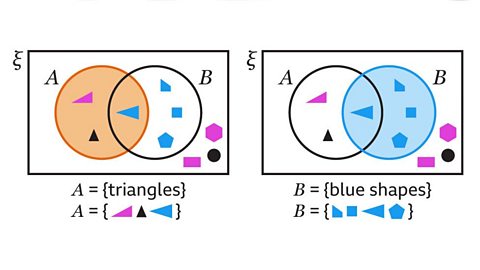
- A represents set A and B represents set B, usually a capital letter is used.
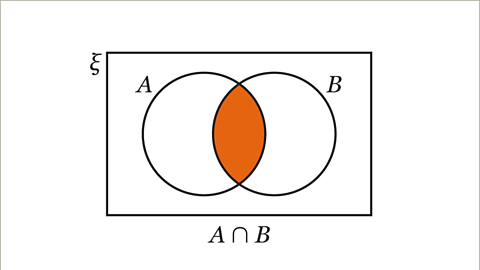
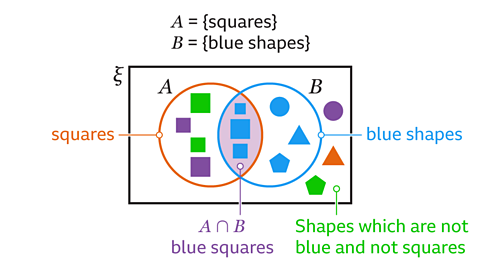
- A∩B represents the On a Venn diagram, the region where sets overlap. 𝑷∩𝑸 is the intersection of set 𝑷 and set 𝑸. 𝑷∩𝑸 = {elements in 𝑷 that are also in 𝑸}. of set A and set B.
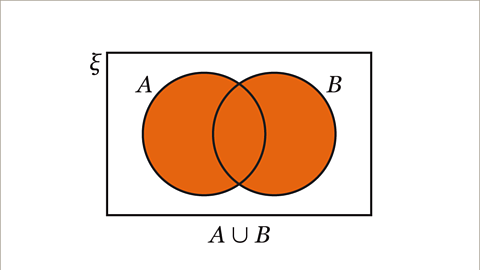
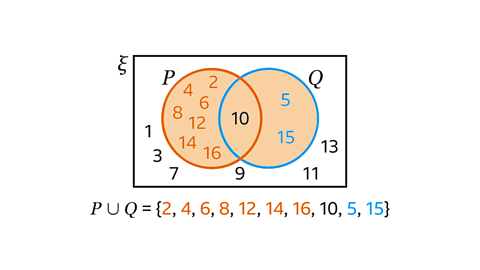
- A∪B represents the On a Venn diagram, the region of two or more sets when they are combined. 𝑷∪𝑸 is the union of set 𝑷 and set 𝑸. 𝑷∪𝑸 = {elements just in 𝑷, in both 𝑷 and 𝑸, just in 𝑸}. of set A and set B.
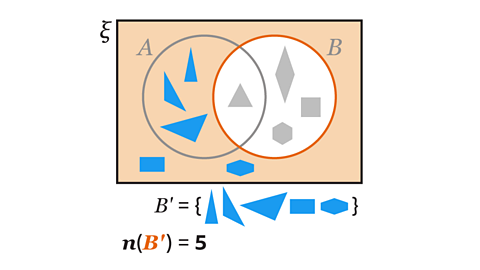
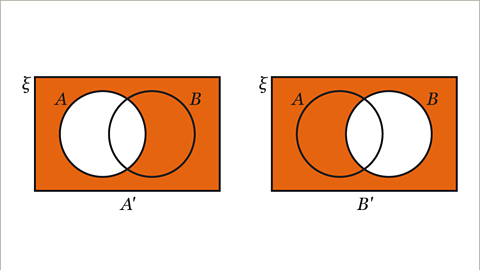
- A’ represents the On a Venn diagram, the region that is not in the set. P’ is the complement of set P and is the region outside the circle for set P. P’ = {elements that are not in P}. of set A.
The elements for each region of a Venn diagram can be written with the set notation equal to the list of A piece of information or a letter, or a number, in a set. Also described as a member of the set. inside curly brackets { }.
When sets intersect (overlap), the elements in the intersection are members of both sets. When the sets have no elements in common, the overlap is empty or the circles do not overlap.
Examples
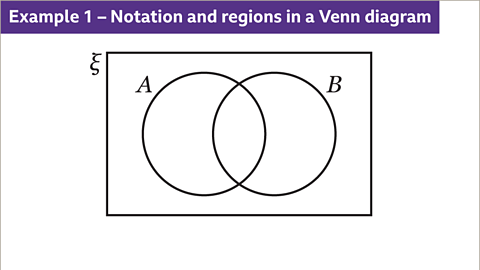
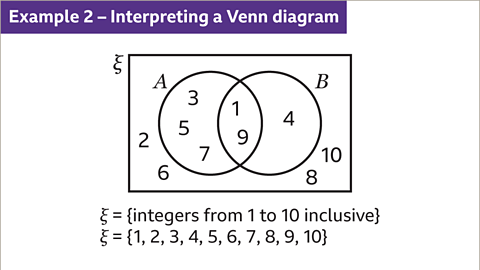
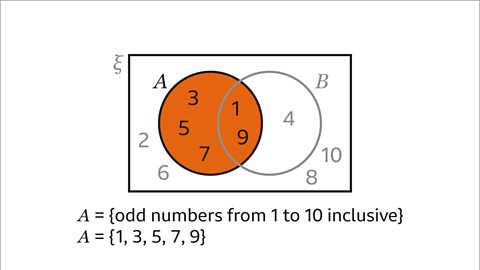
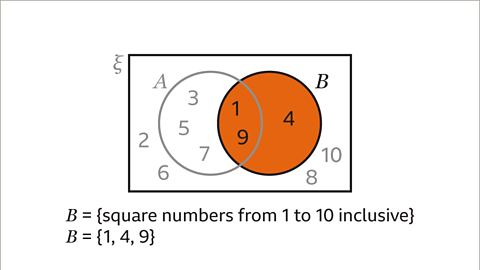
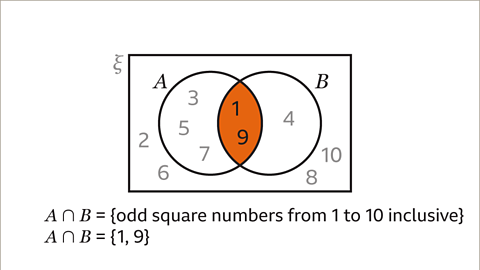
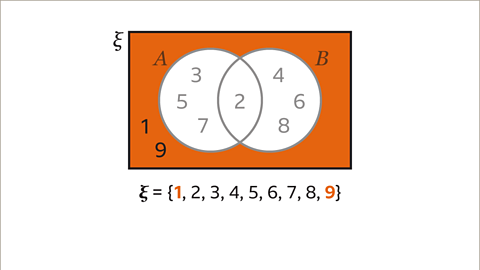
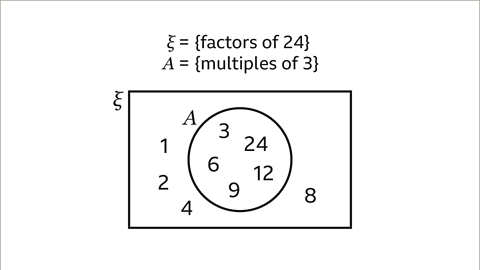
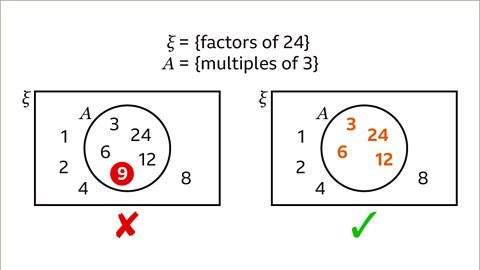
Image caption, Describe each region of the Venn diagram using set notation.
1 of 10
Question
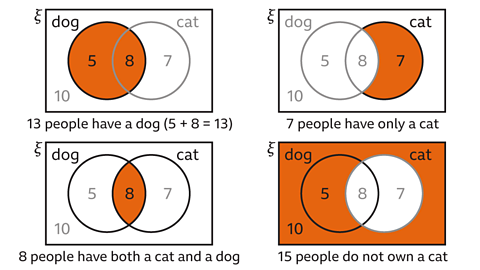
30 people answered a survey about whether they have a dog or a cat. The Venn diagram shows the information from the survey.
Answer the following questions:
- How many people have got a dog?
- How many people have only got a cat?
- How many people have a cat and a dog?
- How many people do not own a cat?
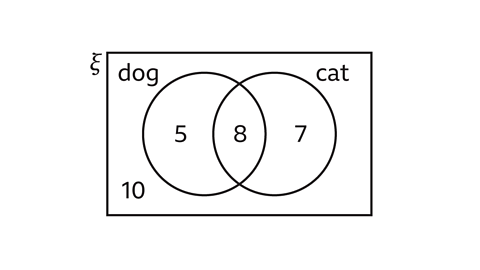
13 people have got a dog. The circle for the set of people with a dog has 5 people who just have a dog and 8 people who have both a cat and a dog, this gives a total of 13 people with a dog.
7 people have only got a cat. This is the number of people in the set of people with a cat who do not have a dog.
8 people have a cat and a dog. This is the number of people in the intersection of the set of people with a dog and the set of people with a cat.
15 people do not own a cat. This is the total of the people that are not in the set of people who own a cat (the complement of cat owners).
Drawing Venn diagrams
- To draw A diagram used to sort data. with two overlapping A collection of information or letters or numbers. The members of the set can be listed inside curly brackets, { }. A set may be described in words inside curly brackets { }. On a Venn diagram a set is shown as a circle. A and B:
- Write each set as a list of A piece of information or a letter, or a number, in a set. Also described as a member of the set..
- Write the elements that are in both sets in the On a Venn diagram, the region where sets overlap. 𝑷∩𝑸 is the intersection of set 𝑷 and set 𝑸. 𝑷∩𝑸 = {elements in 𝑷 that are also in 𝑸}., A∩B.
- Write the rest of the elements that are just in set A.
- Write the rest of the elements that are just in set B.
- Write any remaining elements from the The set of all the elements being considered. The Greek letter ξ (Xi) is used to represent the universal set. in the space inside the rectangle and outside the circles.
- To avoid errors:
- Make sure that the number of elements in the Venn diagram is equal to the number of elements in the universal set.
- Check that a set does not include an element that is not in the universal set.
Examples
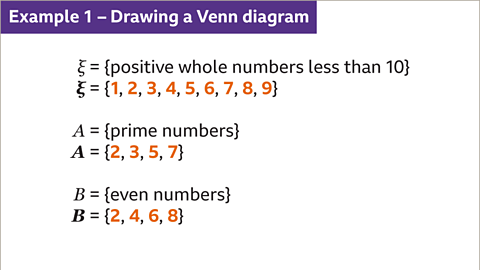
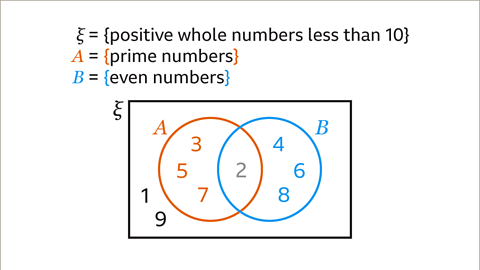
Image caption, Draw a Venn diagram for ξ = {positive whole numbers less than 10}, A = {prime numbers} and B = {even numbers}. Write each set as a list of elements. ξ = {1, 2, 3, 4, 5, 6, 7, 8, 9}, A = {2, 3, 5, 7} and B = {2, 4, 6, 8}.

1 of 10
Question
Draw a Venn diagram to show the following data:
ξ = {whole numbers from 1 to 12 inclusive}
A = {prime numbers}
B = {factors of 12}
Write each set as a list of its elements:
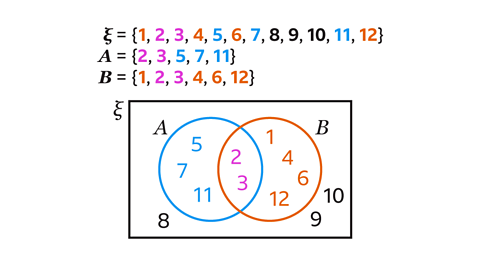
ξ = {1, 2, 3, 4, 5, 6, 7, 8, 9, 10, 11,12}
A = {2, 3, 5, 7, 11}
B = {1, 2, 3, 4, 6, 12}Draw two overlapping circles, one for set A and one for set B, inside a rectangle for the universal set.
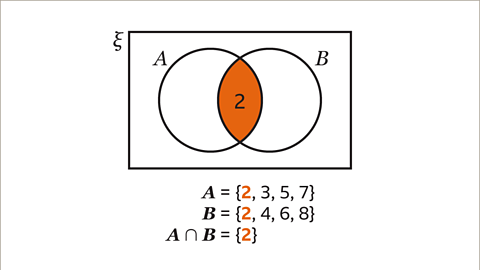
Fill in the overlap of the two circles with the elements that are in both set A and set B. This region is the intersection of set A and set B and contains the numbers 2 and 3. A∩B = {2, 3}.
Complete set A using the numbers 5, 7 and 11. These numbers are in set A but not in set B.
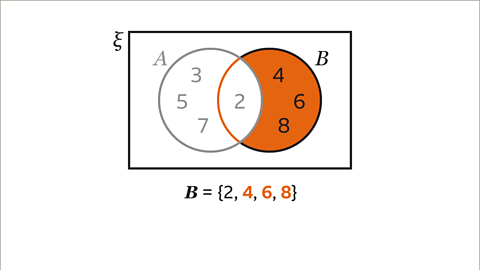
Complete set B using the numbers 1, 4, 6 and 12. These numbers are in set B but not in set A.
Complete the Venn diagram by writing the remaining numbers 8, 9, and 10 in the region that is outside the circles and inside the rectangle. These are the numbers that are not in set A or set B but are in the universal set.
The Venn diagram is now complete.
Practise understanding and interpreting Venn diagrams
Practise understanding and interpreting Venn diagrams with this quiz. You may need a pen and paper to help you with your answers.
Quiz
Real-life maths
A chocolate snack manufacturer may research the features that consumers favour when creating a new product, such as:
- a biscuit base
- inclusion of nougat, fruit or caramel
- the snack size
- whether it is low calorie or contains artificial colours
The manufacturer will look for the combination of features that will give a product the highest chance of success when competing with other similar products.
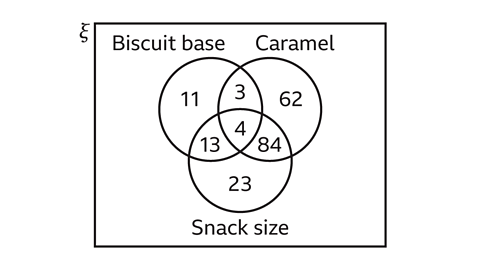
In this Venn diagram of market research, the responses collected suggest that inclusion of caramel and the size of the snack are the most favoured features of the new product. As a result, the manufacturer can focus on developing this for their target consumers.
Play Sudoku with BBC Bitesize!
Every weekday we release brand new easy, medium and hard Sudoku puzzles. Perfect for testing your skill with numbers and logic.

More on Sets and Venn diagrams
Find out more by working through a topic
- count2 of 5
- count3 of 5
- count4 of 5
- count5 of 5