
Wet end to September raises autumn flooding concerns
The second half of September look set to be dominated by low pressure, with little chance of a prolonged dry settled spell of weather.
All computer weather models are indicating that temperatures are likely to be below normal, with rain expected at times across the UK - although there will be some dry, bright days especially in the south and east at first.
Heavy rain on wednesday led the River Aire to burst its banks into the flood plain near Skipton, shown in the picture below.
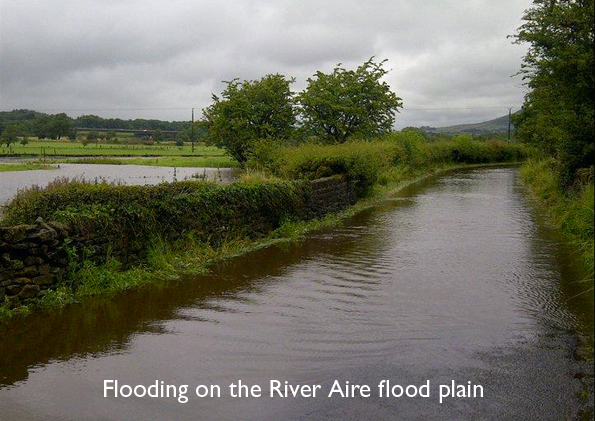
This highlights the fact that the water table remains high, following the wettest April on record, and the wettest summer in 100 years.
Since March, there hasn't been a prolonged spell of dry weather which would naturally allow the land to dry out and the water table to fall, and should the traditionally wet months of October and November materialise, then a renewed risk of flooding is a distinct possibility.
The floods of autumn 2000 were unprecedented in their scale and severity, and such was the volume of rainfall that fell, that it became the wettest autumn in the Central England data set which goes back to 1766.
But the flooding was made far worse because there were no spells of settled, dry weather in any of the previous months.
April 2000 was the wettest on record and June 2000 was also very wet, with the River Ouse rising to its highest ever June level, as parts of the region experienced flooding.
But crucially July and August 2000 - the warmest two months of the year, when evaporation rates are at their highest - whilst not classed as a washout, saw no period of prolonged dry weather over a period of weeks which would have allowed the land to dry out.
So in 2000, far less rainfall in October of that year would have caused some flooding, because the land was already so wet.
We can only hope that whilst the rest of September is likely to see more rainfall, the rest of autumn shows some improvement, or further flooding may become a reality.
Follow me on twitter @Hudsonweather
 Hello, I’m Paul Hudson, weather presenter and climate correspondent for BBC Look North in Yorkshire and Lincolnshire. I've been interested in the weather and climate for as long as I can remember, and worked as a forecaster with the Met Office for more than ten years locally and at the international unit before joining the BBC in October 2007. Here I divide my time between forecasting and reporting on stories about climate change and its implications for people's everyday lives.
Page 1 of 2
Comment number 1.
At 20:26 14th Sep 2012, Spanglerboy wrote:Glad I'm off to Oz then. Last one to leave switch the lights off. Oh forgot, pretty soon there won't be any lights on.
Smoke me a kipper
Complain about this comment (Comment number 1)
Comment number 2.
At 21:22 14th Sep 2012, Boanta wrote:Enjoy the ski-ing, they're having a bumper season with lots of snow.
Complain about this comment (Comment number 2)
Comment number 3.
At 11:07 15th Sep 2012, QuaesoVeritas wrote:A bit off topic now, but the NASA/GISS temperature anomalies for August are as follows:
Global = 0.56c, compared to 0.47c for July.
N.H. = 0.65c, compared to 0.75c for July.
S.H. = 0.48c, compared to 0.19c for July.
After adjustment to 1961-90, the above are equivalent to 0.45c, 0.59c and 0.34c respectively.
These changes are very similar to those in UAH, although the actual anomalies for UAH are higher after adjustment to 1961-90, although that isn't reliable.
The global figure also shows an increase consistent with the August AQUA CH5 temperature, which I think I said would probably indicate a small increase in the anomalies to levels similar to those in June. That would put the Augst HadCRUT3 figure at around 0.48c.
Still no RSS figure for August (it is very unusual for them to be later than NASA/GISS), and I have sent them an e-mail.
Complain about this comment (Comment number 3)
Comment number 4.
At 22:12 15th Sep 2012, newdwr54 wrote:Thanks QV,
I think that puts August 2012 at 6th place overall in warmest Augusts on record globally in the past 133 years, according to NASA?
Congratulations on once again getting it pretty near the mark.
Complain about this comment (Comment number 4)
Comment number 5.
At 22:48 15th Sep 2012, greensand wrote:@3 Yes thanks QV
@ 4. newdwr54 wrote
"I think that puts August 2012 at 6th place overall in warmest Augusts on record globally in the past 133 years, according to NASA?"
And also puts NASA/GISS Loti 30 year (WMO Standard) running average at +0.163 per decade, 9.2% lower than the Dec 2003 high.
Complain about this comment (Comment number 5)
Comment number 6.
At 01:33 16th Sep 2012, lateintheday wrote:newdwr54 - you're going to have to change your preferred 'link to' source. SKS appears to have imploded. Not much else I can say - sad really.
Complain about this comment (Comment number 6)
Comment number 7.
At 02:10 16th Sep 2012, greensand wrote:6. lateintheday wrote:
"newdwr54 - you're going to have to change your preferred 'link to' source. SKS"
Also going to have to give up "the only metric that matters is WMO Standard 30 years equals climate"
Watch for the moves, they will be multi-various and creative. I have learnt over the last two years to respect DW's creativity. It is truly a shame that his ideology has denied him the opportunity to inform the world what is actually happening. Quite amazing!
Complain about this comment (Comment number 7)
Comment number 8.
At 02:48 16th Sep 2012, john_cogger wrote:Imploded? Where?
Complain about this comment (Comment number 8)
Comment number 9.
At 11:51 16th Sep 2012, John Marshall wrote:Your picture of the river Aire flooding onto its flood plain. That is what flood plain is for. The 2000 floods were not unprecedented. Flooding of the Humber in the 12th cent caused several thousand deaths. The East Coast flooding 1950's killed over 300. Flooding is a natural reaction to heavy rain but now used as a signal for alarmist policies by the Greens.
Complain about this comment (Comment number 9)
Comment number 10.
At 16:03 16th Sep 2012, thesnowman wrote:@8 j_c
https://wattsupwiththat.com/2012/09/15/we-need-a-conspiracy-to-save-humanity/
or
https://www.bishop-hill.net/blog/2012/9/7/michael-mann-and-skepticalscience-well-orchestrated.html
Take your pick.
Complain about this comment (Comment number 10)
Comment number 11.
At 16:42 16th Sep 2012, quake wrote:NASA GISS 30 year running mean
https://www.woodfortrees.org/plot/gistemp/mean:360
There's no sign of any let up
Complain about this comment (Comment number 11)
Comment number 12.
At 17:58 16th Sep 2012, greensand wrote:11. quake wrote:
"There's no sign of any let up"
In Dec 2003 the GISS LOTI 30 year running mean rate of warming reached its maximum recorded rate of +0.0181C
"#Least squares trend line; slope = 0.018091 per year"
https://www.woodfortrees.org/data/gistemp/to:2004/last:360/trend
and following the latest monthly data it is now +0.0163C
"#Least squares trend line; slope = 0.0162683 per year"
https://www.woodfortrees.org/data/gistemp/last:360/trend
How can a near 10% reduction in the rate of warming be described as "no sign of any let up"?
Also as we have in excess of 11 years of zero GISS LOTI increase I suspect this trend will continue. There will be minor % ups and downs, but 10% is now becoming significant. Just plain and simple data, not interpreted, just the actual facts of what is happening in the real world.
Complain about this comment (Comment number 12)
Comment number 13.
At 18:34 16th Sep 2012, greensand wrote:Quake why does the chart you linked to end in 1997? How is that relevant to what is happening now? Am I missing something?
"1997.58 0.380611
#Data ends"
https://www.woodfortrees.org/data/gistemp/mean:360
Complain about this comment (Comment number 13)
Comment number 14.
At 18:42 16th Sep 2012, john_cogger wrote:@10 snowman
Ah you mean no one else ever vents anger in terms they wouldn't normally use in public...
Watts has never emailed monckton, et al to organise themselves? Or goes to conferences at Heartland? My indifference is deafening...
Is wuwt still miffed that he didn't get asked to post that survey?
Complain about this comment (Comment number 14)
Comment number 15.
At 19:04 16th Sep 2012, greensand wrote:@14 john_cogger wrote:
"Is wuwt still miffed that he didn't get asked to post that survey?"
Whether WUWT is to your liking or not, it is recognised by all concerned as the sceptic blog with the most traffic.
Now if you wanted to garner the views of sceptics why would you not ask the sceptic blog with the most traffic?
PS I am not discounting the fact that WUWT was asked and "lost" it, unknowingly or intentionally, but I am surprised that the survey team have not yet publically stated that they did contact WUWT. Why leave it out? It is not that they had never heard of it. Maybe they will come forward with a copy of their communication to WUWT?
Complain about this comment (Comment number 15)
Comment number 16.
At 19:11 16th Sep 2012, john_cogger wrote:@15 Greensand
They didn't contact WUWT, they have said who they contacted (and in some cases corresponded with). Though with some of the commentators at WUWT maybe it was seen as shooting fish in a barrel! (New world orders et al). :-)
Complain about this comment (Comment number 16)
Comment number 17.
At 19:15 16th Sep 2012, john_cogger wrote:Though why a survey and paper on psychology is getting so much attention from some blogs is a mystery for me? Has the arctic recovered yet? No other papers for or against to look at?
Complain about this comment (Comment number 17)
Comment number 18.
At 19:18 16th Sep 2012, jkiller56 wrote:Yes, a pity if September is going to continue the wet theme. Its not been too bad here so far - at least compared to much of the year since April. It will be interesting to see whether the year as a whole sets any records for prolonged wetness/dullness etc.
No doubt, whatever happens - it will have been "worse" X centuries ago!
Incidentally John Marshall #9 technically much of the Vale of York, the entire Humber basin, Holderness and the whole Vale of Pickering are "flood Plains" - if you want to go far back enough into history. Its just that unfortunately since then they have been drained and lived on. Perhaps we should wait until half of Yorkshire returns to an inland sea before resorting to "alarmist policies".
It will be interesting to see how many people drown this time compared to the 12th cent - won't it?
Complain about this comment (Comment number 18)
Comment number 19.
At 19:22 16th Sep 2012, greensand wrote:@16 john_cogger wrote
"They didn't contact WUWT"
Did they say why? I have not seen a site selection process but to be fair I have not looked, not really my scene, I try to stay with actual physical observational data.
Just doesn't make sense to ignore what should be a major source of input. But hey ho...
Complain about this comment (Comment number 19)
Comment number 20.
At 19:51 16th Sep 2012, john_cogger wrote:@19 Greensand
Not read their selection process either and it's not my scene either. Though by the way it's being reacted too you'd think that it had made a major breakthrough that has changed all science as we know it!
Complain about this comment (Comment number 20)
Comment number 21.
At 20:08 16th Sep 2012, greensand wrote:@20. john_cogger
Sure seems to have created a stir, but the stir is more about the relationship of SkS with UWA rather than the actual survey. To me it is just "psychobabble" as they all are.
In short order it will be yesterday's news or as my old Dad used to put it tomorrow's bum wipes, only he didn't say bum!
Complain about this comment (Comment number 21)
Comment number 22.
At 20:29 16th Sep 2012, QuaesoVeritas wrote:#13. - greensand wrote:
"Quake why does the chart you linked to end in 1997? How is that relevant to what is happening now? Am I missing something?"
I am guessing it might be that the 30 year average is centred on July 1997, and cannot go past that date, because there is no data after July 2012.
That is strictly speaking the "correct" way of calculating moving averages although I don't think you can do it that way in the automatic trend calculation using Excel.
Personally I find it confusing as it always makes the figures look out of date.
Complain about this comment (Comment number 22)
Comment number 23.
At 20:35 16th Sep 2012, QuaesoVeritas wrote:#17. - john_cogger wrote:
"Though why a survey and paper on psychology is getting so much attention from some blogs is a mystery for me? Has the arctic recovered yet? No other papers for or against to look at?"
I agree.
I haven't really being following the discussion because I can't see the point.
BTW, did they do a survey of whether non-sceptics believed in conspiracy theories?
In my experience such theories are quite popular amongst a certain element in both camps.
Complain about this comment (Comment number 23)
Comment number 24.
At 20:56 16th Sep 2012, greensand wrote:22. QuaesoVeritas wrote:
"I am guessing it might be that the 30 year average is centred on July 1997, and cannot go past that date, because there is no data after July 2012."
Thanks QV, as usual I missed the obvious! Yes, it makes sense and possibly explains why some think "There's no sign of any let up" when in actual fact the present GISS LOTI 30 year warming trend is reducing.
Interesting how data can be interpreted/presented, in an attempt to reduce potential confusion i will stay with the simple latest actual data.
I will now go away and think about what direction that chart will go when the centering point moves past 1998?
Complain about this comment (Comment number 24)
Comment number 25.
At 21:13 16th Sep 2012, QuaesoVeritas wrote:#11. - quake wrote:
"There's no sign of any let up"
A thirty year running mean is not going to show up a recent change in temperatures very well.
All it proves is that current temperatures are higher than 30 years ago, and I don't think anyone is denying that.
The figure which drops out of the 30 year mean to make way for Aug. 2012 is Aug 1982, which was -0.02c, so this Aug. would have to be lower than that, to make the average fall.
We will have to wait until the figures from the 1990's drop out of the average before we see any slow down in the 30 year average, but we will have to wait until 2025 or so for that.
A filtered average, giving more weight to recent years might show a quicker response to the recent slow down.
Complain about this comment (Comment number 25)
Comment number 26.
At 21:17 16th Sep 2012, QuaesoVeritas wrote:#24. - greensand wrote:
"Thanks QV, as usual I missed the obvious! Yes, it makes sense and possibly explains why some think "There's no sign of any let up" when in actual fact the present GISS LOTI 30 year warming trend is reducing. "
I'm not sure that is the case. The average still includes the latest figures, and is the same value, it's just shown in a different place, but see my post #25.
I'm not sure if WoodforTrees does filtered averages.
Complain about this comment (Comment number 26)
Comment number 27.
At 21:29 16th Sep 2012, QuaesoVeritas wrote:I don't know about GISS, but of course, the MO do produce a graph of HadCRUT3 smoothed annual average, and one using a 21 point filter, both of which do show a recent decline:
https://www.metoffice.gov.uk/hadobs/hadcrut3/diagnostics/global/nh+sh/
Complain about this comment (Comment number 27)
Comment number 28.
At 22:23 16th Sep 2012, greensand wrote:26. QuaesoVeritas wrote:
"I'm not sure if WoodforTrees does filtered averages."
The following might sound a bit strong, for which I apologise in advance, but I am an engineer of the type that is more accurate with a lump hammer than a micrometer, I deal in actual present day facts, data about the here and now. Not probabilities and semantics, sorry I know no other way.
I am interested in whether GISS LOTI 30 year (360 months) rolling average rate of warming based on the last actual observed data shows an increasing or decreasing trend! Once plotted the direction appears to declare itself!
I try very hard to remove the confusion created by the "interpretation" data. The last 30 year (360 months) actual data for GISS LOTI shows a yearly trend of circa +0.0163C, yay or nay?
The 30 year (360 months) data for GISS LOTI up to Dec 2003 shows a trend of circa +0.0181C, yay or nay?
One is circa 10% lower than the other, yay or nay?
So is the present day 30 year (360 month) GISS LOTI warming trend increasing or decreasing? To me a simple straightforward question, or is it?
Complain about this comment (Comment number 28)
Comment number 29.
At 22:31 16th Sep 2012, greensand wrote:27. QuaesoVeritas wrote:
"the MO do produce a graph of HadCRUT3 smoothed annual average, and one using a 21 point filter"
I have been chastised on numerous occasions for quoting the MO's:-
"Annual series smoothed with a 21-point binomial filter"
https://www.metoffice.gov.uk/hadobs/hadcrut3/diagnostics/global/nh+sh/
Being told that it is just impossible, because the future has not yet happened?
I just don't understand the need to complicate the actual?
Complain about this comment (Comment number 29)
Comment number 30.
At 23:39 16th Sep 2012, quake wrote:"In Dec 2003 the GISS LOTI 30 year running mean rate of warming reached its maximum recorded rate of +0.0181C"
It wobbles:
Dec 1999 +0.01546C (30 year trend of Jan 1970 - Dec 1999)
Dec 2000 +0.0156C
Dec 2001 +0.0156C
Dec 2002 +0.0165C
Dec 2003 +0.0181C
Dec 2004 +0.0175C
Dec 2005 +0.0178C
Dec 2006 +0.0167C
Dec 2007 +0.0174C
Dec 2008 +0.0162C
Dec 2009 +0.0161C
Dec 2010 +0.0169C
Dec 2011 +0.0173C
Present +0.01627C
It looks to me it's just wobbling around a 0.015C-0.018C range.
The major cause of the wobble is whether El Ninos and La Ninas happen to occur at the start or end of the record.
For example the jump from December 2001 to December 2003 was because the 30 year period jan1972-dec2001 period started with an El Nino and ended with a La Nina. Whereas the jan1974-dec2003 period started with a La Nina and ends with an El Nino. The addition and removal of El Ninos and La Ninas from the start and end of the 30 year period slightly imbalances it causing those wobbles.
The latest 30 year period starts in 1982, which covers the 1982/83 El Nino, one of the biggest on record. That will bias the 30 year trend lower. And of course the latest 30 year period also ends with domination of La Ninas (the recent beginnings of an El Nino notwithstanding) which will also bias it lower.
I expect in 2014 when the El Nino years 1982 and 1983 drop off the last 30 year period the trend will markedly increase back into the 0.017s.
Complain about this comment (Comment number 30)
Comment number 31.
At 00:00 17th Sep 2012, greensand wrote:@30. quake wrote:
"I expect in 2014 when the El Nino years 1982 and 1983 drop off the last 30 year period the trend will markedly increase back into the 0.017s."
Ah, interesting isn't it? Maybe the past will shift the rate up, no mention of any future warming contributing? I wonder why? Maybe you are realising what a lot have always known, the here and now is real! Anything in the future is opinion!
Welcome to the real world!
Complain about this comment (Comment number 31)
Comment number 32.
At 00:07 17th Sep 2012, greensand wrote:PS +0.17C rate in 2 years time will still be a 10+% decrease in warming capability. Equating to +1.7C per century and decreasing, so ask yourself just where will the +2C by 2050 come from? Fastest rise in CO2 and carrying capability has gone, so where will all the energy come from?
Complain about this comment (Comment number 32)
Comment number 33.
At 00:12 17th Sep 2012, greensand wrote:PPS, thanks for your confirmation that the GISS LOTI 30 year rate of warming is at present 10% lower than it was in Dec 2003!
Complain about this comment (Comment number 33)
Comment number 34.
At 00:30 17th Sep 2012, john_cogger wrote:But it's 5% higher than 2000 and 2001? :-)
Complain about this comment (Comment number 34)
Comment number 35.
At 01:26 17th Sep 2012, RobWansbeck wrote:@|30, quake wrote:
“ It looks to me it's just wobbling around a 0.015C-0.018C range. “
It doesn't simply wobble. Yes, there is noise but if you plot it out you will see that the rate rapidly peaks then gradually falls away.
Complain about this comment (Comment number 35)
Comment number 36.
At 01:46 17th Sep 2012, RobWansbeck wrote:@23, QuaesoVeritas wrote:
“ I haven't really being following the discussion because I can't see the point. “
The 'Lew Paper' is so full of holes that it is of no use yet it is being used in the media to imply that anyone who doubts the infallibility of 'climate scientists' must be mentally deficient.
The discussion also gives a great insight into the lengths that SkS and similar sites will go to protect their followers from inconvenient truths.
It's not science but it really does make fascinating reading.
Complain about this comment (Comment number 36)
Comment number 37.
At 02:04 17th Sep 2012, RobWansbeck wrote:BTW, Lucia is running another series of posts on temperature trends and model performance with the first recent one here:
https://rankexploits.com/musings/2012/hadcrut-trends-flat-for-15-years/
Complain about this comment (Comment number 37)
Comment number 38.
At 09:14 17th Sep 2012, QuaesoVeritas wrote:#28. - greensand wrote:
"So is the present day 30 year (360 month) GISS LOTI warming trend increasing or decreasing? To me a simple straightforward question, or is it?"
Are you really aiming that question at me, or at quake?
I don't think I have ever questioned your figures.
My spreadsheet GISS figures don't have all of the recent retrospective adjustments but I generally agree with your figures, i.e. there has been a fall in the trend since Dec. 2003.
If you look at how the 30 year trend has changed on a rolling basis since 1909 (something you can't do with WoodForTrees), it appears that it falls into a cyclical pattern, of roughly 60 years, similar to the 50 year trend which I have mentioned in the past. In the case of the 30 year trend, the cycle appears to have reached a high in 1946, and a low in 1967, and another high in 2004, from which it is currently falling. If the cycle is repeated (a big if), we should see a declining trend for the next 20 years approx.
I strongly advise everyone to calculate the a rolling 30 year trend and look at the results.
Complain about this comment (Comment number 38)
Comment number 39.
At 09:19 17th Sep 2012, QuaesoVeritas wrote:#29. - greensand wrote:
"Being told that it is just impossible, because the future has not yet happened?"
I think that in order to avoid the appearance that the figures aren't up to date, the MO assume that the "future" years in the 21 point filter are the same as the current year, which possibly gives too much weight to the current year, but that will sometimes make the figures look too high, when the current year is high, or too low when the current year is low, although the MO probably didn't anticipate any of the current years being low.
It does have the advantage of picking up any recent trends, not picked up in a simple 30 year average.
Complain about this comment (Comment number 39)
Comment number 40.
At 09:24 17th Sep 2012, QuaesoVeritas wrote:#30. - quake wrote:
"It looks to me it's just wobbling around a 0.015C-0.018C range."
These variations are tiny, when compared to how the trend has changed since 1909.
As I said in my post #38, please look at how the rolling 30 year trend has changed since 1909. This is quite easy to calculate in a spreadsheet, using the "slope" function, but I don't think it's possible usinge "WoodForTrees".
Complain about this comment (Comment number 40)
Comment number 41.
At 09:32 17th Sep 2012, QuaesoVeritas wrote:#34. - john_cogger wrote:
"But it's 5% higher than 2000 and 2001? :-)"
Trend in 1925 = -0.011c/decade
Trend in 1946 = +0.141c/decade
Trend in 1967 = -0.037c/decade
Trend in 2003 = +0.179c/decade (gain over 1946 = 0.038c)
Trend in 2012 = +0.166c/decade
Trend in 2032 = ???
The important thing is how much higher the peaks and troughs are at the same part of the cycle.
The cycle appears to be increasing but it is misleading to look at the current trend, since it may be at it's peak.
Complain about this comment (Comment number 41)
Comment number 42.
At 09:37 17th Sep 2012, QuaesoVeritas wrote:Has RSS stopped functioning?
Complain about this comment (Comment number 42)
Comment number 43.
At 09:51 17th Sep 2012, quake wrote:Re 31
Future warming will contribute to the trend, but I can't obviously tell for sure what that will be. On the otherhand the 82/83 El Nino is certain to drop off the last 30 year period by 2014 which will increase the 30 year warming trend.
A PDO switch and deep solar minimum have all failed to significantly reduce the warming trend. ENSO has contributed to wobbles. Wobbles in this graph are hardly significant:
https://www.woodfortrees.org/plot/gistemp/mean:360:/from:1970
In the longterm I expect the 30 year trend to continue upwards at about the same rate as shown in that graph, with wobbles. Maybe the rate will appreciatively change, but I see no evidence of that at the moment and it could change in either direction.
"so ask yourself just where will the +2C by 2050 come from?"
None of the IPCC projections show that. I expect about 2C by 2100 which is in line with the current rate of increase.
Complain about this comment (Comment number 43)
Comment number 44.
At 10:08 17th Sep 2012, quake wrote:actually delete this part: "A PDO switch and deep solar minimum have all failed to significantly reduce the warming trend."
I forget we are dealing with the 30 year mean here (not a 30 year record) and any changes would not affect that much.
Complain about this comment (Comment number 44)
Comment number 45.
At 11:08 17th Sep 2012, John Marshall wrote:For those frantic about Arctic ice the Antarctic has now exceeded past sea ice cover records. It now has 1M sq.Km more ice than normal (If there is such a thing). It has been found that planetary sea ice seesaws between north and south cyclically and low Arctic ice does not foretell doom just a natural cycle as is rainfall.
The problem in this country is that the Environment Agency cannot afford to dredge rivers, a vital maintenance measure. Rivers transport sediment which gets deposited downstream raising the river bed levels. This causes even a normal rain storm to cause flooding of flood plain. A good reason not to build on flood plain.
Complain about this comment (Comment number 45)
Comment number 46.
At 12:49 17th Sep 2012, QuaesoVeritas wrote:#45. - John Marshall wrote:
"It has been found that planetary sea ice seesaws between north and south cyclically and low Arctic ice does not foretell doom just a natural cycle as is rainfall."
Do you have a source for that ? I know that is how it appears at the moment but I wondered if it had been the subject of a scientific paper.
"This causes even a normal rain storm to cause flooding of flood plain. A good reason not to build on flood plain."
I think there is a problem with drainage in general. There was a flood near me caused by the blockage of a culvert, which caused water to build up on a railway line, which overflowed into an adjacent street.
Local councils are not cleaning drains until after there has been a flood, and not being proactive.
A National Trust site near where I live, has cut down trees and is busy covering fields with tarmac next to a river, to build a car park, (to encourage more visitors), which will of course cause water to run into the river faster and possibly make flooding worse downstream. This sort of thing is happening on a wide scale but the idiots don't seem to realise the effect it is having on drainage.
Complain about this comment (Comment number 46)
Comment number 47.
At 12:57 17th Sep 2012, Adrian Buckland wrote:Sorry to disagree with an ex colleague so to speak but for me High pressure looks quite dominant now https://www.mountaindays.net/synoptic/chart.php?period=120.
Nadine is interesting though looks set to meander around the 40 north mark. I wonder if its associated heat will assist in the high pressure to the north to build?
Complain about this comment (Comment number 47)
Comment number 48.
At 13:19 17th Sep 2012, Adrian Buckland wrote:Some of you may find this interesting. The increase in the Antarctic is not necessarily what one first might think. https://www.aoml.noaa.gov/phod/docs/Shu_etal_2012.pdf
Complain about this comment (Comment number 48)
Comment number 49.
At 14:37 17th Sep 2012, RobWansbeck wrote:@48, Adrian Buckland
It is extremely disappointing to see a paper published in 2012 reference the deeply flawed Steig 09 paper. If the authors are unaware or unable to understand the problems with Steig 09 then we can have no confidence that they can understand anything else.
Even some members of the SkS private members club understand the issues although they wont say so in public.
Complain about this comment (Comment number 49)
Comment number 50.
At 17:36 17th Sep 2012, greensand wrote:38. QuaesoVeritas wrote:
"Are you really aiming that question at me, or at quake?"
Sorry QV! I was trying to juggle too many discussions last night, the best I can say is I got the right blog! One comment left on another blog was not so lucky!
Many thanks for "If you look at how the 30 year trend has changed on a rolling basis since 1909...."
I will go away and have a look. Up to now I have restricted myself to the satellite period. Partly due to the numerous discussions/arguments re the retrospective changes to the terrestrial based databases. Your comments about 50/60 year cycles sure are interesting.
Also I certainly agree about calculating the rolling 30 year trend, once plotted, trends and most importantly changes in trends are very easy to observe
Complain about this comment (Comment number 50)
Comment number 51.
At 20:21 17th Sep 2012, QuaesoVeritas wrote:#50. - greensand wrote:
"Sorry QV! I was trying to juggle too many discussions last night, the best I can say is I got the right blog! One comment left on another blog was not so lucky!"
No problem, it is easy to get confused.
BTW, you can see the apparent cycle in the 50 year HadCRUT3 trend on the "Climate4You" website, put there by Ole Humlum at my suggestion.
https://www.climate4you.com/
Click on "Global Temperature", then "Cyclic Air Temperature Changes".
Of course, it is entirely possible that we don't have sufficient data to confirm that the cycle is real, but if it is, the trend should start to fall.
I have heard references to 60 year cycles elsewhere on the internet, but I don't know their origins.
Complain about this comment (Comment number 51)
Comment number 52.
At 20:24 17th Sep 2012, QuaesoVeritas wrote:Having said the above, if the cycle is real, it still suggests that temperatures are rising overall, but not as fast as currently is the case.
Complain about this comment (Comment number 52)
Comment number 53.
At 20:39 17th Sep 2012, newdwr54 wrote:There seems to be a lot of discussion about rolling 30-year temperature trends (which gives the rolling rate of temperature rise) and 30-year average temperatures (which give real world measured temperatures).
You can have a decreasing 'rate of rise' alongside rising 'real world temperatures'.
In fact that's where are at present.
A decreasing rate of temperature rise is *not* a decrease in rising temperatures.
Complain about this comment (Comment number 53)
Comment number 54.
At 09:15 18th Sep 2012, QuaesoVeritas wrote:#53. - newdwr54 wrote:
"A decreasing rate of temperature rise is *not* a decrease in rising temperatures."
I think what you meant was that "it is not a decrease in temperatures". Putting the word "rising" in front of the word "temperatures" is slightly misleading.
But it is, as you say, a decrease in the rate of rise of temperatures, which MAY eventually be reflected in a decline in temperatures.
Complain about this comment (Comment number 54)
Comment number 55.
At 10:41 18th Sep 2012, lateintheday wrote:johncogger - indifference?
Ask yourself what lies behind the Lewandowsky study.
A. Do you think the survey is a genuine attempt to reveal a psychological flaw, common to climate sceptics?
B. Do you think the survey is a tactical ploy, designed to discredit or undermine the sceptic community.
C. I can't think of one.
My view is that anyone who answers (A) needs to step back for a moment and take a good look in the mirror. How have they allowed themselves to become a person of such intolerance that they consider a contradictory opinion a sign of mental illness or frailty.
Anyone who answers (B) accepts that there is a game being played out which has little to do with science, and everything to do with policy. This answer undermines AGW science in that it implies that anything and everything which we hear from the consensus might also be part of the game. Genuine scientific studies and tactical 'policy driven' studies would be indistinguishable to the layman. Result - credibility down the plughole.
Complain about this comment (Comment number 55)
Comment number 56.
At 13:38 18th Sep 2012, Paul Homewood wrote:Woops! Looks like the Met Office have got it wrong. Their outlook at the end of August forecast "September will be slightly warmer than average" and "For UK averaged rainfall the predicted probabilities weakly favour below normal values during September."
https://www.metoffice.gov.uk/media/pdf/k/s/A3-plots-temp-SON.pdf
https://www.metoffice.gov.uk/media/pdf/i/e/A3-plots-precip-SON.pdf
Complain about this comment (Comment number 56)
Comment number 57.
At 14:23 18th Sep 2012, newdwr54 wrote:56.PaulHomewood:
CET to 17th is currently +0.7C above normal, i.e. slightly above average: https://www.metoffice.gov.uk/hadobs/hadcet/cet_info_mean.html
Too early to say if MO is wrong again.
Complain about this comment (Comment number 57)
Comment number 58.
At 14:42 18th Sep 2012, John Marshall wrote:#46 QV The relationship between Arctic/Antarctic sea ice cover is covered on the wattsupwiththat web site.
Culverts are a problem both from blocking and being installed at a smaller size than is really required, presumably to save money. In Spain, where rains in spring can be torrential thunderstorms, the use of culverts is avoided by the use of the French style open drains. Blockages are easily seen and cleared and excess rain overflows without backing up, as happens here. They also move water quicker than a covered system which is the best way to avoid flooding.
Complain about this comment (Comment number 58)
Comment number 59.
At 15:02 18th Sep 2012, QuaesoVeritas wrote:#58. -, John Marshall wrote:
"The relationship between Arctic/Antarctic sea ice cover is covered on the wattsupwiththat web site."
Thanks, I don't regularly visit there, but I will have a look.
"Culverts are a problem both from blocking and being installed at a smaller size than is really required, presumably to save money. In Spain, where rains in spring can be torrential thunderstorms, the use of culverts is avoided by the use of the French style open drains. "
Of course, the argument will be that in the past we have never needed such large Culverts and/or open drains, so the need for them will be seen as evidence of "climate change".
However that doesn't take into account the other widespread changes to land use, which I think is having a major impact on drainage patterns.
"Climate change" is a useful scapegoat.
Complain about this comment (Comment number 59)
Comment number 60.
At 20:47 18th Sep 2012, Boanta wrote:I see my request for discussion on the paper by Ole Humlum et al 1012, regarding the phase relation of C02 and temperature was followed by a closure of further comments, so at the risk of closing this thread down, I repeat the request.
Complain about this comment (Comment number 60)
Comment number 61.
At 20:51 18th Sep 2012, newdwr54 wrote:According to JAXA data from the Japanese Space Agency, Arctic sea ice extent dipped to under 3.5m km2 on Sunday.
If 3.49m km2 proves to be the daily average minimum extent in JAXA for 2012 (which looks likely), then it's over 765,000 km2 (i.e. 3.2 x the surface area of the entire UK) lower than the daily minimum extent reached in 2007, the year that held the previous record for daily extent minimum.
According to JAXA, every single day since Aug 24th has been below the daily minimum extent reached in 2007, and this sorry state of affairs looks set to continue, perhaps throughout September, and possibly even beyond that.
Complain about this comment (Comment number 61)
Comment number 62.
At 20:55 18th Sep 2012, newdwr54 wrote:60. Boanta wrote:
It's discussed here: https://www.realclimate.org/index.php/archives/2012/09/el-ninos-effect-onco2-causes-confusion/
It's described as weak on four counts: analysis, physics, review of previous literature, and logic.
Complain about this comment (Comment number 62)
Comment number 63.
At 21:22 18th Sep 2012, john_cogger wrote:@60 Boanta
The threads are closed after a week automatically, not because you or Piers have posted in it.
Complain about this comment (Comment number 63)
Comment number 64.
At 21:30 18th Sep 2012, john_cogger wrote:@55 Lateintheday
I think it's a bit of A and a bit of B. I don't think it sets out to find psychological flaws but does look at how certain minds/people are more open to certain theories. At the same time I don't think the Professor was suprised by the results, which obviously backed up his world viewpoint.
Again not sure why a psychology paper (the lowest of the sciences :-)) is getting so much attention, especially when it's clear not many people understand the techniques used in this area and what the results actually show.
Though the bombarding of the Uni with freedom of info requests does highlight a certain conspiracy theory that every paper is a scam or a fraud unless it backs up a certain viewpoint.
Complain about this comment (Comment number 64)
Comment number 65.
At 01:23 19th Sep 2012, RobWansbeck wrote:@64, john_cogger wrote:
“ Again not sure why a psychology paper (the lowest of the sciences :-)) is getting so much attention, especially when it's clear not many people understand the techniques used in this area and what the results actually show. “
Many sceptics, including people who do 'understand the techniques used in this area and what the results actually show', were of the same opinion until the paper's unfounded results were quoted unquestioningly in media outlets and used in attempts to stifle debate.
Some people who do 'understand the techniques used in this area and what the results actually show' have put the 'Lew Paper' forward as an example of getting everything wrong that could go wrong. I believe this is far too harsh; I'm fairly sure he spelt his name correctly and I haven't noticed any other spelling mistakes.
You, yourself, fall victim of believing in conspiracy theories when you write “the bombarding of the Uni with freedom of info requests”.
Are you also a believer in the 'climate disinformation campaign' conspiracy theory?
Lew's blog is run by SkS moderators. Below is a link where SkS Tree-Hutter Dana blames the climate disinformation campaign for the lack of public belief in CAGW yet is totally unable to provide a shred of evidence that such a campaign exists so resorts to censorship (look at the comments):
https://www.shapingtomorrowsworld.org/nuccWhatsDone.html
It is the CAGW alarmists obsession with conspiracy theories that makes them believe that others must be the same.
Complain about this comment (Comment number 65)
Comment number 66.
At 09:02 19th Sep 2012, Boanta wrote:63---I see you are still not doing irony or humour.
Complain about this comment (Comment number 66)
Comment number 67.
At 09:09 19th Sep 2012, QuaesoVeritas wrote:#61. - newdwr54 wrote:
"According to JAXA, every single day since Aug 24th has been below the daily minimum extent reached in 2007, and this sorry state of affairs looks set to continue, perhaps throughout September, and possibly even beyond that."
The Sunday figure may turn out to be the minimum this year, but it might be too soon to say for certain.
Having reached that low point, it wouldn't be surprising if the extent remained below 2007 for the rest of September.
However, I find it difficult to understand how the continuation of a natural process of ice decline for the last 10,000 years or so, can be described as "sorry state of affairs". Actually an increase in ice extent, so that it eventually covered Britain, would, IMHO, be a much more sorry state of affairs.
Why is this a "sorry state of affairs"?
Complain about this comment (Comment number 67)
Comment number 68.
At 09:13 19th Sep 2012, QuaesoVeritas wrote:#55. - lateintheday wrote:
"B. Do you think the survey is a tactical ploy, designed to discredit or undermine the sceptic community."
Of course, that in itself, would probably constitute a "conspiracy theory" ;)
Complain about this comment (Comment number 68)
Comment number 69.
At 09:18 19th Sep 2012, QuaesoVeritas wrote:#65. - RobWansbeck wrote:
"Lew's blog is run by SkS moderators. Below is a link where SkS Tree-Hutter Dana blames the climate disinformation campaign for the lack of public belief in CAGW yet is totally unable to provide a shred of evidence that such a campaign exists so resorts to censorship (look at the comments):"
Tree-Hutter?
Is that building huts out of trees?
Complain about this comment (Comment number 69)
Comment number 70.
At 13:35 19th Sep 2012, john_cogger wrote:@65 Lateintheday
"You, yourself, fall victim of believing in conspiracy theories when you write “the bombarding of the Uni with freedom of info requests”. "
When -
A) One side (bloggers/commentators) say they are going to request data and complain to ethics committees.
B) The other say they have done it.
Not really a conspiracy theory when both sides seem to agree on whats happened.
A better conspiracy is -
A) A Prof writes a paper saying he emailed 5 blogs.
B) People say he didn't email anyone and its all a scam.
What happened with that one?
Complain about this comment (Comment number 70)
Comment number 71.
At 13:40 19th Sep 2012, John Marshall wrote:#59 QV--- I am sure that French Drains were unpopular here is the fact that they are open. Some H&S issue I suppose but they cause no problems abroad, unless you drive badly and end up in one.
The case for open drainage has been around for decades and climates change, always will.
Complain about this comment (Comment number 71)
Comment number 72.
At 14:21 19th Sep 2012, RobWansbeck wrote:@69 QV:
https://www.bishop-hill.net/blog/2012/3/26/opengate-josh-158.html
Complain about this comment (Comment number 72)
Comment number 73.
At 14:26 19th Sep 2012, RobWansbeck wrote:@70, john_cogger,
So a request for data and a complaint about an error strewn paper is 'bombarding of the Uni with freedom of info requests'.
As for your second point, Lewandowsky did not email any of the 5 blogs so the people saying that he didn't email them are indeed correct.
Complain about this comment (Comment number 73)
Comment number 74.
At 20:06 19th Sep 2012, QuaesoVeritas wrote:The NCDC/NOAA anomaly figures for August have been published, but the sitiuation is complicated by further retrospective adjustments to the previous anomaly figures.
The explanation seems to be the following, from their website:
"PLEASE NOTE: Effective September 2012, the GHCN-M version 3.2.0 dataset of monthly mean temperature replaced the GHCN-M version 3.1.0 monthly mean temperature dataset. Beginning with the August 2012 Global monthly State of the Climate Report, GHCN-M version 3.2.0 is used for NCDC climate monitoring activities, including calculation of global land surface temperature anomalies and trends."
Needless to say, this has resulted in global anomalies up to approximately 1947 being reduced by up to 0.04c and those afterwards being increased, by up to 0.03c.
In the following, the first figure is the most recent figure for August, the second is last months revised July figure and the third is the original July figure.
Global = 0.6205c, 0.6431c, 0.6199c
N.H. = 0.6902c, 0.8246c, 0.7875c
S.H. = 0.5521c, 0.4508c, 0.4431c.
After adjustment to 1961-90, the August figures are equivalent to 0.483c, 0.600c and 0.376c respectively. However, as a result of the revised temperatures, the adjustment figures may no longer be valid and I will have to check that.
So while the August global figure is down relative to the revised July figure, it is up relative to last month's July figure, because last month's July figure was revised upwards by 0.0232c.
Like GISS & UAH, the N.H. anomaly shows a decline and the S.H. shows a rise, but as the S.H. rise is relatively lower, the global figure also shows a fall, unlike GISS & UAH.
Complain about this comment (Comment number 74)
Comment number 75.
At 20:18 19th Sep 2012, QuaesoVeritas wrote:RSS figures also published tonight!
Global = 0.256c compared to 0.291c for July
N.H. = 0.340c, compared to 0.454c for July
S.H. = 0.168c, compared to 0.121c for July
After adjustment to 1961-90, the above are equivalent to 0.403c, 0.501c and 0.305c respectively.
Once again, a fall in the N.H. and a rise in the S.H., and like NCDC/NOAA, the S.H. rise is more than offset by the N.H. fall, resulting in an overall fall in the global anomaly.
So that means 2 increases in global anomaly (UAH & GISS) and 2 decreases (RSS & NOAA), strangely not divided by satellite/non-satellite sources.
Since this year so far, HadCRUT3 has tended to track NCDC/NOAA, a small fall in HadCRUT3 now seems possible.
Complain about this comment (Comment number 75)
Comment number 76.
At 20:23 19th Sep 2012, QuaesoVeritas wrote:I have just noticed that the HadSST2 (which is a component of HadCRUT3), does show an increase from 0.385c to 0.432c, so that might indicate a small rise in HadCRUT3 after all, although that is by no means certain.
Complain about this comment (Comment number 76)
Comment number 77.
At 22:19 19th Sep 2012, greensand wrote:Hi QV, many thanks for the info, very busy at present, so much appreciated.
Also thanks for pointing me to Climate4You, lots of good data and your post 74 above reminded me of this chart:-
https://www.climate4you.com/images/NCDC%20Jan1915%20and%20Jan2000.gif
One day all might become clear
Complain about this comment (Comment number 77)
Comment number 78.
At 22:27 19th Sep 2012, greensand wrote:Very interesting, just checked the link I posted in 77 and all is now blank, not just the link but also at C4y. Can only assume it is being updated with the changes QV posted about.
Time will tell.
Complain about this comment (Comment number 78)
Comment number 79.
At 08:35 20th Sep 2012, lateintheday wrote:Interesting article the other day on ENSO. On the face of it, Tisdale explains why the after effect of ENSO is not necessarily neutral over time. This jars with the more commonly reported view put forth by pro AGW commentators, which is that since it is an oscillation, it cannot contribute to a long term trend in global temps. Whether you agree with it or not is a different matter, but it is informative nevertheless. It's at WUWT titled: The Warming of the Global Oceans – Are Manmade Greenhouse Gases Important or Impotent? Posted on September 16.
Johncogger@70 - You've mixed me up with another denier. Perhaps we all sound the same to you? That wouldn't surprise me since as you now know, we deniers are all certifiable, fake sceptics, conspiracy theorists or oil shills. Stereotyping, negative associations and labels don't really matter do they - not when you have scientificky proof.
Complain about this comment (Comment number 79)
Comment number 80.
At 08:39 20th Sep 2012, QuaesoVeritas wrote:#78. - greensand wrote:
"Very interesting, just checked the link I posted in 77 and all is now blank, not just the link but also at C4y. "
The link worked yesterday but when I tried it first thing this morning it didn't, but it does now, including the site in general, so maybe the site was being updated, because that normally happens about this time of the month. Ole Humlum doesn't usually wait for HadCRUT3.
An interesting graph, which demonstrates how much of the warming is due to data adjustment, at least in the case of NCDC/NOAA. I was a bit surprised that the graph included this August's figures.
On the basis of that graph, about 0.12c of the rise in January temp. between 1915 and 2000 is entirely due to differential adjustements. However, the fact that the scales are not continuous does exaggerate it a bit, and I wonder if that month was "cherry picked"?
He also says that GISS was affected by adjustments this month, but I didn't notice that.
Complain about this comment (Comment number 80)
Comment number 81.
At 08:52 20th Sep 2012, greensand wrote:BOM have posted their latest "Model Outlooks of ENSO Conditions" 19th Sept 2012
"Most dynamical models surveyed by the Bureau of Meteorology suggest that sea surface temperatures in the tropical Pacific will maintain values around El Niño thresholds before returning to clearly neutral values towards the end of 2012 or early 2013."
https://www.bom.gov.au/climate/ahead/ENSO-summary.shtml
Still awaiting the UK Met Office GloSea Sept update.
Whilst most models say back to neutral, the trade winds are definitely slowing in the Western Pacific, usually a El Nino indicator. Time will tell.
Complain about this comment (Comment number 81)
Comment number 82.
At 09:15 20th Sep 2012, greensand wrote:@80 QV
I need to spend some more time at Ole Humlum's place, well done for getting the HadCRUT 50 year annual trend included.
Apart from the accumulation of data and form of presentation there is other interesting info, e.g. the comments on "Data Smoothing".
I have yet to comprehend the logic of ongoing differential adjustments.
Complain about this comment (Comment number 82)
Comment number 83.
At 09:26 20th Sep 2012, QuaesoVeritas wrote:#82. - greensand wrote:
"I have yet to comprehend the logic of ongoing differential adjustments."
The fact that they always seem to result in decreases in the past and increases in more recent figures, might lead some to believe that it is a "conspiracy"!
But I think that would be too obvious.
Complain about this comment (Comment number 83)
Comment number 84.
At 09:37 20th Sep 2012, QuaesoVeritas wrote:I don't normally pay much attention to "Real Science", becauase I personally find Stephen Goddard too aggressive, but I found the link to the PBS interview here interesting:
https://stevengoddard.wordpress.com/2012/09/19/pbs-greenland-ice-sheet-melted-in-four-days/
Personally I thought the interview fairly unbiased, but I really hated the use of the term "deeptime". Do NASA scientists *really* use that term?
Note how after Thomas Wagner uses it, Margaret Warner starts to use it, as if it was a perfectly normal expression!
Complain about this comment (Comment number 84)
Comment number 85.
At 10:38 20th Sep 2012, john_cogger wrote:@79 Lateintheday
Sorry, mixed you up.
No all deniers do not sound the same. As there is a wide range of 'alternative' theories, from it's getting warmer but we will be ok, all the way to the ice age has started.
Some likes Watts, Monckton, Spencer are happy with C02 and the GHG theory, Piers thinks it's all the sun, Big Joe thinks it's cooling any second now and it's natural, others think it's all about pressure. And I'm sure there are quite a few other theories in between. So no, you don't all sound the same.
Also you can chuck in a few conspiracy theories in there too, with New world orders, European commissionars, socialist plot to tax all…
I'll leave David Icke's theories for another day... :-)
Complain about this comment (Comment number 85)
Comment number 86.
At 11:20 20th Sep 2012, lateintheday wrote:johncogger - well that's a relief. I had visions of Monthy Python's 'yes, we are all individuals' scene running through my head.
Complain about this comment (Comment number 86)
Comment number 87.
At 00:10 21st Sep 2012, Lazarus wrote:QuaesoVeritas wrote:
"I don't normally pay much attention to "Real Science", becauase I personally find Stephen Goddard too aggressive, but I found the link to the PBS interview here interesting"
Not sure why you didn't just include the PBS link then. Sad to see that the wingnuts on Goddard's site are saying things about the interview like;
"drivel", "government propaganda" etc when the scientist clearly stated that the Greenland melt discussed was due to unusual weather, wasn't unprecedented and couldn't be connected to global warming.
Complain about this comment (Comment number 87)
Comment number 88.
At 09:49 21st Sep 2012, greensand wrote:Whilst waiting for the MO GloSea (ENSO) Sept model update I have been having a look at how the model has fared so far this year.
The March prediction has turned quite well, observations well within the Ensemble Forecast:-
https://www.metoffice.gov.uk/images/elnino/20120301/nino34_anom_20120301.png
However since then, each subsequent month's prediction has proved to be higher than the actual observations, e.g. see June and July below:-
https://www.metoffice.gov.uk/images/elnino/20120601/nino34_anom_20120601.png
https://www.metoffice.gov.uk/images/elnino/20120701/nino34_anom_20120701.png
All the Ensemble Forecasts and subsequent observations can be viewed here:-
https://www.metoffice.gov.uk/research/climate/seasonal-to-decadal/gpc-outlooks/el-nino-la-nina
Just choose the month required from the drop down list.
I wonder if ENSO not complying with the Ensemble Forecast is one of the reasons why the UKMO Global temps forecast seem to struggle complying with observations. Seem to recall that commentator " ukpahonta" has expressed such concerns previously, just that I had not had a look at the actual charts.
Complain about this comment (Comment number 88)
Comment number 89.
At 09:53 21st Sep 2012, newdwr54 wrote:84. 20th Sep 2012, QuaesoVeritas wrote:
"I don't normally pay much attention to "Real Science", because I personally find Stephen Goddard too aggressive.."
Does anyone know whether Goddard paid up the $50 to the WWF due to the bet he lost re Arctic sea ice minimum extent 2012? He offered a challenge in April 2012 when Arctic sea ice extent was very high.
This was taken up by a punter in the comments section. Goddard had to pay $50 to WWF and publish an acknowledgement if he lost. He agreed, and at the time he dismissed the punter as a 'climate clown'... Ouch.
Complain about this comment (Comment number 89)
Comment number 90.
At 10:09 21st Sep 2012, newdwr54 wrote:88. greensand:
Perhaps it's too early to say, but it looks as though this El Nino may be short lived, and that its peak may already have passed.
I don't know how Met Office models forecast the effects of El Nino, but my understanding is that its full global temperature impact normally lags its peak by 4-6 months, and strong El Nino years don't always correspond to warm years in the UK.
For instance, most temperature providers say the strong El Nino year 2010 was either the warmest or second warmest year on record globally; however it was the 12th coldest in the MO UK record (since 1910).
Perhaps if anything the MO should project cooling for the UK in El Nino years?
Complain about this comment (Comment number 90)
Comment number 91.
At 10:44 21st Sep 2012, greensand wrote:@90 newdwr54 wrote:
"I don't know how Met Office models forecast the effects of El Nino,"
Neither do I but they claim to take them into account within their forecast periods.
In their annual forecasts:-
https://www.metoffice.gov.uk/news/releases/archive/2011/2012-global-temperature-forecast
In their decadal forecasts:-
https://www.metoffice.gov.uk/research/modelling-systems/unified-model/climate-models/depresys
"Perhaps if anything the MO should project cooling for the UK in El Nino years?"
Don't know what relevance that has to UKMO Global temp forecasts.
Complain about this comment (Comment number 91)
Comment number 92.
At 11:00 21st Sep 2012, lateintheday wrote:greensand and newdwr54 - if you haven't already seen this (my post 79) then I suggest you take a look.
https://wattsupwiththat.com/2012/09/16/tisdale-the-warming-of-the-global-oceans-are-manmade-greenhouse-gases-important-or-impotent/
Newdwr54 - I doubt that you will take his 'theory' for warming to heart; actually, I wouldn't blame you. It's interesting rather than compelling. The clear explanation of why la nina and el nino cannot be described as opposites is the takeaway for me.
Greensand - I seem to remember you looking for information earlier this year, on the mechanisms involved in heat re-distribution through ENSO. This link goes some way in answering that. However, the 'teleconnections' part is rather vague and assumes that the reader is familiar with these processes. (Which I'm not)
Complain about this comment (Comment number 92)
Comment number 93.
At 11:17 21st Sep 2012, ukpahonta wrote:As people are remaining interested in ENSO and it's effects on regional weather, UK in particular, there is an interesting paper that looks at the relationship between different types of El Nino events and their teleconnection to NH winters.
'This study contributes to the discussion on possible effects of El Niño on North Atlantic/European regional climates. We use NCEP/NCAR reanalysis data to show how the two different types of El Niños (the central Pacific, or CP, and the east Pacific, or EP) result in remarkably different European winter temperature anomalies, specifically weak warming during EP and significant cooling during CP El Niños, the latter being associated with a negative phase of the winter North Atlantic Oscillation (NAO).'
https://192.102.233.13/journals/jd/jd1201/2011JD016493/2011JD016493.pdf
Complain about this comment (Comment number 93)
Comment number 94.
At 11:18 21st Sep 2012, greensand wrote:92.lateintheday wrote:
"I seem to remember you looking for information earlier this year, on the mechanisms involved in heat re-distribution through ENSO. This link goes some way in answering that. However, the 'teleconnections' part is rather vague and assumes that the reader is familiar with these processes. (Which I'm not)"
Thanks LITD, you are quite right I have spent some time looking for explanations of the approximate timescales re the heat distribution of ENSO events. I gave up a long time ago attempting to understand the complexity of how it is modelled.
I will never be able to comprehend the complexity a climate model, but I can, if given the information see whether we (mankind) are improving our ability or not. Hence my constant nagging at the MO for not updating decadal forecasts.
Thanks for the link, have been reading and comprehending, up to a point, Bob Tisdale for a number of years. I am awaiting the reactions to his latest and the subsequent food fight and then will reassess my understanding.
Complain about this comment (Comment number 94)
Comment number 95.
At 12:20 21st Sep 2012, greensand wrote:Re CET if you have an interest have a look at the following site:-
https://www.centralenglandtemperature.co.uk/daily.html?nosplash
New to me, lots of info, can't tell who it is or why or how good the data is, have a look!
Complain about this comment (Comment number 95)
Comment number 96.
At 16:16 21st Sep 2012, newdwr54 wrote:92. lateintheday:
Thanks for the link, but nowhere did I see any convincing explanation for Bob Tisdale's claim that ENSO is the 'cause of the warming of global sea surface temperatures'.
Since ENSO is an oscillation, then it must have a net neutral influence on temperatures, whether ocean or surface. I mean that ENSO fluctuations result from heat energy recycled by ocean currents, which most scientists agree with. That explains the rises and falls in ocean surface temperature; but it does not explain where the heat energy came from in the first place, nor what sustains it.
To add heat energy to any system, including the ENSO system, you need a forcing influence. If there had been a big influx of solar forcing over the past 30-40 years then that might provide the explanation. But we know that there hasn't been one.
There has, however, been a big increase in re-radiated IR from the atmosphere to the surface due to increased GHG concentrations; so like it or not, that's currently a better explanation than solar as a heat energy source for ENSO, in my opinion.
But as Tisdale's hypothesis stands, as far as I understand it (and I may not fully understand it), what he is claiming is that seas just create heat all by themselves, without any need for any external forcing influence; a sort of 'free energy' claim that Tisdale offers no real explanation for the mechanics of.
To be fair, I like Tisdale, and think he has some good ideas. He is not afraid to confront other climate 'sceptics' such as Joe Bastardi, which is always a good sign.
Complain about this comment (Comment number 96)
Comment number 97.
At 16:53 21st Sep 2012, ukpahonta wrote:#96 Newdwr54
You are correct, you don't understand Tisdale's hypothesis, but his book would correct that for you, I'm sure that you may find a reference to it somewhere on his site!
https://bobtisdale.wordpress.com/
Complain about this comment (Comment number 97)
Comment number 98.
At 18:40 21st Sep 2012, newdwr54 wrote:97. ukpahonta wrote:
"You are correct, you don't understand Tisdale's hypothesis, but his book would correct that for you, I'm sure that you may find a reference to it somewhere on his site!"
_________________________________________________________
I have to rely on a book, or else a blog comment, to decide whether a 'game-changing' hypothesis is right or not.
As for peer review...?
Can we not just forget about peer review, now that we have the likes of (Eng. Lit. grad) James Delingpole and (Former TV weatherman) Anthony Watts to keep us right?
I mean, what would 'scientists' know that this pair wouldn't?
Complain about this comment (Comment number 98)
Comment number 99.
At 19:39 21st Sep 2012, ukpahonta wrote:#98 Newdwr54
It would be better if you relied upon your own intellect, not saying that you should agree with him or not, but if you want to understand what he says, then you should at least take the time to read what he says.
Complain about this comment (Comment number 99)
Comment number 100.
At 19:47 21st Sep 2012, QuaesoVeritas wrote:I have only read a part of the Tisdale blog (IMHO there is a lot of irrelevant stuff in the "OVERVIEW" section), but I am puzzled by the followong statements:
"On the other hand, an El Niño takes naturally created warm water from below the surface of the western tropical Pacific and relocates it the surface."
and
"The next question you may have: The El Niño released lots of warm water from below the surface of the western tropical Pacific, but how was that warm water created?
It was created during a La Niña that came before the El Niño. This happens because La Niña events reduce cloud cover and allow more sunlight than normal to penetrate and warm the tropical Pacific."
So does that mean that the sunlight heats the ocean from below the surface, before it heats the surface?
No doubt this will be explained later in the blog.
Complain about this comment (Comment number 100)
Page 1 of 2