
Global temperature update
Global temperatures in August were 0.34C above the 30 year running average, according to the UAH satellite measure, showing a small increase on the previous month, shown below.
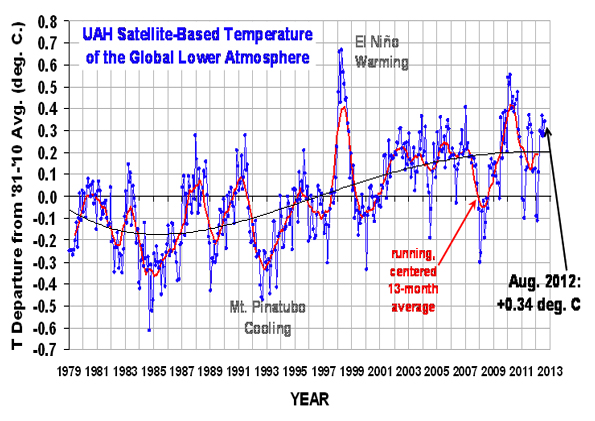
It's the 3rd warmest August in this particular satellite data set which began in 1979.
Using the more standard 1961-1990 average used by the World Meteorological Organisation, global temperatures were approximately 0.593C above average.
The recovery in global temperatures since the turn of the year has in part been due to a rise in sea surface temperatures in the equatorial Pacific, as 'La Nina' conditions faded, shown below.
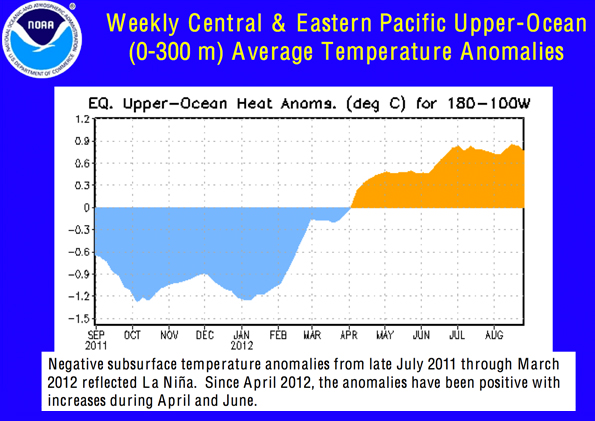
Most computer predictions expect positive sea surface temperature anomalies in this part of the world to persist into next year, with weak El Nino conditions becoming established.
Follow me on twitter @Hudsonweather
 Hello, I’m Paul Hudson, weather presenter and climate correspondent for BBC Look North in Yorkshire and Lincolnshire. I've been interested in the weather and climate for as long as I can remember, and worked as a forecaster with the Met Office for more than ten years locally and at the international unit before joining the BBC in October 2007. Here I divide my time between forecasting and reporting on stories about climate change and its implications for people's everyday lives.
Comment number 1.
At 17:00 7th Sep 2012, ukpahonta wrote:'Most computer predictions expect positive sea surface temperature anomalies in this part of the world to persist into next year, with weak El Nino conditions becoming established'
Predictions are starting to move towards a positive neutral scenario through next year which means that there will be no large release of heat from the oceans and no replenishment of heat into the oceans.
Unfortunately that could be the start of lower global temperatures, time will tell.
Complain about this comment (Comment number 1)
Comment number 2.
At 17:31 7th Sep 2012, QuaesoVeritas wrote:The relatively low UAH figure for August was mainly due to falling temperatures (as reflected in AQUA CH5), from about the 10th to the 21st of the month.
During the remainder of the month, temperatures fell much more slowly than is normal at that time of year, resulting in higher temperature anomalies. The mean anomaly for the last 7 days was probably around 0.39c.
This situation has continued during the first few days of September, and there was actually quite a large rise in temperature on Sept. 4th.
It's early days yet, but this may point to quite a moderate increase in the anomaly for September, relative to August. This would, of course, apply to other temperature anomaly series.
Complain about this comment (Comment number 2)
Comment number 3.
At 11:34 8th Sep 2012, PingoSan wrote:Stll no global warming since 1998. Why are we still wasting money on uneconomic windmills that destabilise the national grid and wreck the country's finances? A rather expensive vanity project.
Complain about this comment (Comment number 3)
Comment number 4.
At 14:42 8th Sep 2012, mjmwhite wrote:I’ve heard it said that global temperatures have risen 1 degree C over the past century.
https://junksciencearchive.com/MSU_Temps/NCDCabs1880.html
Tell that to the NCDC.
Complain about this comment (Comment number 4)
Comment number 5.
At 15:58 8th Sep 2012, Boanta wrote:Ironically both the 'AGW- Co2 warming camp' and the 'solarist cooling camp' are now predicting the Jet Stream to move southward with concomitant weather changes to back up both belief systems. Could they both be wrong?
Complain about this comment (Comment number 5)
Comment number 6.
At 17:10 8th Sep 2012, Boanta wrote:Pingosan: this is a moot point. Scotland is touted as being 'the Saudi Arabia of renewables, yet only 0.15% of world anthropgenic CO2 is generated in Scotland and only 0.05% is generated from electricity production. Taking this and the generally low and unpredictable amounts of electricity produced by wind into account, it is palpably obvious that all the wind turbines planned, will have as much impact on climate change as all the king's horses and all the king's men were to Humpty Dumpty.
Complain about this comment (Comment number 6)
Comment number 7.
At 20:07 8th Sep 2012, NeilHamp wrote:I have been waiting for Paul to talk about global temperatures to post our forecasts for 2012
Figures in brackets are last year’s forecast
“Warmists”
+0.48 Met Office (+0.44)
+0.45 Newdwr54 (N/A)
+0.43 John Cogger (N/A)
“Neutralists”
+0.42 Mr Bluesky
+0.42 Lazarus
+0.41 quake (+0.36)
+0.40 Paul Briscoe
+0.40 Gagetfriend (+0.30)
+0.40 NeilHamp ( +0.27)
“Coolists”
+0.37 Lateintheday’s Holly Bush
+0.34 QuaesoVeritas (+0.31)
+0.29 millinia (+0.24)
+0.29 LabMunkey (+0.25)
+0.28 ukpahonta (+0.35) (2011 winning entry)
I have not yet worked out the current year's mean.
QV usually has these things at his fingertips
2012 forecasts have not yet been found for:-
SmokingDeepThroat (+0.39)
Ken Sharples( +0.18)
nibor25( +0.15)
jkiller56
Highest HadCRUT Years to date
1998 0.529
2012 0.48? (Met.Office forecast for this year)
2005 0.474
2010 0.470
2003 0.467
2002 0.455
2004 0.444
Complain about this comment (Comment number 7)
Comment number 8.
At 21:03 8th Sep 2012, QuaesoVeritas wrote:#7. - NeilHamp wrote:
"I have not yet worked out the current year's mean.
QV usually has these things at his fingertips"
Based on the monthly figures, the simple average to July was 0.371c, but
according to the MO annual data files, the figure was 0.349c.
That seems more likely to reflect the MO method of calculation, but it is obviously lower
than the simple average.
Complain about this comment (Comment number 8)
Comment number 9.
At 21:06 8th Sep 2012, QuaesoVeritas wrote:Based on the simple mean, it will take monthly averages of about 0.63c for the remainder of the year for the MO forecast to be correct.
Complain about this comment (Comment number 9)
Comment number 10.
At 21:15 8th Sep 2012, greensand wrote:Hi QV, do you have any data re the "first" UKMO Decadal Forecast 2005 to 2015?
Complain about this comment (Comment number 10)
Comment number 11.
At 21:43 8th Sep 2012, QuaesoVeritas wrote:On the other hand, in order for my own forecast of 0.34c to be correct, the average for the remainder of the year will have to be 0.3c.
I'm not sure which is more likely to be the case!
Complain about this comment (Comment number 11)
Comment number 12.
At 23:31 8th Sep 2012, john_cogger wrote:As it hasn't warmed since 1998, it is useful to look at the graph at the top of the page and look at the left of 1998 and then the right. Which are lower? The temps on the left or those on the right? Which years sit above the average?
Complain about this comment (Comment number 12)
Comment number 13.
At 00:27 9th Sep 2012, ukpahonta wrote:My money's on you, QV.
Complain about this comment (Comment number 13)
Comment number 14.
At 07:22 9th Sep 2012, QuaesoVeritas wrote:#10. - greensand wrote:
"Hi QV, do you have any data re the "first" UKMO Decadal Forecast 2005 to 2015?"
I'm not entirely surewhat you mean gs.
Complain about this comment (Comment number 14)
Comment number 15.
At 08:27 9th Sep 2012, ukpahonta wrote:Greensand
https://www.metoffice.gov.uk/research/climate/seasonal-to-decadal/long-range/decadal-fc
That's it, the white line is their prediction. The three decadel periods are highlighted by the red shading for confidence levels. The prediction covering 2005 to 2015 was made in June 2005.
Up until the turn of the century the model(s) used did well apart from Mt Pinatubo eruption and the 1998 super El Nino, unpredictable events I would grant. The 2005 prediction is looking way off the mark even though it has remained within the confidence boundary for the period so far. To get near to their 2005-2015 prediction for the second half of the decade a rise from 0.34C current average of 0.2C, as shown by the blue line, is needed which given the way ENSO is shaping up, just isn't going to happen.
When the MET are willing to discuss the prediction, I don't think this will be until after the end of the prediction period, we may discover if the same model(s) and variables were used for the three predictions. As can be seen from the blue line giving a current prediction to 2016, it doesn't look as though anything has changed with the model(s) as yet.
Perhaps the model(s) will be refined after 2015!
Complain about this comment (Comment number 15)
Comment number 16.
At 09:26 9th Sep 2012, ukpahonta wrote:'One has to back to the 1940s to find the previous time that a Hadcrut3 record was not beaten in 10 years or less.'
https://www.drroyspencer.com/2012/09/uah-global-temperature-update-for-august-2012-0-34-deg-c/
One for a rainy day, QV?
Complain about this comment (Comment number 16)
Comment number 17.
At 09:43 9th Sep 2012, ukpahonta wrote:For reference the source of Paul's end comment is probably here:
https://www.cpc.ncep.noaa.gov/products/analysis_monitoring/enso_advisory/ensodisc.pdf
'Most of the dynamical models, along with roughly one-half of the statistical models, now predict the onset of El Niño beginning in August-October 2012, persisting through the remainder of the year (Fig. 6). The consensus of dynamical models indicates a borderline moderate strength event (Niño 3.4 index near +1.0°C), while the statistical model consensus indicates a borderline weak El Niño (+0.4° to +0.5°C). Supported by the model forecasts and the continued warmth across the Pacific Ocean, the official forecast calls for the development of most likely a weak El Niño during September 2012, persisting through December-February 2012-13'
Complain about this comment (Comment number 17)
Comment number 18.
At 16:33 9th Sep 2012, greensand wrote:15. ukpahonta wrote:
"That's it, the white line is their prediction. The three decadel periods are highlighted by the red shading for confidence levels. The prediction covering 2005 to 2015 was made in June 2005."
Many thanks ukpahonta, but I am not sure. I had quite a discussion with Richard Betts about this and he agreed it was far from clear and promised to talk to the author of the page. However he came back later to state that the "forecasts" that make up the white line were "retrospective" carried out as verification of the model utilised to make the "blue line" prediction i.e. the one starting in Sept 2011. As clarification he pointed to the following at the bottom of the page you linked to:-
"Verification"
"Retrospective forecasts have been made from numerous dates in the past. Some of these are shown in the top global annual temperature forecast figure (white curves and red uncertainty regions from 1985, 1995 and 2005)"
So I am not sure that the white line is a forecast made in 2005 or a hindcast/verification? I think the latter for two reasons, one, RB's comments although IIRC he was not totally clear and two, the fact that the white line is continuous what are the chances of 3 predictions made 10 years apart blending exactly into one line? I know the MO are good but...
Complain about this comment (Comment number 18)
Comment number 19.
At 16:44 9th Sep 2012, greensand wrote:@15. ukpahonta
Sorry forgot to mention RB did state that the MO Decadal Forecast was a new "modelling system/technology" still in its infancy pointing to the relevant paper (can't find it right now) but he did state (quite strongly!) that the first Decadal Prediction made was made in 2005. So at least the June 1985 and 1995 referenced on the chart are retrospective and I suspect so is the 2005 one.
Complain about this comment (Comment number 19)
Comment number 20.
At 17:03 9th Sep 2012, greensand wrote:14.QuaesoVeritas wrote:
"I'm not entirely surewhat you mean gs."
Hi QV sorry for being vague. Sometime ago you posted some data you had acquired from the MO re their latest Decadal Forecast, the one strting in Sept 2011. I think it was the monthly ensemble mean numbers ?
Just wondered if you had similar data for the 2005 to 2015 forecast.
Regards
Complain about this comment (Comment number 20)
Comment number 21.
At 18:24 9th Sep 2012, quake wrote:Re 4:
NCDC:
https://www.ncdc.noaa.gov/sotc/service/global/global-land-ocean-mntp-anom/201001-201012.gif
Complain about this comment (Comment number 21)
Comment number 22.
At 19:10 9th Sep 2012, NeilHamp wrote:I've now had chance to look at the hadCRUT3 data for the past 12 months
If my maths is correct the MAT is 0.36
This ofcourse includes the last 5 months of 2011 when La Nina conditions were still stong. Conditions down in the Pacific should be warmer for the remainder of 2012 and we can therefore expect a slightly higher year end mean for 2012.
This puts late in the day's "holly bush" in the frame for the possible winner in 2012
We haven't heard much from him recently. Can the bush tell us what sort of a winter we can expect this year?
Complain about this comment (Comment number 22)
Comment number 23.
At 23:26 9th Sep 2012, newdwr54 wrote:22. NeilHamp:
Your own estimate is in with a better shout than LitD's, in my opinion.
The heat from the warming in the Pacific is not yet fully reflected in the surface data; but it should be before the end of the year. Quake may even be in with a shout.
My estimate was scuppered by the low Jan/Feb values. The influence of the La Nina was stronger than I thought it would be.
Thanks for the updates by the way. It's been fun.
Complain about this comment (Comment number 23)
Comment number 24.
At 23:44 9th Sep 2012, newdwr54 wrote:For interest, here is Dr Spencer's graph for February 2012: https://www.drroyspencer.com/wp-content/uploads/UAH_LT_1979_thru_January_2012.png
And for August 2012: https://www.drroyspencer.com/wp-content/uploads/UAH_LT_1979_thru_Aug_2012.png
Compare the right hand side of the polynomial trend line Dr Spencer uses in these graphs.
I suspect the 4th order poly trend line's days are numbered?
Complain about this comment (Comment number 24)
Comment number 25.
At 08:43 10th Sep 2012, ukpahonta wrote:Greensand,
I see what you mean now, and with further investigation perhaps Smith D.M, Cusack S, Colman A.W, Folland C.K, Harris G.R, Murphy J.M 2007 will shed some light: https://www.sciencemag.org/content/317/5839/796.full
'Having established the predictive skill of DePreSys, we issued the first GCM-based forecast of global Ts for the coming decade'
'We also compared two eight-member DePreSys and NoAssim hindcasts with observations. The DePreSys hindcast starting from June 1985 correctly predicted a rapid warming during the transition from the weak La Niña of 1985 to the El Niño of 1986–1987 and correctly predicted the warming trend throughout the period until the eruption of Mount Pinatubo. The DePreSys hindcast starting from June 1995 correctly predicted an initial cooling, followed by a general warming. As expected, the NoAssim hindcasts predicted only the general warming trend, although the NoAssim hindcast from June 1995 is generally too warm.'
Fig. 4. is the one of interest.
'Globally averaged annual mean surface temperature anomaly (relative to 1979–2001) forecast by DePreSys starting from June 2005. The CI (red shading) is diagnosed from the standard deviation of the DePreSys ensemble, assuming a t distribution centered on the ensemble mean (white curve). Also shown are DePreSys and ensemble mean NoAssim (blue curves) hindcasts starting from June 1985 and June 1995, together with observations from HadCRUT2vOA (black curve). Rolling annual mean values are plotted seasonally from March, June, September, and December. The mean bias as a function of lead time was computed from those DePreSys hindcasts that were unaffected by Mount Pinatubo (SOM text) and removed from the DePreSys forecast (but not the hindcasts).'
Further details: https://rsta.royalsocietypublishing.org/content/367/1890/925.full
'Furthermore, the DePreSys forecast from 2005 predicted that global warming would be temporarily offset by natural internal variability, and this is supported by the observations to date. An updated forecast, starting from September 2007, predicts that the current La Niña will rapidly decay, followed by continued warming consistent with the 2005 forecast.'
Complain about this comment (Comment number 25)
Comment number 26.
At 08:58 10th Sep 2012, QuaesoVeritas wrote:#24. - newdwr54 wrote:
"I suspect the 4th order poly trend line's days are numbered?"
It's o.k., there are probably many other alternative poly trends he can pick,
which show a decline.
Unfortunately, this is one aspect of roy spencer's work which is likely to lead it into disrepute.
Another interesting fact is that in 2008, the unadjusted UAH anomaly figure was 0.365 lower than HadCrut3, and now it is only 0.176c lower, having got to only 0.065c lower in December 2010.
Also, UAH was 0.848c lower than RSS in 1998 but is only 0.481c lower now, although it was also only about 0.132c lower in 1985.
Both of the above based on 12 month moving averages.
I suspect this must be due to the different methods of calculation, but it is difficult to tell which dataset is causing the relative changes. Probably all of them!
One thing that is certain is that there appears to be a large temporal variation in the relative anomalies from the different datasets. I haven't looked at GISS & NOAA yet.
Complain about this comment (Comment number 26)
Comment number 27.
At 10:12 10th Sep 2012, lateintheday wrote:NeilHamp - the bush has yet to speak to me on the winter forecast. Its summer forecast (14th Feb) wasn't terribly successful as can be seen below.
June will be close to average temp and precipitation
July - will be close to average temp but above average precipitation
Aug - above average temps and largely dry throughout.
Although its earlier forecast from January was eerily accurate!
Continued mild UK January temps with a risk of brief cold snap from 30th Jan - 15th Feb. Soaking wet end of Winter/Early spring thereafter.
Newdwr54 says:"The heat from the warming in the Pacific is not yet fully reflected in the surface data . . ."
I don't follow you. I thought that the conditions 'on the ground' so to speak were not lagged (significantly) as opposed to the satellite record, which lags by a month or two. If that is the case, then won't the currently warm pacific show up more in the sat temps for the rest of the year?
In context, I have in mind that the cool sub surface waters in the pacific seem to point to this potential el nino dissipating before it really gets going.
Complain about this comment (Comment number 27)
Comment number 28.
At 12:55 10th Sep 2012, greensand wrote:@ 25. ukphonta
Many thanks, yes that was the paper RB directed me to, I need to go away and read again.
I have had a look back at our previous discussions with RB and I am convinced that the MO carry out annual updates of the Decadal Forecast including the "hindcasts"
So far I have seen 3 Decadal Forecast charts:-
"2007" from the paper
"2009" - https://www.metoffice.gov.uk/research/climate/seasonal-to-decadal/decadal-prediction
"2011" - https://www.metoffice.gov.uk/research/climate/seasonal-to-decadal/long-range/decadal-fc
All three show the white line peaking in 2012 but the value appears to change. By copying the charts into Excel and applying a grid I get the following anomaly (1971 - 2000) very approximate values:-
"2007" - +0.55
"2009" - +0.60
"2011" - +0.67
All very unscientific! I would appreciate if somebodyelse could take a look. At present I don't think any of the 3 show the original 2005 forecast?
Complain about this comment (Comment number 28)
Comment number 29.
At 14:25 10th Sep 2012, ukpahonta wrote:Greensand,
I would tend to agree, and not just for the 2005-2015 forecast.
All three forecasts for their entirety seem to have been shifted up roughly half a degree between 2007 and 2009 and 2011.
For the 1985-1995 forecast, end temps
2007 0.225C
2009 0.275C
2011 0.325C
For the 1995-2005 forecast, end temps
2007 0.325C
2009 0.375C
2011 0.425C
Don't quote me on the above figures, just by eyeballing, how strange!
Complain about this comment (Comment number 29)
Comment number 30.
At 15:17 10th Sep 2012, ukpahonta wrote:'half a degree' should be 0.05 degree, obviously.(duh)
Complain about this comment (Comment number 30)
Comment number 31.
At 15:20 10th Sep 2012, greensand wrote:ukpahonta
"Don't quote me on the above figures, just by eyeballing, how strange!"
I won't! My observations carry the same caveat!
One possibility is that the hindcasts are re-run with each annual update of the Decadal Forecast? That is why I do not think any of the charts show the original/initial 2005 forecast.
However I am far from sure that I am interpreting the charts correctly because if the following are correct, the forecasts look like being a long way off the mark!
"2007" - +0.55
"2009" - +0.60
"2011" - +0.67
To equate those (1971 -2000) anomalies to HadCRUT3 (1961 - 1990) you have to add approx +0.12?
Therefore those 3 Decadal Forecasts for the rolling 12 months ending in 2012 show a range between +0.67C and +0.79C? Which is a long way off the present HadCRUT3 (only 7 months) average of approx +0.36C - see QV in No 8 above.
I can't help thinking that I am missing something?
Complain about this comment (Comment number 31)
Comment number 32.
At 20:57 10th Sep 2012, ukpahonta wrote:'the forecasts look like being a long way off the mark'
Just as I have been saying, unless there is a big jump as in a super El Nino the end forecast for the model is going to be outside confidence levels.
Complain about this comment (Comment number 32)
Comment number 33.
At 22:13 10th Sep 2012, greensand wrote:"the end forecast for the model is going to be outside confidence levels."
Yup, uk you are right with regard to the "forecasts" we can see. But are any of them the actual 2005 forecast?
Complain about this comment (Comment number 33)
Comment number 34.
At 10:49 11th Sep 2012, ukpahonta wrote:https://www.metoffice.gov.uk/news/releases/archive/2012/1981-2010-averages
'Temperature shows the most marked change, with the UK annual mean temperature being 0.25 °C higher for the 1981-2010 period compared to 1971-2000, or 0.52 °C if compared to 1961-1990.'
Does that give us 0.27°C difference between 1971-2000 and 1961-1990 averages?
Mike Kendon of the Met Office National Climate Information Centre said: "At a regional level and for individual seasons we expect variability on decadal timescales, from natural cycles, to play a role. Nevertheless, the increases in UK annual mean temperature are consistent with the trend in warming observed globally over land."
Regional land figures are influenced by natural cycles but global figures aren't?
Topic up at TallBlokes:
https://tallbloke.wordpress.com/2012/09/10/met-office-1981-2010-averages-released/
Complain about this comment (Comment number 34)
Comment number 35.
At 11:26 11th Sep 2012, greensand wrote:34. ukpahonta wrote:
'Does that give us 0.27°C difference between 1971-2000 and 1961-1990 averages?
Thanks ukpahonta, I need to try and digest that!
Also in the article:-
"The UK was also a slightly sunnier place in 1981-2010 compared to 1971-2000, with 18 extra hours of sunshine annually or, looking back to 1961-1990, an extra 35 hours (about a 3% increase on the 1961-1990 period)."
Correlation is not causation
Sunshine:-
https://www.metoffice.gov.uk/climate/uk/actualmonthly/17/Sunshine/UK.gif
Mean Temp:-
https://www.metoffice.gov.uk/climate/uk/actualmonthly/17/Tmean/UK.gif
Correlation is not causation, more sun, warmer?
Complain about this comment (Comment number 35)
Comment number 36.
At 13:01 11th Sep 2012, ukpahonta wrote:Greensand
https://research.metoffice.gov.uk/research/nwp/publications/mosac/MOSAC_15.4_CGordon.pdf
Slide 16 references Smith et al 2007 but also includes forecasts from 2008 and 2009. Better graph all round, haven't checked against those other sources as yet.
Complain about this comment (Comment number 36)
Comment number 37.
At 13:30 11th Sep 2012, ukpahonta wrote:Greensand
I still think that Smith et al 2007 is the original decadal forecast but now we have forecasts from 2008,2009 and 2011.
Slide 16 certainly gives the impression that the 2015 point is the target for the models to achieve!
Complain about this comment (Comment number 37)
Comment number 38.
At 15:26 11th Sep 2012, greensand wrote:Thanks again ukpahonta
Slide 16 adds to the info. Just had a quick look and the "2005" forecast for 2012 appears to be approx +0.60C, the same as the "2009" chart. Which makes sense.
I agree, the Smith et al 2007 chart probably contains the original 2005 forecast.
If my fag packet calcs are right the final rolling 12 month observation in 2014 has to be in the order of +0.67C HadCRUT3 (1961-1990), the same number as forecast for 2012 which as you have pointed out is not going to happen! Whether it will by the end of 2014 only time will tell.
And yes there appears to be a predicted meeting of the worms in 2015!
Complain about this comment (Comment number 38)
Comment number 39.
At 17:00 11th Sep 2012, greensand wrote:ukpahonta
Latest ENSO Wrap Up posted today, reflects your previous comments re the predicted onset of El Nino conditions:-
"Climate models surveyed by the Bureau of Meteorology suggest sea surface temperatures in the tropical Pacific Ocean will maintain values close to El Niño thresholds before returning to more neutral values towards the end of 2012 or early 2013. "
https://www.bom.gov.au/climate/enso/
"Borderline El Niño conditions continue"
"* Most models included in this summary are likely to be updated within the next fortnight."
https://www.bom.gov.au/climate/ahead/ENSO-summary.shtml
Summary
Complain about this comment (Comment number 39)
Comment number 40.
At 22:29 11th Sep 2012, ukpahonta wrote:Which may indicate that the La Nina conditions since the 2010 El Nino have not absorbed enough solar energy into the ocean in order to fuel another El Nino. Perhaps another La Nina may do it, leading the trend for a period of greater negative ENSO than positive.
Complain about this comment (Comment number 40)
Comment number 41.
At 14:44 12th Sep 2012, QuaesoVeritas wrote:RSS figures are a bit late this month!
Complain about this comment (Comment number 41)
Comment number 42.
At 15:50 12th Sep 2012, ukpahonta wrote:Record Breaking La Nina events 2010-2012?????
https://www.bom.gov.au/climate/enso/history/ln-2010-12/?ref=ad
Complain about this comment (Comment number 42)
Comment number 43.
At 16:13 12th Sep 2012, newdwr54 wrote:38. greensand wrote:
"If my fag packet calcs are right the final rolling 12 month observation in 2014 has to be in the order of +0.67C HadCRUT3 (1961-1990), the same number as forecast for 2012 which as you have pointed out is not going to happen! Whether it will by the end of 2014 only time will tell."
The graph on slide 16 appears to show error bands with a lower value of +0.40C at end 2012 for both the 2008 and 2009 projections. HadCRUT3 is currently (to end July) at +0.37 C.
With 5 months' values still to come, it's touch and go, but certainly not impossible that +0.4 C will be achieved by HadCRUT3 in 2012. If it is, then technically the projection is not wrong, just running at the lower end of the error margins.
Complain about this comment (Comment number 43)
Comment number 44.
At 17:02 12th Sep 2012, QuaesoVeritas wrote:#43. - newdwr54 wrote:
"With 5 months' values still to come, it's touch and go, but certainly not impossible that +0.4 C will be achieved by HadCRUT3 in 2012. If it is, then technically the projection is not wrong, just running at the lower end of the error margins."
I am sure that the 2012 mean will end up above 0.4c and therefore within the error bands. I notice you say "not wrong", rather than "correct". This would only be correct in the same way as IPCC temperature projections are correct when temperatures are in the lower part of the error bands.
Complain about this comment (Comment number 44)
Comment number 45.
At 17:21 12th Sep 2012, newdwr54 wrote:44. QuaesoVeritas wrote:
"I notice you say "not wrong", rather than "correct"."
If you mean by "correct" that values must be spot on the mean of the projections then I suppose that's true. However they remain 'accurate' if they are within the error margins.
For instance, the IPCC sea ice projections are both 'wrong' and 'inaccurate' (shown here to 2009, and considerably more 'wrong' to date): https://www.skepticalscience.com/pics/IceFreeArctic.jpg
Whereas IPCC sea level projections are 'wrong' but still (just about) accurate (again shown here ending 2009,but still at the very high end of the projection values): https://www.skepticalscience.com/graphics/slr_prediction.jpg
These are two IPCC anomalies that are seldom discussed, for some reason?
BTW I just noticed that the graph we're referring to (slide 16 in the MO presentation) has an anomaly reference of 1971-2000, which probably means the projections are likely to be both 'wrong' and 'inaccurate', but I haven't time to work it out today.
Complain about this comment (Comment number 45)
Comment number 46.
At 17:25 12th Sep 2012, greensand wrote:43. newdwr54 wrote:
"The graph on slide 16 appears to show error bands with a lower value of +0.40C"
Quite right DW, but that is +0.40C "Temperature Difference (degC) Relative to 1971-2000". To make it relative to HadCRUT3 (1961-1990) you need to add +0.12C so the error band lower value is approx +0.52C.
So whilst I agree "certainly not impossible that +0.4 C will be achieved by HadCRUT3 in 2012". It will definitely be very interesting if it finds another 30% on top of +0.4C in the next 5 months.
Complain about this comment (Comment number 46)
Comment number 47.
At 18:32 12th Sep 2012, greensand wrote:45. newdwr54 wrote:
"BTW I just noticed that the graph we're referring to (slide 16 in the MO presentation) has an anomaly reference of 1971-2000,"
Posts crossed, I see you have now got the 1971-2000.
Complain about this comment (Comment number 47)
Comment number 48.
At 19:15 12th Sep 2012, Nicola Howe wrote:I would also be very interested to see the first UKMO Decadal Forecast 2005 to 2015 - can anyone provide a link to this please? [Unsuitable/Broken URL removed by Moderator]
Complain about this comment (Comment number 48)
Comment number 49.
At 19:42 12th Sep 2012, ukpahonta wrote:Car_Hire,
Direct link is:
https://www.sciencemag.org/content/317/5839/796.full
You will need to register to see the full paper, abstract is free.
An available description of the paper, with graph, is here:
https://rsta.royalsocietypublishing.org/content/367/1890/925.full
Section 2
The Smith et al 2007 paper uses an anomaly reference of 1979-2001 just to complicate matters.
Complain about this comment (Comment number 49)
Comment number 50.
At 19:46 12th Sep 2012, ukpahonta wrote:Sorry, Car_Hire you have morphed into Nicola Howe.
Complain about this comment (Comment number 50)
Comment number 51.
At 21:04 12th Sep 2012, greensand wrote:Sorry, I think it is down to me that this "first" Decadal Forecast has become known as 2005 to 2015 it should be 2005 to 2014.
Complain about this comment (Comment number 51)
Comment number 52.
At 10:15 14th Sep 2012, ukpahonta wrote:Noteworthy for location:
https://news.sky.com/story/984887/thousands-flee-as-guatemalan-volcano-erupts
Complain about this comment (Comment number 52)
Comment number 53.
At 11:13 14th Sep 2012, QuaesoVeritas wrote:The UKMO is claiming that new research is providing improved "guidance" for "long-range" forecasting of winters.
https://www.metoffice.gov.uk/news/releases/archive/2012/improved-winter-guidance
However, this claim seems to be based on the fact that it retrospectively predicted the conditions in 2009/10 more accurately than the previous forecasts.
When will they learn that "hind-casting" is not a reliable guide to how well a model will predict the future?
Complain about this comment (Comment number 53)
Comment number 54.
At 12:53 14th Sep 2012, john_cogger wrote:Arctic ice hasn't bottomed out yet, still dropping but the minimum must be close?
Complain about this comment (Comment number 54)
Comment number 55.
At 13:21 14th Sep 2012, ukpahonta wrote:QV
But they are learning about natural variability:
'Of course, factors other than El Nino also play a role in driving European winter climate, including Atlantic SST [9], volcanic eruptions [33], snow cover [14] and
solar forcing [34, 35]. In particular, the anomalous snow cover and solar minimum in 2009/10 may have contributed to the observed conditions.'
https://iopscience.iop.org/1748-9326/7/3/034031/pdf/1748-9326_7_3_034031.pdf
Complain about this comment (Comment number 55)
Comment number 56.
At 17:45 14th Sep 2012, QuaesoVeritas wrote:ukpahonta,
Thanks for the link, I will read it when I get the chance.
I am slightly surprised that they mention the solar minimum.
Complain about this comment (Comment number 56)
Comment number 57.
At 18:23 14th Sep 2012, Boanta wrote:'The phase relation between atmospheric carbon dioxide and global temperature' , published in 'Global and Planetary Change' by O.Humlum, Kjell Stordahl and Jan Erik Solheim.( 5th September)
This is suggesting that CO2 follows temperature even on short time scales. Thoughts and comments?
Complain about this comment (Comment number 57)