
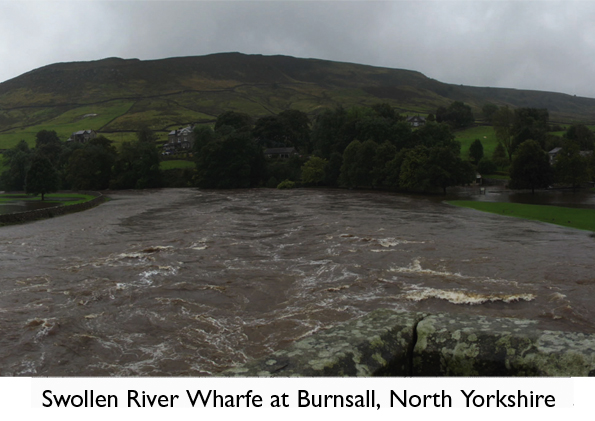
All eyes on York after worst September storm since 1981
The deepest area of low pressure in September since 1981 has caused many of Yorkshire's rivers to burst their banks - although the rain was not quite intense enough to cause serious flooding of property like in the autumn of 2000.
Cumulatively since the rain started falling on Sunday evening, to when it stopped during the early hours of this morning, Ravensthorpe in Richmondshire has had the highest rainfall in the country with 131mm (over 5 inches).
At Leeming, 100mm (4 inches) of rain has been recorded in the same time period. This is almost double what would normally be expected in the whole of September (Average 52mm).
Furthermore, the station recorded its wettest September day, with 76mm falling in the 24hours to 10am on Tuesday morning. Weather data has been collected at the RAF station since 1945.
All eyes are now on the River Ouse catchment, whose tributaries are the Rivers Derwent, Aire, Don, Wharfe, Rother, Nidd, Swale, Ure and Foss, all of which have been high in the last 24 hours.
The Environment agency currently has 2112 properties on flood warning along the length of the Ouse catchment.
Current forecasts suggest the river will peak at midnight in York at no higher than 4.7 metres above normal. It is currently flowing at 4.5 metres above normal.
This would be higher than the peak in January 2008 of 4.5 metres above normal, but quite a bit lower than the record which was set in November 2000 of 5.4 metres above normal.
It will give comfort to the residents of York that during that record breaking river level, the main flood defences, including the Foss barrier, held.
Follow me on twitter @Hudsonweather
 Hello, I’m Paul Hudson, weather presenter and climate correspondent for BBC Look North in Yorkshire and Lincolnshire. I've been interested in the weather and climate for as long as I can remember, and worked as a forecaster with the Met Office for more than ten years locally and at the international unit before joining the BBC in October 2007. Here I divide my time between forecasting and reporting on stories about climate change and its implications for people's everyday lives.
Comment number 1.
At 16:31 26th Sep 2012, E Gouthwaite wrote:The amount of rainfall has probably had an impact on the tourist economy this summer many events had reduced capacity all summer. October race event could do with some sunshine at the knavesmire
Complain about this comment (Comment number 1)
Comment number 2.
At 19:44 26th Sep 2012, QuaesoVeritas wrote:The daily England & Wales rainfall on September 19th, 1981, was 25.04 mm, but I am not sure if that was related to the previous deepest area of low pressure mentioned above. There were four other days with over 10mm of rain but none of them were contiguous, either with the 19th or other day of over 10mm, so it must have been quite a stormy month.
Sorry the figure of 43.23mm which I quoted in the previous thread, was actually on the 25th of August 1986, not September.
Complain about this comment (Comment number 2)
Comment number 3.
At 23:28 26th Sep 2012, jkiller56 wrote:Yet another freakish low bringing monumental rain. The most intense in Sept. since 1981. Not that long ago so nothing very unusual - I feel sure many sceptics will say.
Maybe - if seen in isolation. But rather more unsettling in the context of exceptional rainfall and a long sequence of unusually disturbed weather starting in April. And this itself following on from an exceptional prolonged dry period. Don't forget the record heat/drought simultaneously occuring in America and elsewhere as well of course.
Sceptics are hoping and trying to convince us that it must be caused (in some yet to be explained way) by the sun. Perhaps it is.
On the other hand - what a coincidence it seems to be happening in line with warnings about man made climate change - imperfect models or not.
Complain about this comment (Comment number 3)
Comment number 4.
At 08:14 27th Sep 2012, ukpahonta wrote:Comparing one year to multi decadel warnings is probably unwise!
'In the future plants in the UK will be affected by climate change in a number of ways:
Increased carbon dioxide levels will increase rates of plant growth and perhaps development (bud burst, flowering and leaf fall)
Changes in temperatures are expected to bring an earlier onset of growth in spring and a longer growing season
Mild winters may reduce the yield of fruit trees, because colder temperatures are needed to break the buds
Increased temperatures will aid the growth of more plants from warmer parts of the world
Higher temperatures and decreased summer rainfall will cause stress, especially in plants with extensive, shallow, fibrous root systems
Annual moisture content of soils is likely to decrease by 10-20% across the UK by the 2080s, with substantial reductions (of 20-50%) in soil moisture possible in the summer by the 2080s
Fungal diseases will thrive with the wet winter conditions.'
https://www.metoffice.gov.uk/climate-change/guide/impacts/horticulture
Complain about this comment (Comment number 4)
Comment number 5.
At 09:36 27th Sep 2012, QuaesoVeritas wrote:#3. - jkiller56 wrote:
"But rather more unsettling in the context of exceptional rainfall and a long sequence of unusually disturbed weather starting in April. And this itself following on from an exceptional prolonged dry period. Don't forget the record heat/drought simultaneously occuring in America and elsewhere as well of course."
Whatever happened to "It's weather, not climate"! Oh, I'm sorry, that only applies when the weather appears to contradict "climate change" theory.
"On the other hand - what a coincidence it seems to be happening in line with warnings about man made climate change - imperfect models or not."
Yes, coincidence. Confirmation bias pure and simple.
It is true that we appear to be going through a period of more "extreme" weather, but that is only part of the natural variability in weather. This only seems "extreme", compared to 20-50 years ago, which is as long as most people's memories go back. Rainfall was probably equally "extreme" in the 1920's and 1870's as it is now. The highest annual rainfall on record in Engalnd & Wales was 1285mm in 1872 and extreme rainfall is correlated with high annual rainfall.
It is true that heavy rainfall is having more effect now but that is mainly due to increased areas of conurbation and the effect that has on drainage. There is more flooding, due to greater roof space, and more land covered in tarmac and concrete, which causes faster run-off into rivers and drainage systems. Large parts of the areas affected by recent flooding, didn't exist 50 years ago. There are simply MORE PEOPLE now to be affected by flooding.
I agree that it would be easy to be seduced by recent weather into believing that it is something abnormal, if you are ignorant of past weather patterns.
Some extracts from Whitaker's Almanac of 1897, referring to September 1896:
"The weather was EXCESSIVELY wet and overcast. Sunshine was UNPRECEDENTLY deficient. Cyclonic storms passed over the kingdom rapidly, without SCARCELY ANY INTERMISSION, between the 22nd and the 27th, but with very DESTRUCTIVE VIOLENCE." There are also reports of rainfall figures of over 1 inch (25mm), in a number of locations during the month. And 1896 was actually in the middle of a period of relatively LOW annual rainfall - actually one of the lowest 10 year averages in the HadUKP series, so things would have been worse in the 1870's. The only reason I quote from this edition of WA, is that it is the oldest I have.
Complain about this comment (Comment number 5)
Comment number 6.
At 09:41 27th Sep 2012, QuaesoVeritas wrote:#4. ukpahonta wrote:
"Comparing one year to multi decadel warnings is probably unwise!"
Of course, the official MO prediction was that "climate change" would cause lower summer rainfall and higher rainfall in the winter. Yet recently we had a "drought" caused by LOW winter rainfall, which was ended by HIGH summer rainfall.
Of course to the biased, the fact that the MO predictions were WRONG is actually evidence of "climate chaos", not the incompetence of the MO.
As the proponents of "climate change" used to keep telling us, "weather is NOT climate".
Complain about this comment (Comment number 6)
Comment number 7.
At 10:40 27th Sep 2012, lateintheday wrote:jkiller - easy mistake to make, I'll sort it for you.
The consensus are hoping and trying to convince us that it must be caused (in some yet to be explained way) by CO2. Perhaps it is.
Complain about this comment (Comment number 7)
Comment number 8.
At 11:19 27th Sep 2012, lateintheday wrote:QV (and other data watcher/gatherers)
Saw this yesterday. It may be 'old news' to you, but just in case you didn't already know . . .
Randall Hoven posts: I knew NASA would occasionally update its estimates, even its historical estimates. I found that unsettling when I first heard about it. But I thought such re-estimates were rare, and transparent. There is absolutely no transparency here. If I had not kept a copy of the data taken off NASA’s web site two months ago, I would not have known it had changed.
https://wattsupwiththat.com/2012/09/26/nasa-giss-caught-changing-past-data-again-violates-data-quality-act/
Steven Mosher explained: Nasa does not change the data of the past. GISSTEMP is a computer program that estimates the global “average “temperature of the past and present. It relies on inputs made available by other sources, GHCN, and SCAR. There are ongoing projects to improve the coverage and quality of the incoming data sources. that means the input data can and will change on a monthly basis. Since the past is an estimate made relative to a 1951-1980 baseline period changes can and will ripple through the system. To put it simply. we don’t know the temperature of the past. We estimate it based on the data that is available. When that data changes, the estimate will change.
Complain about this comment (Comment number 8)
Comment number 9.
At 12:39 27th Sep 2012, Adrian Buckland wrote:The issue of concern is why did this low pressure just come up from the south wander over us and then do an about turn and head south again. In September 1981 the low probably headed off to Shetland and beyond. Hence the complete disparity in rainfall figures. Yes there was a kink in the jet stream for the umpteenth time this year. But why? I heard Paul Hudson on Radio Leeds expressing his concern that there does seem to be something wrong. Well we know the Arctic has about half the summer ice cover it had a mere 33 years ago so it is not functioning the same way. Think of the rotating tank experiment and the Rossby waves. You need a cold pole to make this work. I strongly suggest that greenhouse gas emissions have compromised the Arctic's ability to function in that way.
Complain about this comment (Comment number 9)
Comment number 10.
At 13:09 27th Sep 2012, newdwr54 wrote:9. Adrian Buckland wrote:
"I strongly suggest that greenhouse gas emissions have compromised the Arctic's ability to function in that way."
Arctic sea ice has set a new 'daily minimum extent' record every single day for the past 50 days, and has been below the previous record minimum extent level (set in 2007) for the past 34 consecutive days: https://www.ijis.iarc.uaf.edu/en/home/seaice_extent.htm
It's looking probable that Arctic sea ice extent will stay below the level of the 2007 extent minimum right through September 2012. Since the end of the melt season on 16th September, Arctic temperatures have been well above average, as they were throughout much of last winter.
The theory you allude to above, and previously discussed by Paul Hudson, is that the reduced temperature differential between Arctic and mid latitude air mass has caused the jetsream to slow and become more wayward. If this theory is right, then we may see some pretty bizarre and sustained weather across the Northern Hemisphere throughout the winter.
Complain about this comment (Comment number 10)
Comment number 11.
At 13:17 27th Sep 2012, newdwr54 wrote:5. QuaesoVeritas wrote:
"Yes, coincidence. Confirmation bias pure and simple."
When you consider the Arctic sea ice melt, continued ice sheet melt in Greenland and Antarctica, rising sea levels, increasing ocean heat content and record high land and coastal water temperatures across the US... etc.
These coincidences are stacking up a bit, are they not?
Complain about this comment (Comment number 11)
Comment number 12.
At 17:55 27th Sep 2012, QuaesoVeritas wrote:#11. - newdwr54 wrote:
"These coincidences are stacking up a bit, are they not?"
How many coincidences does there have to be before they are not coincidences?
Complain about this comment (Comment number 12)
Comment number 13.
At 17:58 27th Sep 2012, QuaesoVeritas wrote:#10. - newdwr54 wrote:
"If this theory is right, then we may see some pretty bizarre and sustained weather across the Northern Hemisphere throughout the winter."
I agree that there will be "sustained weather" this winter.
What is your definition of "bizarre weather"?
Complain about this comment (Comment number 13)
Comment number 14.
At 17:59 27th Sep 2012, quake wrote:Re 8: Steven Mosher's explanation is correct.
It is striking that it takes one of the commenters to set the record straight. Shouldn't the blog owner, Anthony Watts, be the one educating his readers about how surface temperature records? Especially considering that's his area of interest.
Instead we see him permitting an ignorance based attack to be hosted on his blog which wrongly attacks the science and scientists working on producing surface temperature records and spreads misinformation about them to the public.
But perhaps that was the idea?
Complain about this comment (Comment number 14)
Comment number 15.
At 18:03 27th Sep 2012, QuaesoVeritas wrote:#9. - Adrian Buckland wrote:
"The issue of concern is why did this low pressure just come up from the south wander over us and then do an about turn and head south again. "
I wonder why you think that such a thing needs an explanation.
This is just the random movement of areas of different pressure in the atmosphere.
No particular explanation is necessary.
Complain about this comment (Comment number 15)
Comment number 16.
At 18:03 27th Sep 2012, quake wrote:Re 11.
I need more data to draw any conclusions. Fortunately (for this purpose) the arctic sea ice minimum will probably get even lower in coming years. I eagerly await to see what will happen *popcorn*, especially if it does reach zero.
Complain about this comment (Comment number 16)
Comment number 17.
At 19:32 27th Sep 2012, QuaesoVeritas wrote:#10. - newdwr54 wrote:
"It's looking probable that Arctic sea ice extent will stay below the level of the 2007 extent minimum right through September 2012."
Would you like to have a little "notional" bet on that?
I think it might just creep above in October, possibly temporarily.
Complain about this comment (Comment number 17)
Comment number 18.
At 20:38 27th Sep 2012, Boanta wrote:11: is not Antarctic sea ice at record or near record extent?
Complain about this comment (Comment number 18)
Comment number 19.
At 20:39 27th Sep 2012, greensand wrote:@ 14 Quake
"Re 8: Steven Mosher's explanation is correct."
Really?
"To put it simply. we don’t know the temperature of the past."
Really?
Complain about this comment (Comment number 19)
Comment number 20.
At 01:07 28th Sep 2012, quake wrote:19: I hope that's a joke and you haven't quotemined that sentence out of context.
Complain about this comment (Comment number 20)
Comment number 21.
At 07:14 28th Sep 2012, PingoSan wrote:So in the warmists' world, the Antarctic is "melting".
And yet the facts state it is near record high extent.
Here are the official data - https://arctic.atmos.uiuc.edu/cryosphere/timeseries.south.anom.1979-2008
I'll let you follow the money on this one!
Complain about this comment (Comment number 21)
Comment number 22.
At 07:21 28th Sep 2012, PingoSan wrote:And didn't the warmists go round a few years ago telling us to expect hotter and drier summers? The data about the unfortunate truth is here.
https://www.metoffice.gov.uk/hadobs/hadcet/
(Take a snapshot before it gets edited out of existence).
Complain about this comment (Comment number 22)
Comment number 23.
At 07:54 28th Sep 2012, Boanta wrote:21 Pingosan: Thanks for these links which answer my ? at 18. I see there has been record snow in parts of Brazil ( the analogy being made is like having record snow in Florida in March). Wonder if the MSM will report it?
Complain about this comment (Comment number 23)
Comment number 24.
At 08:57 28th Sep 2012, quake wrote:The Antarctic IS melting.
https://ess.uci.edu/researchgrp/velicogna/files/slide2.jpg
Complain about this comment (Comment number 24)
Comment number 25.
At 09:05 28th Sep 2012, quake wrote:22: That graph shows warming in the past 30 years to be unprecedented in that record! Never before had temperature risen up above previous levels, it had always bounced around within a fixed envelope.
Brazil snow....did the MSM report on the record breaking heatwave that hit Brazil recently? I can't remember it doing so.
"On Sunday (16), the temperature reached 38.6 º C in winter in Santa Rosa, Northwest gaucho. In the second (17), the municipality of Antonina, Parana, was 42.1 º C, according to the Simepar. There is no precedent of a temperature as high weather station in the south of Brazil in the winter. Even for summer record is not as high in the southern part of the country between the data of the National Institute of Meteorology and regional centers."
https://www.accuweather.com/en/weather-blogs/weathermatrix/brazil-goes-from-108-f-to-snow-in-three-days/79545
Complain about this comment (Comment number 25)
Comment number 26.
At 10:30 28th Sep 2012, lateintheday wrote:"an ignorance based attack"
Not sure I would agree with that totally Quake. I think there is a general perception that the main temperature set providers announce revisions. They certainly do if it's a major overhaul.
I'm not suggesting that there is anything underhand in the Gisstemp product, it is what it is. I just wondered if those who regularly refer to, or personally calculate trends on this blog were aware of the monthly changes and the resulting ripple effect. As you probably know, I don't do this personally (not competent). Those who calculate long term or rolling trends, may find their results are affected as much by these monthly changes, as the latest monthly data. Those trend changes are commonly in the hundredths/thousandths.
I'm used to reading QV and newdwr54 trade numbers when the latest monthly data comes in and I'm sure others do the same. It would be a shame if, like Hoven, their efforts were undermined by not knowing how Gisstemp works.
Complain about this comment (Comment number 26)
Comment number 27.
At 10:57 28th Sep 2012, lateintheday wrote:Quake @24 - did you know about this?
The ICEsat measurements show different results to GRACE for Antarctica. Results presented in the SCAR ISMASS Workshop on July 14, 2012 and added to NASA’s Technical Reports September 7th, 2012.
Mass Gains of the Antarctic Ice Sheet Exceed Losses
Zwally, H. Jay; Li, Jun; Robbins, John; Saba, Jack L.; Yi, Donghui; Brenner, Anita; Bromwich, David
Abstract:
During 2003 to 2008, the mass gain of the Antarctic ice sheet from snow accumulation exceeded the mass loss from ice discharge by 49 Gt/yr (2.5% of input), as derived from ICESat laser measurements of elevation change. The net gain (86 Gt/yr) over the West Antarctic (WA) and East Antarctic ice sheets (WA and EA) is essentially unchanged from revised results for 1992 to 2001 from ERS radar altimetry.
I'll leave it to you to judge the relative merits of individual studies, but would point out that Zwally is hardly a sceptic.
Complain about this comment (Comment number 27)
Comment number 28.
At 11:03 28th Sep 2012, lateintheday wrote:And connected to post 26, I read the other day (can't remember where) somebody suggesting that Paul Hudson's infamous post 'whatever happened to global warming' should be retracted since the data now shows it to be incorrect. This is because in certain data set revisions made after his post, 1998 was nudged off top spot and was no longer considered the warmest year.
It struck me that if the same reasoning was applied to climate science papers in general, just about everything ever published would need revisiting. For example, I presume all proxy reconstructions are in some way linked or verified by the temperature record as stood at the time of the original analysis. Correlations and regression stats would all require recalculating would they not? Conclusions modified opr re-drafted?
Perhaps Mosher's "we don't know the temperature of the past" has a wider ripple effect.
Complain about this comment (Comment number 28)
Comment number 29.
At 13:23 28th Sep 2012, QuaesoVeritas wrote:#24. - quake wrote:
"The Antarctic IS melting."
Is that relative to 2008?
Those figures only go back to 2002.
I suspect that global ice has been melting off and on since the last ice age, which as I have said before, saw ice several miles thick over Britain.
Complain about this comment (Comment number 29)
Comment number 30.
At 13:46 28th Sep 2012, newdwr54 wrote:26. lateintheday:
Re the monthly data; thanks, I was aware that it jumps around from month to month. NOAA data has always done this and all the other data sets, including satellite, frequently amend monthly values. I always download the complete set of data from each provider every month. Changes rarely affect the overall trend, though in NOAA, 2005 and 2010 interchange from time to time as the warmest year on record.
Complain about this comment (Comment number 30)
Comment number 31.
At 13:50 28th Sep 2012, QuaesoVeritas wrote:#30. - newdwr54 wrote:
"Changes rarely affect the overall trend, though in NOAA, 2005 and 2010 interchange from time to time as the warmest year on record."
How can this not change the overall trend?
https://www.climate4you.com/images/NCDC%20MaturityDiagramSince20080517.gif
Complain about this comment (Comment number 31)
Comment number 32.
At 13:53 28th Sep 2012, QuaesoVeritas wrote:A quote from the Climate4You website:
"Before 1945 global temperatures are generally changed toward lower values, and toward higher values after 1945, resulting in a more pronounced 20th century warming (about 0.15oC) compared to the NCDC temperature record published in May 2008. Last diagram update: 17 September 2012."
Complain about this comment (Comment number 32)
Comment number 33.
At 14:54 28th Sep 2012, newdwr54 wrote:31. QuaesoVeritas:
As far as I know NCDC/NOAA have explain their adjustment methods in the peer reviewed literature.
I think a lot of the changes arose from discrepancies caused by times of observation; something that Anthony Watts and co forgot to take into account in their recent unpublished paper.
Complain about this comment (Comment number 33)
Comment number 34.
At 15:10 28th Sep 2012, QuaesoVeritas wrote:#33. - newdwr54 wrote:
"As far as I know NCDC/NOAA have explain their adjustment methods in the peer reviewed literature."
That isn't really the point.
Do you accept that these adjustments have affected the overall trends?
Complain about this comment (Comment number 34)
Comment number 35.
At 15:42 28th Sep 2012, newdwr54 wrote:34. QuaesoVeritas wrote:
"Do you accept that these adjustments have affected the overall trends?"
In an almost imperceptible and therefore insignificant way, yes. I obtained the May 2008 NCDC data from Humlum's site and ran it alongside the current data. I'm sure you're more than capable of doing the same; so you can correct me if I'm wrong here.
I found that the total trend in the May 2008 data (1880 - Apr 2008) to be +0.05C per decade warming. The trend in the current data using the same dates is +0.06C per decade warming. So the difference between the recently adjusted data and the previous data amounts to an extra 1/100th of a degree C warming per decade between 1880 and 2008.
The average upward adjustment was +0.04C per month; and the average downward adjustment was -0.05C per month.
So I don't think these changes, all of which have been justified in peer review anyway, have influenced the NCDC trend in any significant way.
Complain about this comment (Comment number 35)
Comment number 36.
At 16:14 28th Sep 2012, greensand wrote:20. quake wrote:
"19: I hope that's a joke and you haven't quotemined that sentence out of context."
Nope, it is not a joke and as it is a straightforward unambiguous statement it cannot be out of context.
Now do you really believe "we don’t know the temperature of the past."?
Plain simple unambiguous question.
Complain about this comment (Comment number 36)
Comment number 37.
At 17:03 28th Sep 2012, ukpahonta wrote:Greensand
Of course we know past temperatures, to a point. They correlate so well with past levels of CO2:
'CO2 background from 1826 to 2008 shows a very good correlation ( r= 0,719 using data since 1870) to global SST (Kaplan, KNMI), with a CO2 lag of 1 year behind SST from cross correlation (maximum correlation: 0,7204). Kuo et al. 1990 derived 5-month time lag from MLO data alone compared to air temperature.'
https://www.biomind.de/realCO2/realCO2-1.htm
Complain about this comment (Comment number 37)
Comment number 38.
At 18:34 28th Sep 2012, newdwr54 wrote:36. greensand wrote:
"Now do you really believe "we don’t know the temperature of the past."? Plain simple unambiguous question."
Global temperatures have always been inferred from indicators. Recently these indicators are surface-based thermometers, or microwave sensors on satellites. Both parameters have their limitations.
Previous indicators are less reliable; observational data, proxy indicators like tree rings, lake sediment deposits, or ice cores, etc.
We can't *know* past temperatures; but it's not unreasonable to say that we can use the existing evidence that is available to make realistic inferences about them, within appropriate error bands.
Complain about this comment (Comment number 38)
Comment number 39.
At 18:52 28th Sep 2012, QuaesoVeritas wrote:#35. - newdwr54 wrote:
"In an almost imperceptible and therefore insignificant way, yes. I obtained the May 2008 NCDC data from Humlum's site and ran it alongside the current data. I'm sure you're more than capable of doing the same; so you can correct me if I'm wrong here.
I found that the total trend in the May 2008 data (1880 - Apr 2008) to be +0.05C per decade warming. The trend in the current data using the same dates is +0.06C per decade warming. So the difference between the recently adjusted data and the previous data amounts to an extra 1/100th of a degree C warming per decade between 1880 and 2008."
That's the difference between the trends over the entire series, but as I am sure you will know, it takes a big change in temperatures to have an effect on such a long series. The change in the 30 year trend between the 2008 data and the current data will be much larger.
"The average upward adjustment was +0.04C per month; and the average downward adjustment was -0.05C per month."
But MOST of the upward adjustments are since 1945 and MOST of the downward adjustments are before 1945, a fact which you seem to be deliberately ignoring.
Are we to assume that most temperature measurements prior to 1945 were too high and most of those after 1945 were too low?
Complain about this comment (Comment number 39)
Comment number 40.
At 19:00 28th Sep 2012, QuaesoVeritas wrote:newdwr54,
Did you notice my comment about Arctic ice extent in #17?
Complain about this comment (Comment number 40)
Comment number 41.
At 19:16 28th Sep 2012, QuaesoVeritas wrote:The monthly HadCRUT3 anomaly figures for August are as follows:
Global = 0.508c, compared with 0.448c in July
N.H. = 0.681c, compared with 0.687c in July
S.H. = 0.335c, compared with 0.209c in July
While the overall global anomaly rose more or less in line with UAH and NASA/GISS, the N.H. fall was virtually zero, unlike all of the other temperature anomalies, while the increase in S.H. anomaly was similar to that in the NCDC/NOAA anomaly.
As a result of this figure, the simple rolling average for 2012 is now 0.388c. compared to 0.371 in July. The annual figure (using their method) in the MO data files is 0.379c but I am not sure if that is up to date.
Based on the current AQUA CH5 temperature figures, HadCRUT3 will probably stay about the same or fall slightly in September.
Complain about this comment (Comment number 41)
Comment number 42.
At 19:46 28th Sep 2012, newdwr54 wrote:41. QV
Thanks for that QV. That makes August 2012 the 6th warmest August in the HadCRUT3 record (since 1850) and the warmest since 2009.
It also makes 2012 the 5th warmest 'summer' (meaning boreal met. summer, Jun-Aug) globally since 1850.
Even though every month since April 2012 has been inside the top ten warmest respectively on record, 2012 is still only the 11th warmest 'year to date' since 1850, according to HadCRUT3.
I expect that position to rise over the last 4 months of 2012. As you say, September 2012 in AMSU ch.5 is above average; probably it's going to be the second warmest in that series.
So I'd expect HadCRUT3 to be around 0.5, +/- 0.05.
Complain about this comment (Comment number 42)
Comment number 43.
At 20:02 28th Sep 2012, newdwr54 wrote:40. QuaesoVeritas wrote:
"Did you notice my comment about Arctic ice extent in #17?"
I didn't actually notice that QV. But now that you have drawn it to my attention, the bet is on!
As you say, it's just a 'notional bet'. But let's clarify the terms:
My propositions is, as quoted by you:
"...Arctic sea ice extent will stay below the level of the 2007 extent minimum right through September 2012."
I was referring to Japanese JAXA extent data, which is regarded as a fairly neutral and reliable source. So I think we should keep that as the source for the bet?
Payout is as follows: If I'm wrong, I post an acknowledgement on this blog's comment pages. And vice versa.
Are you on?
Complain about this comment (Comment number 43)
Comment number 44.
At 20:04 28th Sep 2012, quake wrote:Re 27: No I hadn't heard of that, thanks I'll take a look at it. It maybe that Antarctic is gaining mass after-all.
Complain about this comment (Comment number 44)
Comment number 45.
At 20:22 28th Sep 2012, quake wrote:If the remaining four month average 0.4C comes out at 0.39C
If they average 0.5C then the year will come out about 0.43C
And if the average 0.6C the year will come out about 0.46C
I think a return to 0.4C, or an increase to 0.6C are both extremely unlikely. So 2012 is likely to fall somewhere around the middle of 0.39C and 0.46C.
Complain about this comment (Comment number 45)
Comment number 46.
At 20:32 28th Sep 2012, newdwr54 wrote:39. QuaesoVeritas wrote:
"...it takes a big change in temperatures to have an effect on such a long series. The change in the 30 year trend between the 2008 data and the current data will be much larger."
And,
"... MOST of the upward adjustments are since 1945 and MOST of the downward adjustments are before 1945, a fact which you seem to be deliberately ignoring."
Fair points. I'm not deliberately ignoring them; I overlooked them. It occurred to me after I posted, and I was intending to post back to clarify this.
Yes, if most of the upward adjustments occurred later in the series, and most of the downward adjustments occurred earlier, then probably that would have a greater impact on the shape of the trend-line than a simple overall trend would suggest.
Give me a day or two to work this out and I'll post an honest response. (I'm away this weekend on family business.)
"Are we to assume that most temperature measurements prior to 1945 were too high and most of those after 1945 were too low?"
No 'assumptions' are necessary QV. The reasons for the adjustments were subjected to peer review and they passed. As I mentioned before, daily 'time of observation' plays a major role in the downward adjustment of earlier temperature station data in the NCDC series.
I don't, currently, know why the later ones were adjusted upward. However, I don't therefore automatically assume that some skulduggery is afoot.
Complain about this comment (Comment number 46)
Comment number 47.
At 20:36 28th Sep 2012, QuaesoVeritas wrote:#43. - newdwr54 wrote:
"I was referring to Japanese JAXA extent data, which is regarded as a fairly neutral and reliable source. So I think we should keep that as the source for the bet?"
Yes, that is what I was referring to as well.
"Are you on?"
Yes, as long as there is no money involved!
Complain about this comment (Comment number 47)
Comment number 48.
At 20:41 28th Sep 2012, QuaesoVeritas wrote:#46. - newdwr54 wrote:
"Give me a day or two to work this out and I'll post an honest response. (I'm away this weekend on family business.)"
No need to rush, I might have a go at it myself if I get the chance.
"I don't, currently, know why the later ones were adjusted upward. However, I don't therefore automatically assume that some skulduggery is afoot."
I don't think it's deliberate skulduggery either, but I don't rule out inintentional bias.
Complain about this comment (Comment number 48)
Comment number 49.
At 20:42 28th Sep 2012, newdwr54 wrote:47. QuaesoVeritas:
Then let us prepare to rumble!
(As long as there is no money involved, I concur.)
Complain about this comment (Comment number 49)
Comment number 50.
At 00:20 29th Sep 2012, PingoSan wrote:This thread, and its comments, I find utterly bizarre. Here we are with a regional disaster and many people having their homes destroyed are talking about fractions of a degree Celsius and "preparing to rumble".
I apologise if I care more about those flooded, and why it has happened (the quiet sun, over-concreting, flood-plain building).
Complain about this comment (Comment number 50)
Comment number 51.
At 00:54 29th Sep 2012, greensand wrote:38. newdwr54 wrote:
"We can't *know* past temperatures"
Really?
How, without knowing the actual recorded past temperatures, can we know that they need to be adjusted?
@ 50 PingoSan
"I apologise if I care more about those flooded.."
I agree, especially with the elements that are well within our ability to control "over-concreting, flood-plain building" simple comprehensible indisputable physics.
Complain about this comment (Comment number 51)
Comment number 52.
At 01:07 29th Sep 2012, PingoSan wrote:"How, without knowing the actual recorded past temperatures, can we know that they need to be adjusted?"
The 1860 temperatures were adjusted down by the authorities (NASA GISS) just 8 days ago. If anyone trusts them, you have to wonder why.
Complain about this comment (Comment number 52)
Comment number 53.
At 01:35 29th Sep 2012, greensand wrote:@ 52 PingoSan
I have been asked on many occasions what sort of world I want to leave to my grand children.
Answer: - One complete with a pure and simple unadulterated database upon which they can base their own decisions.
It is not our remit to "interpret" it for them. It is our job to ensure its integrity, an issue that is starting to give real cause for concern.
Complain about this comment (Comment number 53)
Comment number 54.
At 12:21 29th Sep 2012, QuaesoVeritas wrote:#50. - PingoSan wrote:
"I apologise if I care more about those flooded, and why it has happened (the quiet sun, over-concreting, flood-plain building)."
Surely a desire to understand the *real* causes of this flooding doesn't preclude a concern and sympathy for those who are suffering?
How does simple "care" for those who are flooded help?
However, if we are to prevent the worst effects of such flooding in the future, we have to understand the causes.
If the believers in "climate change" are correct, then all we have to do is reduce global temperatures and miraculously all bad weather, including floods will disappear overnight.
On the same basis, there isn't much we can do about a "quiet sun".
On the other hand, if such flooding is part of a natural process, made worse by other factors, such as building on flood plains and over-concreting, then no matter what we do to eliminate "climate change", by reducing greenhouse gasses, will make very little difference.
Of course, none of these issues will be solved by discussions on this blog, but we are here to express our opinions.
Complain about this comment (Comment number 54)
Comment number 55.
At 23:00 29th Sep 2012, Adrian Buckland wrote:I'm sorry QV I really do have to take issue with you. As a rule surface low pressures are guided by the jet stream above with development at entrances and exits. If they do an about turn there usually is a block. So for example in the winter of 1979 there were several occasions when low pressure developed in France moved northwards and came up across high pressure that stretched from Greenland to Scandinavia (coming up against very cold air). The fronts ground to a halt over the North of england and we got 4 or 5 notable blizzards that winter.
For a low to behave as last week's where it seemed to move north and return lazily of its own accord for no obvious reason is pretty unusual although admittedly not unknown. I've played this game with you before when discussing the November 2009 Cumbria rainfall. Now let's suppose the Arctic ice was 8 million km2 rather than 3.4 (i pinch myself when I write that figure). I put it to you with the stronger thermal contrast and stronger jet stream the low pressure would have pushed through say in 12 hours and moved on towards Scandinavia (classical low pressure behaviour). End result 1-2 inches of rain and maybe some strong winds as in Sep 81. Not saying categorically that would have happened but more than likely. Perhaps somebody at the MO could use the initial conditions say at 00Z 22nd 2012 and substitute land/sea temperature and ice cover data from say 60 N from 00Z 22nd Sep 1981and run models forward. Dont know if it would work but it might be interesting.
Complain about this comment (Comment number 55)
Comment number 56.
At 11:38 30th Sep 2012, John Marshall wrote:According to Philip Eden, writing in the ST, there was a deeper depression last year with a SL pressure of 970mb the latest storm was 973mb. It dropped just over 10 ins of rain. Last years storm hit Scotland not Northern England.
So it would seem that we get severe storms most years and this latest is not unprecedented.
Complain about this comment (Comment number 56)
Comment number 57.
At 17:37 30th Sep 2012, ukpahonta wrote:Greensand, and others.
You'll like this, informative and worth keeping an eye on I think:
https://forum.netweather.tv/topic/74587-stratosphere-temperature-watch-20122013/
Complain about this comment (Comment number 57)
Comment number 58.
At 20:04 30th Sep 2012, jkiller56 wrote:Qv#5
Wouldn't for a minute suggest that recent weather was "unprecedented" nor that it was "climate" rather than "weather". But it does continue a recent sustained run of somewhat exceptional weather over the last decade which just seems to go from one record or near record to another. (remember the heat this time last year?).
All I am saying is that it is in line with global warming predictions that extremes are to be expected with increased frequency and coincidentally enough this does seem to be happening at the moment. This view might well be influenced by subjectivity but, equally, your viewpoint - that it is just "variation" - may be just as biased and is your own interpretation.
I am sure you are right to some extent about there being more people around to be affected by floods. But then again, flood control is much better now than ever before. Heaven knows what would come to pass if we still had 19th cent flood defences. So I think it may be a bit of both.
Whittacker's Almanac of 1897 is of interest - but I note from my sources that the late 19th cent was somewhat colder generally than today (why?) - notably cold in fact even compared to the mid 19th cent. -which partly contributed to the agricultural depression at the time and imports of food from N America and elsewhere, rather than increasingly unreliable yields at home.
Another problem of course with regard to long past weather is that it increasingly depends on subjective description and unequal comparison. Old weather records are fascinating and useful but... Gilbert White,(18th cent.) for example remarks how exceptional he regarded a temperature of 84f (29c). This would not be seen as exceptional today - but his verbal descriptions of the unbearable heat would make one think it far hotter than it seems to have been.
Complain about this comment (Comment number 58)
Comment number 59.
At 21:05 30th Sep 2012, QuaesoVeritas wrote:#58. - jkiller56 wrote:
"I am sure you are right to some extent about there being more people around to be affected by floods. But then again, flood control is much better now than ever before. Heaven knows what would come to pass if we still had 19th cent flood defences. So I think it may be a bit of both."
Maybe we wouldn't need improved flood control, if we weren't building on flood plains and covering the ground elsewhere with concrete and buildings, which prevent the rain from draining natururally and divert it more quickly into the drains and rivers. Of course there is probably no way of proving this, without spending a lot of money on computer simulations.
Complain about this comment (Comment number 59)
Comment number 60.
At 21:43 30th Sep 2012, ukpahonta wrote:'the late 19th cent was somewhat colder generally than today'
In the Northern Hemisphere, down under it was a time of drought and heat waves.
"A heat wave in the nation's southern regions of Australia, from December 1895 to January 1896, killed 437 people and injured about 5,000. At Bourke, western New South Wales alone, it lasted 13 days and killed 47 people. The daily maximum temperature averaged 116.6° F (47° C). There was a great heat wave in New South Wales, Australia. In January 1896, the temperature averaged 112° F (44.4° C), which caused 35 deaths. Then on 22 January, the temperature rose to 125° F (51.7° C) resulting in 10 additional deaths. On 3 January 1896, the high temperature in Perth, Australia reached 112° F (44.4° C). During the summer of 1895-96, there were 11 days when the temperature was 100.0° F or greater.
On 26 December 1897, there was a heat wave in Victoria and New South Wales, Australia, where the temperature measured in the shade averaged 107° F (41.7° C). In Adelaide, Australia, on 1 January 1900, the temperature reached 112.2° F (44.6° C)."
From A Chronological Listing of Early Weather Events
James A. Marusek
Also Famines in India:
https://en.wikipedia.org/wiki/Indian_famine_of_1896%E2%80%9397
Perhaps a huge El Nino could have contributed:
https://en.wikipedia.org/w/index.php?title=File:Soi.svg&page=1
Data source:
https://www.bom.gov.au/climate/current/soihtm1.shtml
Look at the figures for 1896 compared to 1998!
Complain about this comment (Comment number 60)
Comment number 61.
At 00:24 1st Oct 2012, greensand wrote:"The most intense storm for 30 years? I beg to differ."
Philip Eden - Sunday Telegraph - 30th Sept 2012
"a deeper low crossed Scotland on Sept 12th last year"
"Another deep depression affected most parts of Britain between Sept 27th and 29th, 1991"
Philip Eden is a past vice president of the Royal Meteorological Society.
Weather is just weather, to weather people.
Complain about this comment (Comment number 61)
Comment number 62.
At 15:09 1st Oct 2012, QuaesoVeritas wrote:With two days of AQUA CH5 data to come, my current estimate for the September USH anomaly is between 0.4c and 0.48c, compared with last month's 0.34c.
The latter figure is based on the fact that UAH has been running higher than it should theoretically, based on CH5 and past year's UAH figures.
Based entirely on the 2011 figures, this year's anomaly would be 0.42c, which after adjustment to 1961-90, would be equivalent to 0.673c.
Strangely, the estimated Hadcrut3 anomaly based entirely on AQUA CH5, would be only 0.41c, compared with last month's 0.508c, but that seems unlikely.
Complain about this comment (Comment number 62)
Comment number 63.
At 15:12 1st Oct 2012, QuaesoVeritas wrote:In the second line above, "USH" should read "UAH".
Complain about this comment (Comment number 63)
Comment number 64.
At 16:41 1st Oct 2012, newdwr54 wrote:60. ukpahonta wrote:
"'During the summer of 1895-96, there were 11 days when the temperature was 100.0° F or greater..."
Sobering to reflect that according to NASA the austral summer of 1895-96 was actually -0.12c 'below' the 1951-1980 average, and that there hasn't been a sub-zero DJF in the SH since 1976.
For the 30 years 1881-1910 mean temperature in the SH was -0.28c below average; whereas the 30 years 1981-2010 mean temps were +0.29c above average.
https://data.giss.nasa.gov/gistemp/tabledata_v3/SH.Ts+dSST.txt
Complain about this comment (Comment number 64)
Comment number 65.
At 16:53 1st Oct 2012, QuaesoVeritas wrote:greensand,
Philip Eden seems to have access do data not available to the general public, since as far as I can tell, the MO don't publish daily pressure data, equivalent to say HadUKP daily rainfall.
I have had it confirmed by the MO that the 1981 storm was on September 19th/20th, which coincided with 25.04mm of rain on the 19th (over England & Wales), but only 3.08mm on the 18th and 1.44mm on the 20th, although there was 10.13mm on the 17th.
In the case of 1991, there was 10.01mm on the 26th, the day before the storm, 5.75mm on the 27th, 20.83mm on the 28th and 2.18mm on the 29th.
So both the 1981 and 1991 storms seem to have produced similar amounts of rain, with in each case, a relatively high rainfall 2 days before the peak day.
It will be interesting to see how this September's storm compares in terms of rainfall figures.
Complain about this comment (Comment number 65)
Comment number 66.
At 20:24 1st Oct 2012, ukpahonta wrote:#64 nwdwr54
'Sobering to reflect that according to NASA the austral summer of 1895-96 was actually -0.12c 'below' the 1951-1980 average, and that there hasn't been a sub-zero DJF in the SH since 1976.'
Yes, it does make you wonder if the adjustments to data are in fact beneficial to the quality.
Complain about this comment (Comment number 66)
Comment number 67.
At 14:21 2nd Oct 2012, newdwr54 wrote:According to the IJIS, every single day in September 2012 set a new daily record minimum Arctic sea ice extent; the ice also remained below the previous record extent minimum set in 2007 throughout September. 2012 beat the previous minimum extent record by 0.77 million km2. As of October 1st, Arctic sea ice is still over 0.11 million km2 below the 2007 extent minimum: https://www.ijis.iarc.uaf.edu/en/home/seaice_extent.htm
Antarctic sea ice also set a new extent record this year, maximum, of course. It beat the previous maximum set in 2006 by nearly 0.1 million km2, and the ice remained above its previous record extent for six days near the end of September. This fact is impressive, but some commentators have used it to suggest that Antarctic gains somehow offset Arctic losses. They don't.
By area, this year's Antarctic record amounted to about a 5% gain on the 1979-2008 average maximum. The Arctic record amounted to a 50% loss on the average minimum. In terms of actual global sea ice area, the Antarctic maximum was +0.8 million km2 above the 1979-2008 average maximum; while the Arctic was -2.4 million km2 below the average minimum.
Since 1979 Antarctic sea ice area has grown at a rate of about +0.2 million km2 per decade. Over the same period, Arctic sea ice area has diminished at a rate of -0.6 million km2 per decade. Net global sea ice area has therefore diminished by -0.4 million km2 per decade since 1979. The Antarctic sea ice has some catching up to do if it's going to balance the loses seen in the Arctic.
Complain about this comment (Comment number 67)
Comment number 68.
At 14:28 2nd Oct 2012, John Marshall wrote:#61 I think I wrote that #56
It is now confirmed that Antarctic sea ice has passed previous records for coverage by at least 1m sq Km. Much of this ice is north of the Antarctic circle so in the warming sun but not yet melting.
Philip Eden probably does have access to meteorological information not available easily to others. He does have a pretty well balanced view of the UK weather and its ever changing aspects.
Complain about this comment (Comment number 68)
Comment number 69.
At 16:22 2nd Oct 2012, lateintheday wrote:newdwr54 . .
Why should it balance the losses? What possible benefit/difference would that make?
If you're looking at global albedo changes and its effect on the radiation budget then you can't sensibly use percentages since clearly, a 50% increase in antarctic ice would be a huge area - many times the size of 50% of the arctic. You'll have to stick to km2.
Then, I suggest that in order to investigate the albedo change, you'd have to use a yearly average based on discrete monthly averages. That is, the albedo change in some months have zero effect because there is no sunlight to speak of. All in all, quite a complex calculation and that's before you allow for the increased ocean OLR from previously ice covered areas. Then it would be useful to compare your final figure against, or quantify as part of, total global albedo including cloud cover etc.
You're going to need a lot of coffee!
Complain about this comment (Comment number 69)
Comment number 70.
At 20:32 2nd Oct 2012, newdwr54 wrote:68. John Marshall wrote:
"It is now confirmed that Antarctic sea ice has passed previous records for coverage by at least 1m sq Km."
Can you post a link lease? According to NSIDC daily extent data, Antarctic sea ice passed the previous record extent by a maximum of 95,000 km2. In terms of 'area', this year's Antarctic maximum did *not* in fact break the previous record, which was set on 20th September 2007, according to NSIDC: https://arctic.atmos.uiuc.edu/cryosphere/timeseries.south.anom.1979-2008
Both the extent and area records of Arctic sea ice fell in August 2012 and have remained below the previous record extent and area minimums ever since.
Complain about this comment (Comment number 70)
Comment number 71.
At 20:48 2nd Oct 2012, newdwr54 wrote:69. lateintheday wrote:
"Why should it balance the losses?"
I didn't say that it should; I pointed out that some commentators were pretending that it had.
"If you're looking at global albedo changes and its effect on the radiation budget then you can't sensibly use percentages since clearly, a 50% increase in antarctic ice would be a huge area - many times the size of 50% of the arctic. You'll have to stick to km2."
I agree; which is why a went to the trouble of calculating and posting the *actual* sea ice areas in km2 @67 above. I copy and paste from there:
_________________
"In terms of actual global sea ice area, the Antarctic maximum was +0.8 million km2 above the 1979-2008 average maximum; while the Arctic was -2.4 million km2 below the average minimum.
Since 1979 Antarctic sea ice area has grown at a rate of about +0.2 million km2 per decade. Over the same period, Arctic sea ice area has diminished at a rate of -0.6 million km2 per decade. Net global sea ice area has therefore diminished by -0.4 million km2 per decade since 1979."
_________________
"Then, I suggest that in order to investigate the albedo change, you'd have to use a yearly average based on discrete monthly averages."
I'm not making any claims about albedo change; I'm just posting the relevant polar extent and area values. Do you dispute these?
"You're going to need a lot of coffee!"
I have fine house blend. Even so, I think all the questions you've asked have already been addressed.
Complain about this comment (Comment number 71)
Comment number 72.
At 09:39 3rd Oct 2012, lateintheday wrote:apologies then newdwr54. I thought you were implying some wider significance to the sea ice trends. (perish the thought)
I do have one related question however (open to all). If Zwally's recent study (net mass gain) is correct, then presumably the contribution to sea level rise from the antarctic region is a negative number. So for discussion sake, if that contribution was previously estimated at say +0.5mm, the shortfall would be 0.5mm plus the negative figure (again, let's say 0.1mm).
Whatever the generally accepted numbers are, it's a possible mis-attribution which needs accounting for somewhere else. Any ideas?
Complain about this comment (Comment number 72)
Comment number 73.
At 14:59 3rd Oct 2012, John Marshall wrote:#70
Keep in touch, view wattsupwiththat and look at the ice records in the drop down box in the heading.
Even cryospheretoday shows a record ice area. Overall total global sea ice coverage is fairly constant so there has been no increase in the overall heat content of the planet.
Complain about this comment (Comment number 73)
Comment number 74.
At 17:27 3rd Oct 2012, greensand wrote:Met Office
"Provisional figures for September"
"The provisional figures for the whole of September are in and, overall, the UK received 112.4mm of rain which is 117% of the long-term average. The wettest period of the month fell between the 23rd and 26th but with a very dry start to the month, the UK ended up 29th wettest in the national record that goes back to 1910.
The UK was also a little sunnier than usual, with 144.2 hours of sunshine, making it the 10th sunniest September on record. Meanwhile, the average temperature was 11.9°C which is 0.7°C below the 30-year average."
https://metofficenews.wordpress.com/2012/10/02/provisional-figures-for-september/
Complain about this comment (Comment number 74)
Comment number 75.
At 18:55 3rd Oct 2012, QuaesoVeritas wrote:greensand,
Actually, it makes a change for the MO to be publishing provisional figures AFTER the end of the month in question. Recently there has been a tendency to publish before the end of the month. Also, in the form of a blog, rather than a news release.
For all of the talk of heavy rainfall, the monthly figures for the UK as a whole, or even individual regions, aren't anything special, obviously due to the dry early part of the month.
What will be interesting are the daily rainfall figures, to see how they compare with the previous figures on those occasions when there were similar low pressure patterns.
Complain about this comment (Comment number 75)
Comment number 76.
At 19:22 3rd Oct 2012, greensand wrote:QV
Stumbled upon whilst looking for something else. Interesting to see sunshine hours up and temps down.
Complain about this comment (Comment number 76)
Comment number 77.
At 19:42 3rd Oct 2012, QuaesoVeritas wrote:More bad news on sea-level rise.
Apparently, even if we adopt the "most accepted" IPCC emissions scenario, there is nothing we can do to prevent sea level rising by 22 feet by the year 3000!
https://www.examiner.com/article/new-research-states-no-hope-preventing-sea-level-rise
Complain about this comment (Comment number 77)