
Will we see the Northern Lights again tonight?
The Northern Lights, or Aurora Borealis, featured prominently across the skies of Northern Britain last night. The fabulous photograph below, taken at the Tan Hill Inn in North Yorkshire, is courtesy of North news and pictures.
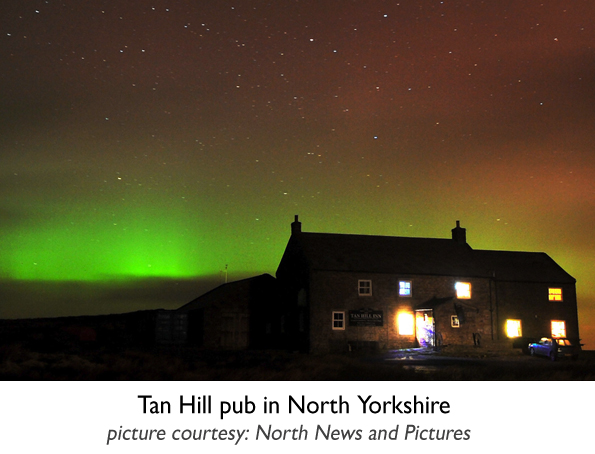
Auroras are caused by charged particles such as electrons and protons originating from the sun, known as the solar wind. They are directed by the earth's magnetic field into our atmosphere and then collide with atoms such as oxygen and nitrogen.
These atoms, having absorbed the energy from the collision, become excited; they then emit this energy which is seen by us as different coloured lights.
It's exactly the same process when a neon light glows when charged with electricity.
A pale green is the most common Northern Light, caused by the charged particles colliding with oxygen atoms.
Normally, most charged particles are directed no further south than 20 degrees from the North (or South) Pole, but during high solar activity, or a 'solar storm', auroras can be seen much further south.
It's not the first time we've seen Northern Lights recently, and it's all part and parcel of the general increase in solar activity in the last few months. This follows a prolonged period of very low solar activity in the last few years.
Experts believe there is a chance to see the Northern Lights again tonight by looking towards the northern horizon. Skies will be clear for much of the night, too.
 Hello, I’m Paul Hudson, weather presenter and climate correspondent for BBC Look North in Yorkshire and Lincolnshire. I've been interested in the weather and climate for as long as I can remember, and worked as a forecaster with the Met Office for more than ten years locally and at the international unit before joining the BBC in October 2007. Here I divide my time between forecasting and reporting on stories about climate change and its implications for people's everyday lives.
Page 1 of 2
Comment number 1.
At 20:06 23rd Jan 2012, arbaber wrote:I saw your item regarding northern lights and this led me to your blog. Until today I understood that such phenomena was not visible in the UK further South than Liverpool but your reference to extreme solar activity has given me hope that what I saw as a child in Plymouth between the years 1942 and 1945 was not a figment of my imagination or a dream.
I was brought up in Plymouth and our attic bedroom window looked South and directly onto Plymouth Sound. I cannot recall why I looked out the window perhaps the sky looked unusual from my bed. I remember the sky towards the East was full of different colours. I think I was between the age of 8 and 10 and was supposed to be asleep - this explains why I did not draw the attention of an adult to witness the phenomena, to have done so would almost certainly have resulted in another good hiding . There was definitely no air raid warning so it was not a war event.
I wonder if you have access to records of solar activity around that time?
Alternatively could you please point me in the direction of how I could do the research myself.
Complain about this comment (Comment number 1)
Comment number 2.
At 20:17 23rd Jan 2012, john_cogger wrote:Tonight not looking too likely unless you are in the north end of Scotland but there was more solar action today so we might get another storm tomorrow/Wednesday.
Complain about this comment (Comment number 2)
Comment number 3.
At 20:45 23rd Jan 2012, David801 wrote:hi my daughter and i was hoping to see the northern lights tonight and was wondering were the best place to see them would be and at what time (we live in Doncaster) could anybody recomend any time/places ?
Complain about this comment (Comment number 3)
Comment number 4.
At 21:52 23rd Jan 2012, john_cogger wrote:@3 David801
Don't think you wll see any tonight. Activity is measured in a unit called KP's, it goes from 0 - 9, with 9 being a massive storm. We are currently at about 1. To see northern lights in Scotland it needs to be 5+, Midlands 7+ and the South 8-9.
https://aurorawatch.lancs.ac.uk/ has another measurement, plus they send out email alerts.
https://spaceweather.com/ gives good news.
Tomorrow could be good but they are hard to predict! Twitter is a good way of keeping track of things.
https://earthsky.org/space/strongest-solar-radiation-storm-in-7-years-expected-january-24
Complain about this comment (Comment number 4)
Comment number 5.
At 07:52 24th Jan 2012, MangoChutney wrote:@Paul Hudson
Apologies for being off topic, but what do you make of this?
https://wattsupwiththat.com/2012/01/22/forecastthefacts-org-political-activists-gagging-our-tv-meteorologists-on-climate-issues/
Complain about this comment (Comment number 5)
Comment number 6.
At 11:40 24th Jan 2012, trish wrote:as i am in oldham are we on the wrong side of the pennines to see any of the current northern light activity
Complain about this comment (Comment number 6)
Comment number 7.
At 12:12 24th Jan 2012, lateintheday wrote:Mangochutney
very oppressive tactic in my opinion - doesn't smell good does it.
Complain about this comment (Comment number 7)
Comment number 8.
At 16:45 24th Jan 2012, MangoChutney wrote:@latenitheday
gagging always makes me sick
Complain about this comment (Comment number 8)
Comment number 9.
At 16:48 24th Jan 2012, MangoChutney wrote:and it really does make you wonder who feeds RB with this sort of stuff:
https://twitter.com/
Complain about this comment (Comment number 9)
Comment number 10.
At 16:57 24th Jan 2012, john_cogger wrote:@6 Trish
It's more about how north you are rather than an east/west thing.
Needs to be a good storm to be seen in Oldham, plus clear skies and going on top of the moors would help!
Complain about this comment (Comment number 10)
Comment number 11.
At 18:26 24th Jan 2012, jkiller56 wrote:Missed it!
Looked last night, but no definite sign, and high cloud started to move in by midnight.
I have seen the aurora in UK 3 or4 times before however - usually fairly weakly.
However in the mid 1980's- saw a fantastic display when travelling late on the M6.
Became aware of a glow in the sky, so stopped at a services. The whole sky was filled with an eerie greenish "curtain" which seemed suspended from a single central point and appeared almost menacingly yet gloriously, to be decending towards the ground. It faded after about an hour or so.
To mangochutney and lateintheday above : Do you believe everything you read? - Yes if it confirms your own convictions?
Do yourselves a big favour - be less intellectually supine and stop behaving like Pavlov's dogs every time a bit of groundless sceptic whinging pops up. This conspiracy thing really is the last resort of the desperate. Surely you must realise this by now?
And, yes, it is off topic.
Complain about this comment (Comment number 11)
Comment number 12.
At 19:43 24th Jan 2012, MangoChutney wrote:@jkiller56
And perhaps if you actually read the article and followed the links to the website of the idiots actually trying to force the AMS into this nonsense, you would learn something about the company you keep.
"“This is an important moment in the history of the AMS,” said Daniel Souweine, the campaign’s director. “It’s well known that large numbers of meteorologists are climate change deniers. It’s essential that the AMS Council resist pressure from these deniers and pass the strong statement currently under consideration.”"
See the petition:
"The new AMS statement on climate change echoes the widespread scientific consensus that climate change is increasingly impacting our planet. I urge the AMS Council to pass this new statement immediately and vigorously promote it to AMS members."
Complain about this comment (Comment number 12)
Comment number 13.
At 20:48 24th Jan 2012, QuaesoVeritas wrote:#1. - arbaber wrote:
"I was brought up in Plymouth and our attic bedroom window looked South and directly onto Plymouth Sound. I cannot recall why I looked out the window perhaps the sky looked unusual from my bed. I remember the sky towards the East was full of different colours. I think I was between the age of 8 and 10 and was supposed to be asleep - this explains why I did not draw the attention of an adult to witness the phenomena, to have done so would almost certainly have resulted in another good hiding . There was definitely no air raid warning so it was not a war event."
I am afraid that the period between 1942 and 1945 coincides with a sunspot minimum, so it seems very unlikely that what you saw was the Aurora, especially if you were looking in a Southerly/Easterly direction from Plymouth.
Since the direction you were looking in was either towards London or France, I think the most likely explanation is that what you saw was war related.
Complain about this comment (Comment number 13)
Comment number 14.
At 21:05 24th Jan 2012, lateintheday wrote:that's twice in row jkiller - you're off my xmas card list.
Intellectual arrogance really is a waste of neurons.
Complain about this comment (Comment number 14)
Comment number 15.
At 21:07 24th Jan 2012, Wobiroy wrote:Can anyone tell me the best time to look out for northern lights? Sorry if this is a stupid question :-/
Complain about this comment (Comment number 15)
Comment number 16.
At 21:51 24th Jan 2012, MangoChutney wrote:@15
when the sun's not shining
(sorry, couldn't resist)
Complain about this comment (Comment number 16)
Comment number 17.
At 22:08 24th Jan 2012, Wobiroy wrote:Lol mangochutney! Even I knew that!!
Complain about this comment (Comment number 17)
Comment number 18.
At 08:00 25th Jan 2012, LabMunkey wrote:No idea if you can see them as far south as i am, but low-level cloud precluded any possibility of me seeing them last night.
How longs the storm meant to last? is there a 'window' when we can expect to see the lights? Or in other words, if it's clear tonight is it worth staying up ;-)
Complain about this comment (Comment number 18)
Comment number 19.
At 11:25 25th Jan 2012, ukpahonta wrote:Hemispheric and large-scale land surface air temperature variations: An extensive revision and an update to 2010. (CRUTEM4)
https://www.agu.org/pubs/crossref/pip/2011JD017139.shtml
It would be interesting to see the full paper
Complain about this comment (Comment number 19)
Comment number 20.
At 14:43 25th Jan 2012, QuaesoVeritas wrote:greensand,
I posted this in the previous blog topic, but you may not have seen it and anyway that topic will probably be closed soon.
Have you seen the latest AQUA CH5 temperature?
The figure for January 22nd was 251.787k, the 4th low record in a row, which brings the cumulative temp. for January to 252.045k.
The average for January 2011 was 252.1k, which produced a UAH of about zero, but in order to achieve that this month, there would have to be an average daily increase of 0.09 degrees for the remainder of the month. A more "reasonable" increase from now on, of 0.02 degrees per day, would produce a final AQUA temp. of 252.0k, which is only 0.05 degrees above the figure for January 2008, which produced a UAH of -0.3c, although a more likely figure would be about -0.15c. A daily increase of 0.01 degrees would produce a final AQUA equivalent to a UAH of -0.17c and no rise or fall in AQUA for the remainder of the month would produce a likely UAH of -0.18c.
Obviously there isn't a 100% correlation between the AQUA temp. and UAH, but I still think it is likely that the January UAH will be well below zero this month.
I haven't worked out what will happen if AQUA continues to fall at the present rate, since that would be impossible, I think!
Complain about this comment (Comment number 20)
Comment number 21.
At 14:48 25th Jan 2012, QuaesoVeritas wrote:#19. - ukpahonta wrote:
"Hemispheric and large-scale land surface air temperature variations: An extensive revision and an update to 2010. (CRUTEM4)"
I wonder when the data from this series, HadSST3 and HadCRUT4 will replace the current series.
It will be interesting to see how the trends compare, as 1998 has been "cooled", but at the same time, it should remove some of the criticisms of HadCRUT3.
I think that temperatures will be falling anyway, no matter which series is used, and they can't put off the inevitable for ever.
Complain about this comment (Comment number 21)
Comment number 22.
At 15:15 25th Jan 2012, greensand wrote:@20. QuaesoVeritas wrote:
"greensand,
I posted this in the previous blog topic,"
Hi QV, yes got it on the old topic and replied there, interesting times!
Complain about this comment (Comment number 22)
Comment number 23.
At 16:05 25th Jan 2012, ukpahonta wrote:#21 QV
Only a matter of time now.
Complain about this comment (Comment number 23)
Comment number 24.
At 16:48 25th Jan 2012, QuaesoVeritas wrote:#22. - greensand wrote:
"Hi QV, yes got it on the old topic and replied there, interesting times!"
Thanks, will reply here to avoid the over 100 posts problem.
Thanks for the links to the Reynolds SST data. I haven't encountered this
before but I am not sure if I can handle any more data sources!
SST rising but from a relatively low position.
I have received an e-mail reply from the MO regarding their decadal and 2012 forecasts. I haven't had a chance to look at it in detail yet but they seem to be saying that the forecast for 2012 is the figure for 2012.00, i.e. 0.396c, but when you add 0.12c to that, it works out at 0.512c relative to 1961-90, not 0.48c. However, they also say that the 2012 forecast is "a combination of this forecast made using the dynamical model and another one made using a purely statistical approach."
I think that by "this forecast", they mean the decadal forecast. So it sounds like they don't entirely trust the dynamical model results themselves and have adjusted them using the "statistical approach".
Complain about this comment (Comment number 24)
Comment number 25.
At 17:53 25th Jan 2012, greensand wrote:@24. QuaesoVeritas wrote:
“not sure if I can handle any more data sources!”
I know what you mean; I will watch it for a while.
Re the MO Decadal I have had another look at the numbers you posted and they fit well with the "thick blue curve" on the MO Decadal forecast?
You posted numbers for 2011.67 to 2013.00 each month shows an increase, with gradual changes in the rate of change, consistent with being derived from a rising12mth rolling forecast?
PS I am fairly convinced that 2011.67 is Sept 2011, similar used at WfT.
I have started a comparison chart to see how a 12mth rolling Hadcrut3 would look starting with Oct 10 to Sept 11 which is +0.382C against the numbers the MO gave you:-
ens_ave +0.12 HadCRUT3
2011.67 0.345 0.465 0.382
2011.75 0.354 0.470 0.396
2011.83 0.366 0.475 0.404
The logic comes from the MO statement:-
“The most recent forecast (thick blue curve with thin blue curves showing range) starts from September 2011. All data are rolling annual mean values.”
Gridding the chart shows that it starts last quarter 2011 i.e. Sept and that the initial value is approx +0.35C.
I recognise that this could all be a load of nonsense but I will keep it going. I am trying to get a “print” to follow and compare with the MO chart. This something that it should be possible to do, especially if they have provided the data used to form the chart.
Complain about this comment (Comment number 25)
Comment number 26.
At 18:02 25th Jan 2012, jkiller56 wrote:to lateintheday and mangochutney (above)
Well, I am genuinely sorry to be a bit blunt (yes, really); but honestly this "we are being silenced" thing is getting to be a bit worn out.
I don't believe there is a general "gagging order" on sceptic views, any more than there is one on Flat Earth views. Its just that the world has moved on now, so that unless many sceptic views are filtered out or ignored - they just get under everyone's feet and get in the way of serious discussion.
I would doubt if this is done out of malice, and certainly not to supress the "truth". Its just that so much sceptic stuff has been discredited (repeatedly) that you would no more include a climate sceptic "angle" in a climate discussion, than you would a "creationist" in a scientific discussion of evolution, or an "Earth - Centric" view of the Universe in an Astronomy lecture.
All climate sceptics need to do to convince the world they are right is to commit their ideas and theories to the scientific forum. If proved strong - opinion will change. Bear in mind that GW itself was a tiny minority and much doubted theory itself not very long ago.
Of course, I realise that as "conspiracy theorists" you would never accept this to be true. But that is my point - conspiracy is the last resort of those who have no real argument or evidence. And it is too easy (even lazy) to hide behind this and convince yourself - "we are right really, but because we are being gagged - everyone else is being deluded." Worse, it also allows such views as you do have to remain untested.
I'm afraid the truth is - its because they've heard it all before - and moved on.
Complain about this comment (Comment number 26)
Comment number 27.
At 18:18 25th Jan 2012, adriamobil wrote:I really wanted to see this, but unfortunately we were out of the country on business.
Complain about this comment (Comment number 27)
Comment number 28.
At 18:34 25th Jan 2012, ukpahonta wrote:Hahaha,
I now understand the meaning of behind the curve and linear thinking.
Complain about this comment (Comment number 28)
Comment number 29.
At 19:39 25th Jan 2012, jw196722 wrote:If you love the sky, stars and its wonders, beat light pollution and sign the petition to reduce it https://epetitions.direct.gov.uk/petitions/27603
Complain about this comment (Comment number 29)
Comment number 30.
At 20:28 25th Jan 2012, QuaesoVeritas wrote:The December HadCRUT3 figures have now been published:
Global = 0.252c, compared to a revised 0.258c for November
N.H. = 0.403c, compared to a revised 0.309c for November
S.H. = 0.100c, compared to a revised 0.206c for November
Actually, the above turn out to be much closer to my estimates based on HadSST2 than I had expected, although the global and N.H. figures were much closer and the S.H. less close than I had expected.
The figure for 2011 in the annual data file appears to have been changed to 0.346c, although I am not 100% certain that this is the final figure.
Complain about this comment (Comment number 30)
Comment number 31.
At 20:45 25th Jan 2012, QuaesoVeritas wrote:#29. - jw196722 wrote:
"If you love the sky, stars and its wonders, beat light pollution and sign the petition to reduce it"
I have signed the e-petition, although I don't hold out much hope of it ever achieving anything.
It is an absolute disgrace that we have to go to the extent of creating a petition to achieve what should be our right.
Unfortunately the modern world has become addicted to bright lights, even when they serve no useful purpose.
It is ironic, since this would be a simple way of reducing public expenditure, and CO2 emissions, assuming the Government was serious in doing so.
However, the Government is too interested in the economic growth which results from consuming ever increasing amounts of electricity.
Complain about this comment (Comment number 31)
Comment number 32.
At 21:09 25th Jan 2012, QuaesoVeritas wrote:As a result of the latest HadCRUT3 monthly figure, the 10 year linear trend has gone from -0.085c/decade to -0.099c/decade.
This makes it the fastest downward trend over a 10 year period since May 1969, although I am aware that this is probably not statistically significant!
Complain about this comment (Comment number 32)
Comment number 33.
At 21:52 25th Jan 2012, greensand wrote:@30. & 32. QuaesoVeritas
QV, thanks for the HadCRUT3 numbers, UAH down again but only just, must be about to bottom out?
Complain about this comment (Comment number 33)
Comment number 34.
At 06:55 26th Jan 2012, MangoChutney wrote:@26 jkiller56
I'm going to ignore your nonsense and instead ask a simple question:
What is the theory and null hypothesis for AGW?
Complain about this comment (Comment number 34)
Comment number 35.
At 09:09 26th Jan 2012, QuaesoVeritas wrote:#33. - greensand wrote:
"QV, thanks for the HadCRUT3 numbers, UAH down again but only just, must be about to bottom out?"
I keep thinking that, but still it goes down.
Complain about this comment (Comment number 35)
Comment number 36.
At 09:29 26th Jan 2012, QuaesoVeritas wrote:One thing is clear. This January has seen the most rapid and consistent fall in the AQUA CH5 temperature since 2003. It started much higher than 2008 and has so far fallen much lower. Of course, we don't know what happened in other la Nina events, so we don't really know how unusual this is, but it is still making me slightly suspicious of the data.
Complain about this comment (Comment number 36)
Comment number 37.
At 10:29 26th Jan 2012, greensand wrote:36. QuaesoVeritas wrote:
"Of course, we don't know what happened in other la Nina events"
That is why I have an interest in the hemispherical Land/Ocean temperature ratios. UAH is not concerned with La Nina/El Nino only with the resultant SST which it is said then transfers energy into the whole system with a lag from rising or lowering SST into the land base numbers and therefore Globe as a whole?
Might be interesting to look at the magnitude of change in HadSST and UAH ocean through both ENSO events, partly why I posted the comment from Bob Tisdale:-
"The 2010/11 La Niña was a moderate event, while the La Niña this year will be classified as a weak one. Note, however, that the Global sea surface temperature anomalies have dropped lower in response to this La Niña than the last one. That’s a curiosity."
https://bobtisdale.files.wordpress.com/2012/01/weekly-global.png
https://bobtisdale.wordpress.com/2012/01/23/mid-january-2012-sst-anomaly-update/
I wonder if the drop in "response to this La Niña" is in an accumulated effect? Looking at the above chart and checking HadSST2 there is a downward trend over the last decade?
Complain about this comment (Comment number 37)
Comment number 38.
At 10:44 26th Jan 2012, greensand wrote:@36. QuaesoVeritas wrote:
"but it is still making me slightly suspicious of the data."
Yes, you are quite right to have reservations I seem to recall Smokin Joe shouting about the rate that AMSU-A Sea Surface temperature was falling and that it was an indication of things to come.
It was, IIRC it was an indication of the system failing!
Complain about this comment (Comment number 38)
Comment number 39.
At 11:05 26th Jan 2012, lateintheday wrote:apology accepted Jkiller.
I would just say (yet again) that I don't go with the massive conspiracy theory either but this Einstein quote sums it up for me "Two things are infinite: the universe and human stupidity; and I'm not sure about the the universe."
Having trawled through a number of science blogs recently looking at the case for and against Jellbring, Nikolov etc it became apparent that very few highly qualified, highly intelligent scientists and engineers actually can understand or agree on the Physics. They all remember it of course, or know where to lay their hands on the relevant textbooks, but they don't truly understand it. It reminded me of my schooldays, when everything made sense in Maths until I was asked to independently (without any references) work out a proof for the Pythagoras Theorum. Miserable fail.
There's a big difference between what we know and what we think we know (despite our grand illusions) and as a result we ALL bow to our chosen altar and mostly accept, follow and repeat what we have been told. Now, just because we behave like sheep, that doesn't or shouldn't, allow others to force their chosen altar upon us through censorship. We all, both AGW consensus and contrarians alike, have the right to make an ass of ourselves without anyone else's unsolicited 'help'.
Finally, I don't believe for one minute that I am 'right' as you put it. It's just that I'm not convinced that they are, despite their protestations.
Complain about this comment (Comment number 39)
Comment number 40.
At 13:58 26th Jan 2012, QuaesoVeritas wrote:#25. - greensand wrote:
"Re the MO Decadal I have had another look at the numbers you posted and they fit well with the "thick blue curve" on the MO Decadal forecast?
You posted numbers for 2011.67 to 2013.00 each month shows an increase, with gradual changes in the rate of change, consistent with being derived from a rising12mth rolling forecast?
PS I am fairly convinced that 2011.67 is Sept 2011, similar used at WfT.
I have started a comparison chart to see how a 12mth rolling Hadcrut3 would look starting with Oct 10 to Sept 11 which is +0.382C against the numbers the MO gave you:-
ens_ave +0.12 HadCRUT3
2011.67 0.345 0.465 0.382
2011.75 0.354 0.470 0.396
2011.83 0.366 0.475 0.404"
I having difficulty reconciling your HadCRUT3 rolling averages with my own calculations.
For example, my figure for Oct. 10 to Sep.11 would be 0.362c, then 0.345c and 0.341c for subsequent months, i.e. going down, not up.
Are you using the standard HadCRUT3 data or some other version, e.g. HadCRUT3v?
Did you calculate the averages yourself or are they from WfT?
My apologies if I am being stupid and have missed something obvious.
Complain about this comment (Comment number 40)
Comment number 41.
At 14:18 26th Jan 2012, greensand wrote:40. QuaesoVeritas wrote:
"I having difficulty reconciling your HadCRUT3 rolling averages"
Checking back I am not surprised, combination of my bad, (transposed formula) and MO revising 2011 numbers.
Have to go will re-do numbers later.
Thanks for checking.
Complain about this comment (Comment number 41)
Comment number 42.
At 15:18 26th Jan 2012, QuaesoVeritas wrote:#41. - greensand wrote:
"Thanks for checking."
No problem.
I wasn't particularly checking your figures, just trying to get my head around what the MO say in their e-mail, in relation to what you said, of which more later.
Complain about this comment (Comment number 42)
Comment number 43.
At 16:15 26th Jan 2012, greensand wrote:42. QuaesoVeritas wrote:
"I wasn't particularly checking your figures"
No, but I am glad you did would have caused me great confusion later if not spotted.
Re-run is now closer to your numbers but not exact. Have used MO Monthly series "Data file (in this format)" to download today:-
https://www.metoffice.gov.uk/hadobs/hadcrut3/diagnostics/global/nh+sh/
Gives me the following:-
Oct – Sept = 0.363
Nov – Oct = 0.359
Dec – Nov = 0.342
Jan – Dec = 0.341
So only "real" difference is Nov - Oct, will keep looking.
Complain about this comment (Comment number 43)
Comment number 44.
At 16:54 26th Jan 2012, NeilHamp wrote:Is this the final HadCRUT3 global temperature for 2011?
If so +0.342 would make QV our 2011 winner
Complain about this comment (Comment number 44)
Comment number 45.
At 16:57 26th Jan 2012, NeilHamp wrote:OOPS! I forgot to include the address
https://www.cru.uea.ac.uk/cru/data/temperature/hadcrut3vgl.txt
Complain about this comment (Comment number 45)
Comment number 46.
At 17:09 26th Jan 2012, QuaesoVeritas wrote:#43. - greensand wrote:
"Re-run is now closer to your numbers but not exact. Have used MO Monthly series "Data file (in this format)" to download today:-"
Sorry, I forgot to mention that I had used the previous data file to calculate my figures as I thought you might have used them as well.
Using the new data files, my figures now agree with yours.
However!
The reply I received from the UKMO included the following statement:
"The data are rolling annual means, given each month. So the forecast for the year 2012 is 0.396 above the 1971-2000 mean."
This seems to indicate that the rolling average for 2012 is the one against the date of 2012.00, but normally a 12 month rolling average would be shown against the mid point of the period used for the average, i.e. June in the case of the 2012 forecast. Actually, for the sake of clarity, I normally calculate the average at the end of the period, as you have done in the case of the above, but strictly speaking that is not correct. However, the UKMO seem to have shown the 2012 rolling average, i.e. Jan. 12 to Dec. 12, against 2012.00. On that basis, the average against 2011.67 would be the one for the period Sep. 11 to Aug. 12, not Oct. 10 to Sep. 11, and we would not be able to calculate the corresponding actual HadCRUT3 figure until August 2012. Moreover the actual average HadCRUT3 figure for Jan. 11 to Dec. 11 would be comparable to the forecast figure against 2011.00, although there isn't one in the file.
I must admit that this has got my head spinning a bit. What do you think?
Complain about this comment (Comment number 46)
Comment number 47.
At 17:15 26th Jan 2012, QuaesoVeritas wrote:#44. - NeilHamp wrote:
"Is this the final HadCRUT3 global temperature for 2011?
If so +0.342 would make QV our 2011 winner"
Strictly speaking, I think we should use the UKMO version of the average, which according to the files, is 0.346c, but I am trying to obtain confirmation that it is the official figure.
Also, much as I would like to be the winner, I think that ukpahonta is closest to both figures, with 0.35c.
You might have been looking at my 2012 prediction!
Complain about this comment (Comment number 47)
Comment number 48.
At 18:07 26th Jan 2012, lateintheday wrote:don't worry QV, I'm sure when HadCRUT5 comes out you'll have won retrospectively.
Complain about this comment (Comment number 48)
Comment number 49.
At 18:18 26th Jan 2012, QuaesoVeritas wrote:#48. - lateintheday wrote:
"don't worry QV, I'm sure when HadCRUT5 comes out you'll have won retrospectively."
Not a chance - far too low!
Complain about this comment (Comment number 49)
Comment number 50.
At 19:10 26th Jan 2012, greensand wrote:46. QuaesoVeritas wrote:
“I must admit that this has got my head spinning a bit.”
That makes two of us.
The UKMO statement is however clear:-
"The data are rolling annual means, given each month. So the forecast for the year 2012 is 0.396 above the 1971-2000 mean."
Therefore I agree that:-
“the average against 2011.67 would be the one for the period Sep. 11 to Aug. 12, not Oct. 10 to Sep. 11, and we would not be able to calculate the corresponding actual HadCRUT3 figure until August 2012.”
And the 2012.08 number 0.412 is the forecast for the period Feb 2012 to Jan 2013 and so on.
Whilst it wasn’t immediately obvious, there is logic and I think it will fit with the “blue curve”.
So 2011.67 forward 12mth forecast is 0.345 which equates to 0.465 of HadCRUT3 (61 to 90) and the first 4 months show an actual average of 0.351?
Think I have got it, well at least until next time confusion reigns supreme.
Complain about this comment (Comment number 50)
Comment number 51.
At 19:17 26th Jan 2012, NeilHamp wrote:For completeness here are our 2011 / 2012 predictions
For my next posting I will re-order the forecasts to place the 2012 warmists at the top
As usual the Met Office seems to be topping the list
Has anyone seen any forcast from Joe Bastardi?
Met Office (+0.44) +0.48
SmokingDeepThroat (+0.39) ??
quake( +0.36) +0.41
ukpahonta (+0.35 2011 winner) +0.28
QuaesoVeritas (+0.31) +0.34
Gadgetfriend( +0.30) +0.4
NeilHamp( +0.27)+0.42
LabMunkey( +0.25) ??
millinia (+0.24) +0.29
Joe Bastardi (+0.2) ??
Ken Sharples( +0.18) ??
nibor25( +0.15) ??
John cogger +0.43
Newdwr54 +0.45
Complain about this comment (Comment number 51)
Comment number 52.
At 00:13 27th Jan 2012, greensand wrote:Whilst there have been numerous discussions about the validity of 30 year and 10 year averages in global temperatures I think it is accepted that there has been a change in the last decade with regard to the previous 2 decades.
Looking at the last decade of NH and SH plots of HadSST2 at WfT there appears to be a “disconnect” between the two hemispheres?
https://www.woodfortrees.org/plot/hadsst2nh/from:2002/plot/hadsst2sh/from:2002
Which does not appear to be evident during the previous decade?
https://www.woodfortrees.org/plot/hadsst2nh/from:1992/to:2002/plot/hadsst2sh/from:1992/to:2002
Anybody else see the same change and if so any ideas why?
Complain about this comment (Comment number 52)
Comment number 53.
At 00:43 27th Jan 2012, newdwr54 wrote:51. At 19:17 26th Jan 2012, NeilHamp wrote:
Joe makes a few predictions in this post from Watts Up With That: https://wattsupwiththat.com/2012/01/19/global-temps-in-a-crash-as-agw-proponents-crash-the-economy/
He predicts a big fall in temps Dec-Jan. Then again, as QV, greensand and others have been pointing out, AMSU ch5 has been suggesting as much since 11th January, and Joe's post was dated 19th Jan. So perhaps we shouldn't be too bowled over by that 'prediction'?
Good to see Bob Tisdale take Bastardi to task on his WUWT post: https://bobtisdale.wordpress.com/2012/01/19/on-joe-bastardis-post-global-temps-in-a-crash-as-agw-proponents-crash-the-economy/
There are many other things wrong with it. Why anyone takes Joe seriously is beyond the maw of my ken.
Complain about this comment (Comment number 53)
Comment number 54.
At 01:29 27th Jan 2012, newdwr54 wrote:52. At 00:13 27th Jan 2012, greensand wrote:
"Whilst there have been numerous discussions about the validity of 30 year and 10 year averages in global temperatures I think it is accepted that there has been a change in the last decade with regard to the previous 2 decades."
_______________________________
I wouldn't argue with that as far as trends are concerned. If you apply a 30 year running trend to the HadCRUT3 series you see a sequence of three peaks and two troughs. We appear to have (hesitantly) entered a third trough.
But that is only half the story.
For instance, you were discussing HadCRUT3 average temps a while ago with QV. It might make an interesting exercise to put the 30 year HadCRUT3 trend data alongside the 30 year average HadCRUT3 temperature data on a graph (you will need to use separate axis). If you want to see a truly impressive 'disconnect', then look no further than this.
You say "...there has been a change in the last decade with regard to the previous 2 decades". There most certainly has been. The last decade has been by far the warmest of the three.
Complain about this comment (Comment number 54)
Comment number 55.
At 08:47 27th Jan 2012, lateintheday wrote:#29. - jw196722 and QV re stargazing
If your interested in these things, I read recently that two of the brightest celestial bodies, Venus and Jupiter will be night sky 'neighbours' soon. I think the 12th Feb will be the closest they get. Here's hoping for some more clear skies!
Complain about this comment (Comment number 55)
Comment number 56.
At 09:55 27th Jan 2012, Lazarus wrote:Just had to post a weather related comment and a link about PWS who have been supplying forecasts to the generally climate skeptic papers such to the Daily Mail.
https://www.monbiot.com/2012/01/26/imaginary-friends/
It appears that PWS has been caught using fake people as 'forecasters' and has apparently now ceased trading as a company.
Complain about this comment (Comment number 56)
Comment number 57.
At 10:07 27th Jan 2012, QuaesoVeritas wrote:lateintheday,
Actually I think they might get a bit closer in March, round about the 14th seems to be the closest.
https://earthsky.org/tonight/best-venusjupiter-conjunction-in-years-mid-march-2012
It should make for an increase in the number of UFO sightings around then!
Complain about this comment (Comment number 57)
Comment number 58.
At 10:14 27th Jan 2012, QuaesoVeritas wrote:I see that tamino, on "Open Mind" has actually started to make up "fake predictions", for "fake sceptics".
https://tamino.wordpress.com/2012/01/27/fake-predictions-for-fake-skeptics/
This is all getting a bit confusing!
Complain about this comment (Comment number 58)
Comment number 59.
At 10:24 27th Jan 2012, QuaesoVeritas wrote:#56. - Lazarus wrote:
"It appears that PWS has been caught using fake people as 'forecasters' and has apparently now ceased trading as a company."
I must admit that this does not entirely surprise me.
I was never impressed by the accuracy/presentation of their forecasts or the "dumb blonde" on their website. I see that the website is now saying that they have closed due to "illness and the current economic climate".
However, you should be careful not to apply "guilt by association" to other alternative weather forecasters or "climate sceptics" in general.
I hear that the Express is currently predicting "Arctic" weather in the U.K.
I hope they didn't get that from PWS!
Complain about this comment (Comment number 59)
Comment number 60.
At 11:04 27th Jan 2012, lateintheday wrote:greensand @ 52
I stumbled across this when looking up the QDO/PDO/ID etc etc ENSO related stuff.
Might be related.
Hurrell and Van Loon
DECADAL VARIATIONS IN CLIMATE ASSOCIATED WITH NORTH ATLANTIC OSCILLATION
"Trenberth and Hoar (1996) have argued that the tendency for more frequent El Nin ̃o events and fewer La Nin ̃a events since the late 1970s, which is linked to the decadal changes over the North Pacific, may be an example of Palmer’s arguments and thus the changes may be a manifestation of global warming and related climate change associated with increases in greenhouse gases in the atmosphere. On the other hand, abrupt decadal changes in the climate of the Atlantic have been revealed in analyses of ice core data from Greenland (e.g., Alley et al., 1993) that may be related to natural fluctuations in the NAO (Barlow et al., 1993) resulting from internal atmospheric dynamical processes (e.g, Barnett, 1985; Wallace et al., 1995). Regardless of cause, the changes in circulation over the past two decades have resulted in a particular surface temperature anomaly pattern that has amplified the hemispheric-averaged warming over the NH because of its interaction with land and ocean. At the surface, temperature anomalies over land are accentuated relative to the oceans due to the larger heat capacity of water and the depth of the layer linked to the surface (Hurrell and Trenberth, 1996). The result is that the hemispheric mean surface air temperature is largely determined by the temperature of the continents."
(and as a side note to the AGW consensus here - please accept this as proof that I don't just mindlessly follow skeptical blogs)
Complain about this comment (Comment number 60)
Comment number 61.
At 11:06 27th Jan 2012, QuaesoVeritas wrote:#52. - greensand wrote:
"Looking at the last decade of NH and SH plots of HadSST2 at WfT there appears to be a “disconnect” between the two hemispheres?
Which does not appear to be evident during the previous decade?Anybody else see the same change and if so any ideas why?"
Comparing the longer term NH and SH 30 year moving averages, for HadSST2, it appears that the N.H. temp. was normally higher than S.H. until about 1993, since when they have been very similar.
This appears to be due to a consistent increase in the S.H. temp. from about 1976 which was not replicated in the N.H. temp. until about 1994.
However, when you look at the 30 year trends, you see that there was a rapid increase in the trend between 1968 and 1975 but since then the trend hasn't increased, while the N.H. trend increased between 1987 and 2005, but has since flattened out. Prior to 1968 the N.H. and S.H. trends appear to have changed more or less in unison.
The above dates are at the end of the 30 year periods in question, so reflect changes which took place before those dates.
Clearly the above does not explain a great deal, but it does confirm that there has always been a difference between N.H. and S.H. SSTs and that there appears to have been a change in the relationship since the 1960's.
What I would also say is that since the S.H. trend is currently falling more rapidly than that in the N.H. I would anticipate that in the future the differential between N.H. and S.H. temperatures may be at least partially restored.
What you seem to be seeing in the WfT graphs is the beginning of the restoration of the differential N.H. and S.H. tempertures which existed prior to the 1990's.
Complain about this comment (Comment number 61)
Comment number 62.
At 11:10 27th Jan 2012, Lazarus wrote:Perhaps there is some mileage in guilt by association with newspapers at least. They have an obligation in my opinion to check sources and credibility but fail so often and with the Leveson enquiry it is clear that some of their practices have been corrupt to the core.
It is clear that certain (perhaps all) newspapers have been choosing their forecasts based on what they want to hear rather than what it might actually turn out to be. Papers with a 'skeptic' bent choose companies that make 'skeptic' statements and are good for the odd sound bite from a 'professional' now and then as was the case with PWS and the Daily Fail, Telegraph etc.
I have just noticed that on their site, PWS offer a Wedding Bells service to predict the conditions on the 'Big Day', months in advance. In the light of this it seems that couples getting married may not have had the best service. I suspect that 'the blonde one' may be about as good as doing that as she would be with horoscopes.
https://lazarus-on.blogspot.com/2012/01/imaginary-friends.html
Complain about this comment (Comment number 62)
Comment number 63.
At 11:13 27th Jan 2012, QuaesoVeritas wrote:Please note that the first sentence in my 3rd paragraph in post 61, should have read as follows:
"However, when you look at the 30 year trends, you see that there was a rapid increase in the S.H. trend between 1968 and 1975 but since then the trend hasn't increased, while the N.H. trend increased between 1987 and 2005, but has since flattened out."
Complain about this comment (Comment number 63)
Comment number 64.
At 11:22 27th Jan 2012, lateintheday wrote:Venus and Jupiter . . . thanks for the correction QV. Should be quite a sight.
Complain about this comment (Comment number 64)
Comment number 65.
At 11:43 27th Jan 2012, Paul Briscoe wrote:Mango @ #34 (Sorry I'm playing "catch-up")
"What is the theory and null hypothesis for AGW?"
Seeing as jkiller hasn't yet responded to this, I'd be interested to know what YOU think the null hypothesis is in this case (HINT: for such a hypothesis to have any scientific validity, it has to be possible to devise studies to falsify it).
Now here's another question for you - what do you believe the null hypothesis is for the Theory of Evolution? Is it possible to falsify this hypothesis?
Paul
Complain about this comment (Comment number 65)
Comment number 66.
At 12:22 27th Jan 2012, quake wrote:robbed by ukpahonta in the recount! What's interesting is that while we were only 0.01C different in our predictions for 2011, our predictions for 2012 are 0.13C apart.
My prediction of 0.41C for 2012 is based on:
-ENSO largely determines the annual anomaly
-ENSO in 2011 was particularly cool and ENSO in 2012 is likely to be warmer. In fact I won't even entertain 2012 being cooler than 2011 I am looking for "how much warmer".
-We are at/near the peak of La Nina so the next switch will likely be around summer
-The switch is more likely to be to El Nino than La Nina because we've had a very long spell of La Nina. It would be historically unusual to have yet another rebound into La Nina.
-solar cycle is increasing. Minor point though because what ENSO does is more important.
-playing it safe I bet on an El Nino forming by end of year but not a large one and it doesn't have enough time for it's peak to influence October and November.
The Met Office prediction looks too high to me. Seems to be predicated on a big El Nino or a big dose of solar maximum. Why bet at the high end of liklihood?
Complain about this comment (Comment number 66)
Comment number 67.
At 13:55 27th Jan 2012, ukpahonta wrote:Quake.
I'll expect the trophy and prize money to be forwarded by month end! /sarc
I find myself agreeing with you on ENSO apart from I don't feel that it will turn positive this year. Although last year showed a true negative I have my suspicions that it will not get higher than slightly negative neutral, if that makes sense, throughout this year and then for next year I'm not sure as yet.
One worrying factor is that this solar cycle length is starting to look longer and longer possibly up to 17 years and La Nina is not yet showing any signs of replenishing the OHC which makes me think we will see more negative than positive ENSO in the coming decade.
Complain about this comment (Comment number 67)
Comment number 68.
At 13:59 27th Jan 2012, newdwr54 wrote:66. quake:
As soon as the SST anomaly rose above -0.5C in Nino Region 3.4 in April 2011 there was a sharp response in HadCRUT3. During 'ENSO neutral' conditions, May-August 2011 all came in the top ten warmest of their respective months on the HadCRUT3 record. The quarter JJA 2011 was also in the warmest ten on record. This suggests to me that the underlying warming trend is rearing to go as soon as it gets a chance.
It was only after the SST anomaly slipped back below -0.5 (La Nina threshold) in late August that global temperatures cooled again. If that hadn't happened, then the whole of 2011 would probably have come easily inside the top 10 HadCRUT3 years, in my view.
I don't see any reason why rapid warming won't occur again as soon as La Nina conditions lift in 2012. If the El Nino threshold (+0.5C) is passed before August, then I think my estimate of +0.45 won't be far off.
Hopefully that hasn't given my prediction the kiss of death. Krakatoa will probably erupt in May, or else we'll be hit by a comet or something. But barring that, as long as the La Nina fades by April, I'm quietly confident....:-(
Complain about this comment (Comment number 68)
Comment number 69.
At 14:53 27th Jan 2012, John Marshall wrote:Northern lights are spectactular and from northern Scotland easy to see on the odd occasion than solar flares get more intense. Thank you Paul for your insight.
We seem to have had a mild winter, so far, but colder weather is ahead according to many forecasts. Winter comes in earnest over the next few weeks and globally temperatures are set to fall due to the prolonged solar cycle 24, now deemed to last at least 17 years, and researh of past prolonged cycles predicts a drop of 2.5C of global temperatures. SC25 is predicted to produce further cooling of 2.4C, all by 2022 or so.
Time will tell but the next few days could see falling temperatures.
Complain about this comment (Comment number 69)
Comment number 70.
At 15:31 27th Jan 2012, quake wrote:2.4C?
Complain about this comment (Comment number 70)
Comment number 71.
At 16:04 27th Jan 2012, greensand wrote:@60. lateintheday
Thanks I will have a read, outside chance that I might understand it. Interesting last sentence “The result is that the hemispheric mean surface air temperature is largely determined by the temperature of the continents."
@61 QuaesoVeritas
Thanks QV, it was the prominence of the winter/ summer swings in NH after 2002 that drew my attention rather than the trends. It was a pattern I had not seen before. But it is changing and as you say looking at the chart two hemispheres appear to be taking closer order. Time will tell.
Complain about this comment (Comment number 71)
Comment number 72.
At 16:32 27th Jan 2012, ukpahonta wrote:John Marshall
Can't remember where I first saw those figures but they certainly raised my eyebrows. As a prediction I'm as sceptical of that as of the GAT rising 2C in the same time period, halve the values over the two solar cycles and I'd be happier.
Complain about this comment (Comment number 72)
Comment number 73.
At 17:03 27th Jan 2012, quake wrote:Re 68. newdwr54:
I agree with your analysis except when I plugged through some numbers I found that because 2012 is starting in the peak of a La Nina it seriously prevents the annual anomaly reaching anything particularly high.
Given that december is just in at 0.252C and from what people are saying January hasn't seen any warmup yet, maybe even a drop (SSTs have dropped I just checked)
So I took some numbers from the past to see what a break out of La Nina by summer would look like. So eg for January to June I copied anomalies from beginning of 2011:
0.259 0.322 0.407 0.329 0.432 0.466
Of course after that it slid back into La Nina. But I wanted to see what it would look like if it went instead up into El Nino. So for July to December I copied from part of the 2010 El Nino:
0.481 0.583 0.571 0.516 0.541 0.542
The annual average of all those figures comes out at about 0.45C as you have predicted.
What made me avoid predicting a figure that high is that the El Nino might not be as strong as in 2010 (also small chance it might not happen). Also it only takes a month delay in the schedule (current La Nina peak lasts a little longer) and 2 or 3 tenths of a degree are knocked out from the annual average.
In my opinion 0.45C is close to the warmest end of probability. I think an El Nino will happen, but it might not, and I am far from confident that an El Nino if it did happen would be as strong as 2010. Still at least I think your prediction could happen.
As for the Met Office forecast of 0.48C I tried to play with the numbers to see the kind of thing necessary for that and it looks like they need a miracle. I just can't understand why they predicted so high unless they are factoring in a load of warming from the rising solar cycle this year.
Assuming this is reasonable for Jan-Jun:
0.259 0.322 0.407 0.329 0.432 0.466 = 2.215
The rest of the year, the last 6 months, have to average about 0.59C for the Met Office 0.48 annual prediction to work out. So they *need* an El Nino to happen. And not just any El Nino. They need a strong one. No month of the 2010 El Nino reached as high as 0.59C. Id love to sit down with one of them and find out exactly the reasoning that went into the 0.48C prediction because I can't figure it out.
I know people have theories that they predict too high for global warming but really if it was agenda driven they'd be better off predicting too low so they could end up saying "it's warmer than we thought".
Complain about this comment (Comment number 73)
Comment number 74.
At 17:19 27th Jan 2012, MangoChutney wrote:@65
Paul
Shouldn't the proposer of the hypothesis state the null hypothesis that is capable of being proved false?
Let's see what jkiller56 has to say first - he probably can't find the answer on SkS
/Mango
Complain about this comment (Comment number 74)
Comment number 75.
At 17:40 27th Jan 2012, jkiller56 wrote:To mangochutney #32 , Paul Briscoe#65
Yes, mango - what is your null hypothesis for AGW and evolution?
Or for that matter, regarding the item you brought up in the first place, what has it got to do with being convinced that sceptic ideas are being deliberately supressed, anyway?
Ok, Ok, we know you are very clever really - now prove it!
Complain about this comment (Comment number 75)
Comment number 76.
At 19:01 27th Jan 2012, QuaesoVeritas wrote:#73. - quake wrote:
"Given that december is just in at 0.252C and from what people are saying January hasn't seen any warmup yet, maybe even a drop (SSTs have dropped I just checked)"
Not only has January not seen any warm up, but based on AQUA CH5, a significant fall is quite possible.
Based on a daily rise from now on of 0.03c, my current estimate for UAH, would be
between - 0.15c and -0.05c, and even a zero UAH could see a HadCRUT3 as low as that in January 2011, i.e. 0.194c.
Complain about this comment (Comment number 76)
Comment number 77.
At 22:41 27th Jan 2012, MangoChutney wrote:@75 & 65
guess there is nothing on SkS to provide an inaccurate answer then
come back when you have a proper response
Complain about this comment (Comment number 77)
Comment number 78.
At 00:33 28th Jan 2012, Paul Briscoe wrote:Mango @ #77
"come back when you have a proper response"
I take it from this comment that you haven't been able to find null hypotheses that can be successfully applied to complete theories based on multiple independent lines of empirical evidence and with multiple interdependent variables at play?!
I also fear that you may have misunderstood the term "theory" as it applies to science. This article gives a good definition of a scientific theory as I have always understood it:
https://bridgetfm.blogspot.com/2010/09/semantics-of-scientific-theory.html
"Colloquially, and to most people, a theory refers to a prediction or an idea. In science, a theory is not just an idea that people float out into the scientific literature, but is actually the best available explanation, well-supported by the evidence, that correctly accounts for all elements of a given phenomenon. Evidence that contradicts a current scientific theory invalidates the theory in its current form, and it must be rejected or revised to incorporate the new evidence."
Paul
Complain about this comment (Comment number 78)
Comment number 79.
At 09:04 28th Jan 2012, QuaesoVeritas wrote:The AQUA CH5 temp. rose by 0.031c on January 25th.
My best estimate for the January HadCRUT3, assuming a rise in AQUA CH5 for the remainder of the month of 0.03c per day, is now between 0.076c and 0.236c
Complain about this comment (Comment number 79)
Comment number 80.
At 09:13 28th Jan 2012, jkiller56 wrote:To Mango Chutney above:
Hello Mango - are you still there? I hope you don't think I'm being over familiar by calling you "Mango" by the way. I think our last posts must have crossed - so I thought I had better reply now in case you thought I was hiding!
Now, to answer your question. As far as I am aware the only "hypothesis" that I "proposed" was that you might be foolish to believe a lot of the stuff you appear to read, and that you are deluded in accepting the line that sceptic views are being intentionally supressed. I mean, that link you refered to - not very even handed was it? You would get a fairer view of the Nicene Creed from the Taliban, than of AGW from that I would think.
And my "null hypothesis"? It's nothing more complicated than this: that there are at least two sides to every story - so if you have a brain, no matter how small - you should use it before swallowing blatant propaganda, hook, line and sinker. There - will that do?
As for your other somewhat "off the wall" question. You know, I almost suspected you of asking it to make me feel small and stupid.
Well, I did think about it and as you suggested I could have looked it up. But I thought - what would be the point? To make me look big; cleverer than I really am; so I could strut about pretending to be a real scientist? Is that the sort of strategy you would recommend then, Mango?
But of course! That's what a lot of this sceptic stuff is all about really, isn't it? Nothing to do with finding the truth. It's about ego, never backing down, refusing to accept correction from greater authority! Its what Feminists once colourfully described as "a willy waving contest"! While on that subject - how do you know I am "he", by the way?
Anyway, plainly you are confident that your own theories trump those of the scientific majority. So can we look forward to an erudite exposition of your AGW theory to your scientific equals? Perhaps even in Nature journal?
Silly me, I almost forgot - your views are being supressed aren't they? No chance to shine there then.
More of a "nil hypothesis" than "null hypothesis" then, I guess.
Complain about this comment (Comment number 80)
Comment number 81.
At 09:15 28th Jan 2012, MangoChutney wrote:@78
Paul, this began when I posted a link to a green group funded by George Soros trying to influence the AMS to force weathermen such as Paul to accept AGW:
“It’s well known that large numbers of meteorologists are climate change deniers. It’s essential that the AMS Council resist pressure from these deniers and pass the strong statement currently under consideration.”
jkiller56 let go with a rant about conspiracy theorists and other such nonsense and stated:
"All climate sceptics need to do to convince the world they are right is to commit their ideas and theories to the scientific forum."
I decided not to react to his rant and instead asked him
"What is the theory and null hypothesis for AGW?"
Now I know there isn't a unified theory of AGW and I also know the AGW camp hasn't put forward a null hypothesis either - otherwise Trenberth wouldn't be trying to reverse the burden of "proof".
I also know a scientist sceptical of AGW has proposed a null hypothesis, but true believers never read anything by "deniers", do they?
PS I liked the cartoons from your link - very appropriate in the AGW believers case ;)
Complain about this comment (Comment number 81)
Comment number 82.
At 09:21 28th Jan 2012, MangoChutney wrote:@78
and what do you think abuot his/her response?
Complain about this comment (Comment number 82)
Comment number 83.
At 10:01 28th Jan 2012, Paul Briscoe wrote:Mango @ #81
You obviously didn't pick up one of the main messages from the article I linked to - that the term "belief" in relation to science, which is evidence-based, is "cringeworthy"!
In fact, I am writing from a position of strength here, Mango, as my own field of research (applied ecology) faces exactly the same issues as climate science when it comes to hypothesis testing - there was a philosophical debate going on about this very issue at the time when I was doing my PhD.
Sadly, when we discussed this topic a couple of threads back, I didn't have time to go back and find the relevant literature. I think the best discussion of the issues as they relate to ecology comes in a paper from 1983 by Quinn and Dunham "On Hypothesis Testing in Ecology and Evolution" (a PDF document).
The problem is that many people, especially those whose only real experience of science is laboratory-based, seem to think everything in science always fits into neat boxes. In a laboratory, it is quite easy to constrain variables, but in the real World it is generally not possible. So when you measure a particular variable in a dynamic real World system, you are almost invariably measuring its response to multiple factors operating together - ie. not just the one whose effect you want to measure. This renders the traditional hypothesis testing approach almost redundant in many cases. Quinn and Dunham cite some examples of this.
Even philosopher Karl Popper initially failed to appreciate this problem and famously declared that Darwin's Theory of Evolution was not a true scientific theory. Popper eventually realised his mistake, but creationists still use the same "lack of testability" argument.
In this type of science, the only practical approach is to build up observations, empirical evidence and make predictions - many of these CAN be tested against a null hypothesis. However, the idea that the "Greenhouse Theory" (as it was known when I was at university) and the Theory of Evolution can be proven or disproven against a null hypothesis is a fallacy. Ultimately, each of us has to apply inductive logic and decide whether the available evidence is sufficient to convince us.
I'm guessing that you probably do basically accept the Theory of Evolution, conscious that some elements of it are still "up for debate". Creationists will always be able to point out that science can't disprove the possibility of "intelligent design", but most scientists discount this possibility because there is simply no EVIDENCE for it. Simi
Complain about this comment (Comment number 83)
Comment number 84.
At 10:04 28th Jan 2012, Paul Briscoe wrote:Mango (continued)
I'm guessing that you probably do basically accept the Theory of Evolution, conscious that some elements of it are still "up for debate". Creationists will always be able to point out that science can't disprove the possibility of "intelligent design", but most scientists discount this possibility because there is simply no EVIDENCE for it. Similarly, some deniers of the scientific consensus on climate change constantly amplify the uncertainties and unknowns, pointing out that something could still overturn our understanding...... but most truly objective scientists follow the evidence, all of which points to rising levels of greenhouse gases being a serious problem. This is NOT just some religious belief, Mango - that term has no place in science.
Paul
Complain about this comment (Comment number 84)
Comment number 85.
At 11:24 28th Jan 2012, MangoChutney wrote:@83.
Paul
You obviously didn't pick up one of the main messages from the article I linked to - that the term "belief" in relation to science, which is evidence-based, is "cringeworthy"!
Don't be patronising
The problem is that many people, especially those whose only real experience of science is laboratory-based, seem to think everything in science always fits into neat boxes. In a laboratory, it is quite easy to constrain variables, but in the real World it is generally not possible. So when you measure a particular variable in a dynamic real World system, you are almost invariably measuring its response to multiple factors operating together - ie. not just the one whose effect you want to measure. This renders the traditional hypothesis testing approach almost redundant in many cases.
It seems you will agree the CO2 in a bottle experiment has no relation to real world
I'm guessing that you probably do basically accept the Theory of Evolution,
Of course I do and trying to link scepticism of AGW with belief in Creationism is a typical response of an AGW true believer.
conscious that some elements of it are still "up for debate"
Agreed, I still can't get my head around sexual reproduction. When and how exactly did the male appendage fit the female - I simply can't image a use for the sexual organs before they became sexual organs simultaneously in both sexes or perhaps sexual organs developed in hermaphrodites first - I don't know.
I'm not, however, sceptical of evolution as jkiller56 would have you believe
Similarly, some deniers of the scientific consensus on climate change constantly amplify the uncertainties and unknowns, pointing out that something could still overturn our understanding
Why use the term "denier" - as a scientist and presumably humanist, do you think it is acceptable to use the term associated with the holocaust to label people who think CO2 is not the cause of global warming?
...... but most truly objective scientists follow the evidence, all of which points to rising levels of greenhouse gases being a serious problem. This is NOT just some religious belief, Mango - that term has no place in science.
I don't accept the so-called consensus, because, whilst CO2 can cause some warming especially the first few tens of molecules, there is no evidence to suspect the warming will be significant. As I am sure you know, there is no empirical evidence to suggest climate sensitivity is high and, whilst the empirical evidence suggesting low sensitivity may have flaws and/or be incomplete, the data is based on observation and imho worthy of consideration.
Shaviv has an article which is interesting:
https://www.sciencebits.com/IPCC_nowarming
Complain about this comment (Comment number 85)
Comment number 86.
At 11:30 28th Jan 2012, MangoChutney wrote:apologies for the lack of quotation marks in the above - the italics worked in the preview
Complain about this comment (Comment number 86)
Comment number 87.
At 13:42 28th Jan 2012, newdwr54 wrote:85. MangoChutney wrote:
"Shaviv has an article which is interesting"
Interesting in that it is disingenuous?
The author argues that because the 1990 IPCC report's assessment of warming caused by 'business as usual' did not come to pass, its estimate of the climate sensitivity of CO2 must be flawed.
This ignores the fact that 'business as usual' in 1990 included the mass emission of CFCs, which are very powerful greenhouse gases. The paper Shaviv lifted the 1990 graph from is the 1990 WGI summary for policy makers. Google it (I can't link to a pdf).
You'll see from Tables 1 and 2 and figure 3 that the 'business as usual' estimate of warming is predicated upon the continued emission of CFCs. The Montreal Protocol 1989 had only agreed for a phased reduction in CFCs and was not fully ratified for another few years.
Therefore the 'business as usual' scenario in the IPCC's 1990 report says absolutely nothing about the climate sensitivity of CO2, since CO2 was not the only gas it was concerned with and CFCs, which are much more powerful greenhouse gases that CO2 or even methane, had not yet ceased being emitted.
Shaviv fails to mention this, of course. It's typical of the 'half the story' approach we see so often from 'sceptics'.
Complain about this comment (Comment number 87)
Comment number 88.
At 14:59 28th Jan 2012, greensand wrote:79. QuaesoVeritas wrote:
"My best estimate for the January HadCRUT3, assuming a rise in AQUA CH5 for the remainder of the month of 0.03c per day, is now between 0.076c and 0.236c"
Have you got the right sign QV? A rise of 0.03c per day still leaves my fag packet with a minus range?
However, as you are well aware my fag packet is far from infallible.
Complain about this comment (Comment number 88)
Comment number 89.
At 15:48 28th Jan 2012, QuaesoVeritas wrote:greensand,
Sorry, you may have missed the fact that the anomaly figure relates to HadCRUT3, not UAH.
My fault for "changing horses in mid stream".
Complain about this comment (Comment number 89)
Comment number 90.
At 16:01 28th Jan 2012, greensand wrote:QV, yup, sorry it has sunk in now!
Mark it down dodgy reading skills, must try harder!
Complain about this comment (Comment number 90)
Comment number 91.
At 18:35 28th Jan 2012, Paul Briscoe wrote:Mango @ #85
I've clearly hit a nerve here!
"Don't be patronising"
With respect, it is YOU who is being patronising (and insulting) to suggest that pretty well the entire scientific community would suspend normal scientific practice and objectivity on this one issue in favour of "belief"! Not only is this suggestion proposterous, but it is also one of the recognised characteristics of scientific denialism!
This exchange began because at post #34 you did what a lot of "sceptic" bloggers do when faced with criticisms that make them uncomfortable - you played the "null hypothesis" card. It's as though you think this is some kind of magic "get out of jail free card" that absolves you of all obligation to provide credible alternative hypotheses to the greenhouse effect...... at the same time placing all the onus on the scientists to PROVE their theory - something you must know is impossible. This isn't how science works. The scientific consensus is based on two things:
Only a significant warming effect from greenhouse gases is consistent with observations, in the present day, the ice core record and the fossil record.
There is no credible evidence in favour of alternative mechanisms to explain warming, either over the past 30 years or in the deep past.
"Sceptic" bloggers appear to completely ignore this second point, as though it is irrelevant, instead homing in on the uncertainties over details of the first. This, for me, is the dead giveaway that most bloggers aren't really being anything like as objective as they claim.
Paul
Complain about this comment (Comment number 91)
Comment number 92.
At 18:40 28th Jan 2012, Paul Briscoe wrote:Mango (continued)
"It seems you will agree the CO2 in a bottle experiment has no relation to real world"
Indeed....... and for a long time most scientists believed that in the real World the CO2 effect would be minimal. However, this assumption was eventually proved to be incorrect. You want evidence that CO2 acts as a greenhouse gas in the real World?:
Decreasing IR radiation escaping to space at wavelengths specific to CO2.
Increased "back radiation".
Global warming over recent times that cannot be explained without a substantial CO2 effect.
A magnitude of warming from glacials to interglacials that cannot be explained without a substantial CO2 effect.
Much higher global temperatures in the past when solar intensity was much lower can only be explained by CO2.
The planet's escape from "Snowball Earth" can only be explained by CO2 warming.
Sudden and catastrophic rises in temperatures at several points in the fossil record concurrent with large increases in CO2.
None of the above on their own would justify a scientific consensus, but taken together they provide compelling evidence that CO2 not only acts as a greenhouse gas in the real World, but that its warming effect, once feedbacks are taken into account, is substantial.
"Of course I do and trying to link scepticism of AGW with belief in Creationism is a typical response of an AGW true believer."
This is what hit the nerve! I am merely making the observation that you are quite prepared to accept the concept of Evolution even though many aspects of its mechanism are uncertain and even though it cannot be proven. On the other hand, you lambast scientists and accuse them of blind "faith" for reaching consensus over climate change without absolute certainty - it's a classic example of double standards!
Paul
Complain about this comment (Comment number 92)
Comment number 93.
At 18:44 28th Jan 2012, Paul Briscoe wrote:Mango (continued)
"Why use the term "denier" - as a scientist and presumably humanist, do you think it is acceptable to use the term associated with the holocaust to label people who think CO2 is not the cause of global warming?"
Scientific denialism is a recognised phenomenon with known characteristics:
https://scienceblogs.com/denialism/about.php
Linking scientific denialism to holocaust denial may play on some peoples' emotions, but is irrelevant to the point being made.
"I don't accept the so-called consensus, because, whilst CO2 can cause some warming especially the first few tens of molecules, there is no evidence to suspect the warming will be significant."
That is your prerogative, but most scientists clearly disagree with you for the reasons given above - there is lots of evidence to suggest that the warming will be significant.
I note that newdwr54 has already picked up on some obvious problems with the claims of Shaviv. I will add that recent research indicates that the present "lull" in warming is almost certainly down to natural variability and is not indicative of a slowdown in the long-term warming trend. Scientists appear confident that a more rapid upward trend will resume in the near future:
https://data.giss.nasa.gov/gistemp/2011/
"We conclude that the slowdown of warming is likely to prove illusory, with more rapid warming appearing over the next few years."
Paul
Complain about this comment (Comment number 93)
Comment number 94.
At 18:57 28th Jan 2012, QuaesoVeritas wrote:#93. - Paul Briscoe wrote:
"Scientific denialism is a recognised phenomenon with known characteristics:"
Those who believe in the accuracy of climate models, when the real data suggests the majority of those models are wrong, are also in denial.
Complain about this comment (Comment number 94)
Comment number 95.
At 19:01 28th Jan 2012, QuaesoVeritas wrote:#54. - newdwr54 wrote:
"For instance, you were discussing HadCRUT3 average temps a while ago with QV. It might make an interesting exercise to put the 30 year HadCRUT3 trend data alongside the 30 year average HadCRUT3 temperature data on a graph (you will need to use separate axis). If you want to see a truly impressive 'disconnect', then look no further than this."
First of all, I am pleased that you are referring to to the 30 year rolling trend, since AFAIK, I was the first person (here at least), to look at these trends on a rolling basis, rather than a "snapshot" of the trends at a single point in time.
However, I don't know how you can say that there is a disconnect between the 30 year MA and the 30 year trend, or a trend over any period and it's equivalent rolling average, since both are derived from precisely the same data. They are simply two ways of looking at the same temperature pattern and as long as they are interpreted correctly there is no disconnect, nor can there ever be a disconnect.
However, I do believe that the rolling trends have some advantages over rolling averages.
Complain about this comment (Comment number 95)
Comment number 96.
At 19:14 28th Jan 2012, greensand wrote:Re how ENSO is likely to develop:-
“4-month sequence of vertical temperature anomaly sections at the equator, Pacific for January 2012”
https://www.bom.gov.au/cgi-bin/oceanography/wrap_ocean_analysis.pl?id=IDYOC007&year=2012&month=01
looks very similar to Jan 09
https://www.bom.gov.au/cgi-bin/oceanography/wrap_ocean_analysis.pl?id=IDYOC007&year=2009&month=04
Will the next few months follow the 2009 transition out of La Nina?
The BOM site is updated regularly.
Complain about this comment (Comment number 96)
Comment number 97.
At 19:34 28th Jan 2012, Paul Briscoe wrote:QV @ #94
"Those who believe in the accuracy of climate models, when the real data suggests the majority of those models are wrong, are also in denial."
Those who try to draw conclusions about model projections from the year 2000 based on just 11 years of data (that may well not be representative of the long term trend) are in denial of the normal principles of science! Clearly, some of the models are going to be closer to actuality than others, but it is far too early at this stage to say which. You need to be more patient, QV!
Paul
Complain about this comment (Comment number 97)
Comment number 98.
At 21:24 28th Jan 2012, newdwr54 wrote:95. QuaesoVeritas wrote:
"I don't know how you can say that there is a disconnect between the 30 year MA and the 30 year trend, or a trend over any period and it's equivalent rolling average, since both are derived from precisely the same data."
_______________________________
With our present data a person can legitimately say that 'there's been no warming for 10 years or so'; while another person can legitimately say 'the last 10 years or so were the warmest on record'.
That's the problem (for me) that rolling trends have as opposed to rolling averages. It 'is' significant that the last 10 years or so are among the warmest on record. Averages highlight this much better than trends. Trends are good at showing 'relative' changes; averages are better at showing 'actual' changes.
Trends can give the impression, since it's not been warming much over the past ten years or so, that there's nothing to worry about. Averages show that we have reached a very high temperature plateaux and stayed there. Averages therefore reflect 'real world' data, and its implications, more accurately IMHO.
Here's HadCRUT3 global averages smoothed to 30 years: https://www.woodfortrees.org/plot/hadcrut3gl/mean:360
Does that look anything like the up and down pattern you see from the rolling 30 year trend analysis? Trends are useful, but they can also blur reality.
Complain about this comment (Comment number 98)
Comment number 99.
At 08:47 29th Jan 2012, QuaesoVeritas wrote:There was an unusually large increase in the AQUA CH5 temp. of 0.054c on the 26th, and it looks like the period of falling temperatures is now over.
My new estimate for the January HadCRUT3 anomaly, based on a daily rise in CH5 of 0.03c, is now between 0.079c and 0.239c, but if the warming were to continue at 0.05c/day, the estimate would be between 0.087c and 0.247c.
Complain about this comment (Comment number 99)
Comment number 100.
At 16:19 29th Jan 2012, lateintheday wrote:newdwr54 - I'm not sure that you could describe that plot as showing reality either.
The first thing I note is that the slope of the most recent warming is very similar to the early 20thC warming which has hitherto, largely been explained as natural variability by the AGW consensus.
The second thing is that whilst the plot correctly stops around 1996, the actual data points for the last fifteen years are all subject to revision based on what happens over the next fifteen years. A continued flattening or reduction of temp anomalies over the next 15years would presumably alter the plot so markedly, that it would render this 'point in time' plot obsolete. So, whilst this plot may be useful within the context of a suite of plots using different methods, by itself, it tells us very little.
Complain about this comment (Comment number 100)
Page 1 of 2