
Autumn warmth continues
November has started where October left off, with mild temperatures expected over the next few days as southerly winds continue.
Provisional figures show October has been the 8th warmest since 1910 across the UK.
The month will be remembered for the heat during the first weekend, when Yorkshire's record, held by Whitby for over 100 years, fell to Bramham, in West Yorkshire, where 28.7C was recorded on the 1st.
The following day, Lincolnshire established a new record, with 29.3C recorded at Coningsby. Nationally, Gravesend also set a new UK record with 29.9C.
The warmth across the UK for October can be seen very nicely on the temperature map below.
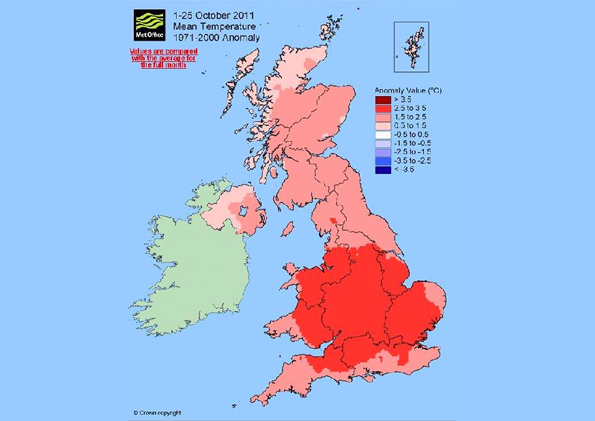
Locally, mean temperatures at Leeming, in North Yorkshire, were 12.2C compared to the long term average of 10.1C. Rainfall was 66mm, very close to the October average of 69mm.
Parts of Lincolnshire though had less rainfall than normal, with Coningsby recording 41mm, compared with the average of 51mm.
With the county still officially in drought, a dry winter could mean real problems next year.
 Hello, I’m Paul Hudson, weather presenter and climate correspondent for BBC Look North in Yorkshire and Lincolnshire. I've been interested in the weather and climate for as long as I can remember, and worked as a forecaster with the Met Office for more than ten years locally and at the international unit before joining the BBC in October 2007. Here I divide my time between forecasting and reporting on stories about climate change and its implications for people's everyday lives.
Comment number 1.
At 18:47 1st Nov 2011, brossen99 wrote:https://joannenova.com.au/2010/10/is-the-western-climate-establishment-corrupt-part-i/
Complain about this comment (Comment number 1)
Comment number 2.
At 18:50 1st Nov 2011, PingoSan wrote:And yet the earth continues to cool. https://wattsupwiththat.com/2011/10/30/uah-lower-troposphere-temperature-colder-than-2008/
Warmer than average temperatures at high latitudes at this time of year leads to a lot of heat shedding from the earth during the long nights. This leads to a cold winter. It's why there is a statistically significant link between warm Octobers and cold winters in this part of the world.
More open water at the Arctic also helps to shed heat, because open water loses more heat on long nights than does water that is insulated with a sheet of ice.
Complain about this comment (Comment number 2)
Comment number 3.
At 19:16 1st Nov 2011, jkiller56 wrote:Yes, remarkably warm and overall, dry. I have just returned from Shropshire. It is incredibly dry there - in places almost like Spain at the end of summer. According to locals they've had little rain since the spring drought.
Not sure I see the logic of ~2 above!
Incidentally, for those interested in climate change, there was a good summary in "New Scientist" last week about what is and is not known - (basic AGW being one near certainty I'm afraid).
Please don't tell me that NS is also part of the worldwide conspiracy with the IPCC, BBC, Met Office etc etc!
Complain about this comment (Comment number 3)
Comment number 4.
At 20:52 1st Nov 2011, QuaesoVeritas wrote:#2. - PingoSan wrote:
"And yet the earth continues to cool."
Yes, based on the AQUA CH5 temperature, this October is heading to be one of the coldest since 2002 and probably the coldest according to other series, since 2000.
The September HadCRUT3 anomalies were slightly higher than my central estimates based on HadSST2:
Global 0.371c, down from a revised 0.448c in August. This is the lowest September anomaly since 2000, narrowly beating the figure of 0.376c in 2008.
N.H. 0.512c, down from 0.617c in August.
S.H. 0.229c, down from 0.279c in August.
As a result of the the latest Global anomaly, the 10 year linear trend has gone from -0.0707c/decade to -0.0750c/decade.
The way things are going with the AQUA CH5 anomaly figures, we can probably expect further falls in the main temperature anomaly series, including HadCRUT3, in October.
Complain about this comment (Comment number 4)
Comment number 5.
At 21:07 1st Nov 2011, QuaesoVeritas wrote:#3. jkiller56 wrote:
"Incidentally, for those interested in climate change, there was a good summary in "New Scientist" last week about what is and is not known - (basic AGW being one near certainty I'm afraid). "
There's a surprise!
Warming is a near certainty but there is increasing doubt over the cause and the rate of warming.
Complain about this comment (Comment number 5)
Comment number 6.
At 00:24 2nd Nov 2011, Lazarus wrote:QuaesoVeritas wrote:
"Warming is a near certainty but there is increasing doubt over the cause and the rate of warming."
Increasing doubt among who? Not the researchers.
Complain about this comment (Comment number 6)
Comment number 7.
At 05:46 2nd Nov 2011, NeilHamp wrote:Once again here are our forcasts for 2011
Met Office +0.44
SmokingDeepThroat +0.39
quake +0.36
ukpahonta +0.35
QuaesoVeritas +0.31 (original estimate)
Gadgetfriend +0.30
NeilHamp +0.27
LabMunkey +0.25 (revised)
millinia +0.24
Joe Bastardi +0.2
Ken Sharples +0.18
nibor25 +0.15
We now have 10 months of the year to date
My estimate of the HadCRUT3 10 month mean is 0.36
QV's may have more accurate figures
Complain about this comment (Comment number 7)
Comment number 8.
At 07:23 2nd Nov 2011, PingoSan wrote:"Increasing doubt among who? Not the researchers."
I think the description you were looking for was "grant-seekers".
Complain about this comment (Comment number 8)
Comment number 9.
At 07:39 2nd Nov 2011, QuaesoVeritas wrote:#7. - NeilHamp wrote:
"We now have 10 months of the year to date
My estimate of the HadCRUT3 10 month mean is 0.36
QV's may have more accurate figures"
Your figure looks correct.
The UKMO annual figure is now 0.367c, but I am never certain whether it
has been updated. This seems unlikely to change much and does seem a long
way from their prediction of 0.44c. Based on the current figure, 2011 is ranked 11th in the HadCRUT3 annual series.
Thanks for the reminder of the predictions.
Complain about this comment (Comment number 9)
Comment number 10.
At 08:27 2nd Nov 2011, Sheffield_city wrote:I see that within two weeks we are going to be in for some very cold weather and snow. Our friends on the other side of the Atlantic have just been caught out by 2 foot of snow in October. It makes me laugh, when people talk about Global warming, I would love some,
Complain about this comment (Comment number 10)
Comment number 11.
At 08:40 2nd Nov 2011, LabMunkey wrote:It has definitley been unseasonably warm recently, and dry too. Certainly hope we get some wet weather during winter.
Incidentally, this may be batshot crazy and all that, but has anyone looked into seasonal shift??
It seems to me (from my possible erroneous memory) that summers ending later and winters stretching more into new year. Could the seasons just be shifting by a few weeks?? Possible orbital related?
No idea, just thought i'd put it out there. Now to the Lab!
Complain about this comment (Comment number 11)
Comment number 12.
At 09:20 2nd Nov 2011, QuaesoVeritas wrote:Lazarus,
"There's none so blind as those who will not see".
Can you tell me of any pro-AGW researcher who predicted that there would be no significant increase in global temperatures over the last 10 years?
Complain about this comment (Comment number 12)
Comment number 13.
At 09:38 2nd Nov 2011, QuaesoVeritas wrote:LabMunkey,
As an amateur astronomer, I don't think that there has been any change in the Earth's orbit which would account for a change in the seasons.
Complain about this comment (Comment number 13)
Comment number 14.
At 09:42 2nd Nov 2011, LabMunkey wrote:QV,
yeah i figured as much. You'd imagine something like that would be reported. Has anyone looked at the monthly temp data this way (looking for a shift). Just curious.
Complain about this comment (Comment number 14)
Comment number 15.
At 09:44 2nd Nov 2011, jazznick wrote:Paul,
Did you see how your mate Piers Corbyn saw the US blizzards coming a month ahead ?
https://climaterealists.com/index.php?id=8569
Complain about this comment (Comment number 15)
Comment number 16.
At 09:49 2nd Nov 2011, Paul Briscoe wrote:QV @ #12
"Can you tell me of any pro-AGW researcher who predicted that there would be no significant increase in global temperatures over the last 10 years?"
I don't have a lot of time just now, but I think the following explains the point you're missing:
https://berkeleyearth.org/FAQ.php
"Some people draw a line segment covering the period 1998 to 2010 and argue that we confirm no temperature change in that period. However, if you did that same exercise back in 1995, and drew a horizontal line through the data for 1980 to 1995, you might have falsely concluded that global warming had stopped back then. This exercise simply shows that the decadal fluctuations are too large to allow us to make decisive conclusions about long term trends based on close examination of periods as short as 13 to 15 years."
Paul
Complain about this comment (Comment number 16)
Comment number 17.
At 09:53 2nd Nov 2011, LabMunkey wrote:@ 16. This brings us to aliasing- something i've recently been introduced to by Professor Currys blog.
I think we could easily argue that the data we have (satellite) is aliased, which adds an interesting angle to ANY interpretation.
Complain about this comment (Comment number 17)
Comment number 18.
At 10:59 2nd Nov 2011, QuaesoVeritas wrote:Paul Briscoe,
I am aware that lots of people are saying retrospectively that they knew all along that this would happen, but did anyone say it before it happened?
I appreciate that if you are not already aware of such a statement that it would take a lot of research and I don't really expect you to do that.
It is interesting that the IPCC multi-model mean projections don't show any decadal periods of zero or lower temperature growth, except in the case of the "commitment" scenario, which is based on zero growth in greenhouse gasses.
Complain about this comment (Comment number 18)
Comment number 19.
At 11:06 2nd Nov 2011, ukpahonta wrote:The net is buzzing:
https://www.bishop-hill.net/blog/2011/11/1/scientific-heresy.html
Complain about this comment (Comment number 19)
Comment number 20.
At 11:11 2nd Nov 2011, john_cogger wrote:@10 Sheffield_city
'I see that within two weeks we are going to be in for some very cold weather and snow. Our friends on the other side of the Atlantic have just been caught out by 2 foot of snow in October. It makes me laugh, when people talk about Global warming, I would love some.'
--------------------------------------------
The irony is you post this on a blog saying how October has been warmer than average.
Complain about this comment (Comment number 20)
Comment number 21.
At 11:47 2nd Nov 2011, lateintheday wrote:strictly on topic for a change, I can attest to the dryness in lincolnshire this year with a very simple observation. Our house has a old well which has been kept for decorative purposes. It's dry for the first time in the seven years that we've lived here. I presume that this reflects the height of the water table hereabouts in which case, I'd say it has dropped about two feet.
Yes - we could do with some rain over the winter.
Complain about this comment (Comment number 21)
Comment number 22.
At 11:50 2nd Nov 2011, John Marshall wrote:And your point is Paul?
October is a variable month with warmer times that actually have a name, Indian Summer. A term spawned in Victorian times so not that rare.
This time is due to warmer air from Spain and France, which probably caused past IS times.
So no cause for any alarm or drive to find a sinister cause.
Complain about this comment (Comment number 22)
Comment number 23.
At 12:03 2nd Nov 2011, quake wrote:The warm September and October have pretty much guaranteed that Autumn 2011 will be in the top 10 warmest Autumns in CET.
The existing record for warmest Autumn is held by 2006 which took it by a landslide. November 2011 needs to be warmer than 10.19C on average for 2011 to take first place for warmest Autumn. That's very unlikely given the existing warmest November on record is 10.1C (1994)
On the other-hand November only has to be warmer than 7.7C on average for 2011 to take 2nd warmest Autumn on record. In the last decade 5 years have been warmer than 7.7C (2002, 2003, 2004, 2006, 2009) so it is plausible this will happen.
https://www.metoffice.gov.uk/hadobs/hadcet/ssn_HadCET_mean_sort.txt
https://www.metoffice.gov.uk/hadobs/hadcet/mly_cet_mean_sort.txt
https://www.metoffice.gov.uk/hadobs/hadcet/cet_info_mean.html
Complain about this comment (Comment number 23)
Comment number 24.
At 13:13 2nd Nov 2011, Lazarus wrote:Qv,
"I am aware that lots of people are saying retrospectively that they knew all along that this would happen, but did anyone say it before it happened?"
Well even the climate skeptical Telegraph reported in 2008 a hiatus in warming due to natural variation this decade as did many papers.
https://www.telegraph.co.uk/earth/earthcomment/charlesclover/3341068/Global-warming-may-stop-scientists-predict.html
Even the Daily Mail sexed up the idea when Prof Mojib Latif mentioned the possibility to suggest global warming was going to stop for decades. Much to Latif's annoyance;
https://deepclimate.org/2010/01/11/mojib-latif-slams-daily-mail/
So the idea was being suggested and not retrospectively for some time.
Complain about this comment (Comment number 24)
Comment number 25.
At 13:43 2nd Nov 2011, QuaesoVeritas wrote:Lazarus,
Since the lack of warming was well underway by 2008, I consider that to be retrospective. I meant PRIOR to the last 10 years, e.g. when the warming frenzy was at it's height in 1998.
If warming were to stop for a further 10 years, that would make it no warming for over 20 years, which I think might be "statistically significant", based on the accepted convention.
Complain about this comment (Comment number 25)
Comment number 26.
At 16:06 2nd Nov 2011, steveta_uk wrote:Paul,
your colleague Richard Black has an astonishingly inaccurate article up at the moment where he either through ignorance, or possibly malice, completely misrepresents what the "hide the decline" debate regarding proxy reconstructions and climate-gate was all about.
It is so misleading that I would think it should be taken down until it can be rewritten.
Clearly he doesn't read comments on his own blog, since many folk have pointed out his error, and there is no sign of any response. Do you have an inside line to head office where someone can be alerted to this?
https://www.bbc.co.uk/news/science-environment-15538845
Complain about this comment (Comment number 26)
Comment number 27.
At 16:11 2nd Nov 2011, Paul Briscoe wrote:QV (various)
I think the key point is this:
There is huge natural variability built into the global temperature data, due mainly to:
1. Ocean cycles
2. Volcanoes
3. Solar influences
Scientists are not yet able to predict any of these in advance, so it is unreasonable to expect them to be able to predict when there is going to be a "lull" in the warming trend. All they can say is that there are likely to be periods where the short-term temperature trend is lower and others where it is higher.
"If warming were to stop for a further 10 years, that would make it no warming for over 20 years, which I think might be "statistically significant", based on the accepted convention."
Yes, I'm sure that's correct. The problem is that, with such large and unpredictable internal variablity, the uncertainties become huge when considering the trend over periods as short as 10 years. As you infer yourself, the current short-term trend is not statistically different from the longer-term one. However, it could be masking a reduction in global temperature OR an accelerating rise.
In other words, it is impossible to draw scientifically valid conclusions from such a short period......... which is why scientists look at long-term trends.
Paul
Complain about this comment (Comment number 27)
Comment number 28.
At 17:37 2nd Nov 2011, quake wrote:"I am aware that lots of people are saying retrospectively that they knew all along that this would happen, but did anyone say it before it happened?"
Not that I remember. In fact I am sure noone expected let alone knew it would happen.
Complain about this comment (Comment number 28)
Comment number 29.
At 18:16 2nd Nov 2011, newdwr54 wrote:25. At 13:43 2nd Nov 2011, QuaesoVeritas:
"If warming were to stop for a further 10 years, that would make it no warming for over 20 years, which I think might be "statistically significant", based on the accepted convention."
Have you come across Santer et al. (2011) on your travels? https://www.agu.org/pubs/crossref/pip/2011JD016263.shtml
From the abstract:
"Our results show that temperature records of at least 17 years in length are required for identifying human effects on global-mean tropospheric temperature."
Strictly speaking I think they are talking about the troposphere as a whole, not just the surface, but let's assume for a second that this rule can be applied to surface temperatures. Do any of the global data sets suggest that warming has 'stopped' over the last 17 years?
It's not a trick question, and I honestly haven't had a chance to check most of them. As the board's semi-official 'stato', I thought you might like to get your teeth into that one.
Complain about this comment (Comment number 29)
Comment number 30.
At 18:27 2nd Nov 2011, greensand wrote:# 4 QuaesoVeritas
Re HadCRUT3 Sept - you were not far out with the prediction. Well done.
The numbers again show CRUTEM3 (Land) warming +0.046C (NH +0.031C, SH +0.061C).
Whilst HadSST2 shows cooling -0.074C (NH -0.068C, SH -0.080C)
The trend of land temps increasing more than SST is more prominent in the NH. A plot of NH CRUTEM3 minus NH HadSST2 shows quite a change, especially since about 1980. SH shows a constant ratio land to ocean, but there is 4 times more ocean than land.
Re AMSU Ch 5, the fall through October has been quite pronounced. The 30th Oct number at -20.95C is the lowest October day for at least a decade. We should get the actual Oct month number in a few days.
It appears that all the metrics are pointing one way. Can’t see the land continuing to warm whilst the oceans cool.
Complain about this comment (Comment number 30)
Comment number 31.
At 20:44 2nd Nov 2011, QuaesoVeritas wrote:greensand,
Thanks. I have had a serious problem with my main computer, so I hadn't had a chance to download the latest CRUTEM3 figures. I'm a bit surprised that they show increases, but it explains why my estimates based on HadSST2 were excessive. I will try to factor that in in future, but it will mean guessing the CRUTEM3 figure.
Actually it's not surprising that the perception is that it's getting warmer in the NH, since most people live on land! On the other hand, the HadSST2 temperature is based on the actual temperature in the ocean, which not many people would experience.
I was thinking that combining ocean temperatures for the sea and air temperatures over land is a bit like combining apples and oranges. Shouldn't we have air temperatures over the ocean to be consistent?
By the way, have you noticed that the CRUTEM3 figures are back on the CRU site, at least the last time I looked. Also, there is a gap in the UKMO data for September 1850, which the MO seemed surprised about when I pointed it out, although it doesn't seem to have been fixed yet. It seems to relate to the SH.
I am expecting a UAH anomaly of between 0.11c and 0.21c.
Complain about this comment (Comment number 31)
Comment number 32.
At 20:50 2nd Nov 2011, QuaesoVeritas wrote:newdwr54,
I haven't looked at trends over 17 year period using any of the anomaly series, although I do know that the HadCRUT3 20 year trend has been falling since 2004, although recently not as fast.
If I get a chance, I will have a look at the 17 year trend, since it appears that is a significant period of time.
I think that if there had been no warming over 17 years, someone would have drawn attention to it.
Complain about this comment (Comment number 32)
Comment number 33.
At 20:51 2nd Nov 2011, jkiller56 wrote:to LabMunkey #11
Are the seasons shifting to becoming later? Last years winter was exceptionally early, likewise this spring - so no consistant trend that I can see.
Lateintheday #21 Yes would agree water table seems very low. We have local springs here that are dry for the first time that I can remember.
Not sure anything can be read into the warm October one way or another. Someone said there was a tendancy for cold winters to follow warm Octs. This was true as I remember in 1978 - when cold swept in in mid Nov, after a v. mild start and led to the infamous 1979 winter.
However in v.warm 1969 after similar Nov cold, much of the winter was innocuous. In 2001 a very warm Oct was folllowed by an overall v. mild winter.
Just shows it pays to be very cautious about long range forecasts - particularly when they really are trying to forecast ahead, rather than telling people what they got right last time (the latter being the more common case).
Complain about this comment (Comment number 33)
Comment number 34.
At 21:18 2nd Nov 2011, greensand wrote:QuaesoVeritas
Computers are better either kaput or OK, ones with problems are a real pain. Video chip gone pop on this laptop making scrolling a large spreadsheet a real, real pain.
It looks like the land increase has skewed your forecast. I am trying to do a bit of work correlating HadCRUT3 and HadSST2 with UAH Globe, Land, Ocean, from here:- https://vortex.nsstc.uah.edu/data/msu/t2lt/uahncdc.lt
Which also gives NH and SH data.
Yup got the SST2 back at CRU checked just before I sent an email, have checked can’t see any changes.
Re UAH anomaly, I have never been able to get a handle on it, my numbers have 0.13 as the top end! Going down to as low as 0.02! Which I cannot see happening and past record tells me to treat them with a pinch of salt. We shall see, numbers usually out early.
Regards
Complain about this comment (Comment number 34)
Comment number 35.
At 21:23 2nd Nov 2011, greensand wrote:QuaesoVeritas
Correction re UAH, not that I think it matters but on checking I have 0.15 max 0.04 min?
Complain about this comment (Comment number 35)
Comment number 36.
At 00:30 3rd Nov 2011, Lazarus wrote:QuaesoVeritas wrote:
"Since the lack of warming was well underway by 2008,"
There hasn't been a lack of warming. No climatologist would look for significance in such a short period of time when there are natural cycles over longer than a decade. Besides I'm a bit puzzled because at that time the previous year was the third hottest according to NASA Goddard and 2008 was on the way to be in the top 10 and every decade since the 1970s would be hotter than the last.
That simple fact is that any year in the top half of the instrument record, covering over a century of data, will be adding to the warming trend.
Complain about this comment (Comment number 36)
Comment number 37.
At 08:51 3rd Nov 2011, lateintheday wrote:yes Lazarus, that's the problem with statistics. Even if the next 30 years showed a very slow decline, (year on year in the hundredths) some would still claim a warming trend.
By the same token, I've seen some geologist skeptics claim that we're actually in a long term (many thousands of years) cooling trend.
There is nothing particularly special about the '30yrs is climate' claim. In fact, as we all now know, some important oceanic natural variations occur over 60 - 80yrs and of course the THC spans a much longer period.
Personally, I rather like QV's approach which seeks to identify the underlying trend within the headline trends. It's another indicator - and that's always useful.
Whilst predictions of any sort are fraught with danger, the current la nina (in waiting) has been variously predicted to either fizzle out before the end of the year, or to surge with full force into late spring/early summer next year. If it's the latter, then quite clearly we'll have another cool year - relatively speaking, that is.
Complain about this comment (Comment number 37)
Comment number 38.
At 09:24 3rd Nov 2011, Paul Briscoe wrote:lateintheday @ #37
"Even if the next 30 years showed a very slow decline, (year on year in the hundredths) some would still claim a warming trend."
Let's be clear. If they were to do so, it is very unlikely that statistics would support them!
Paul
Complain about this comment (Comment number 38)
Comment number 39.
At 12:44 3rd Nov 2011, Lazarus wrote:lateintheday wrote:
"There is nothing particularly special about the '30yrs is climate' claim."
There is if you want to determine anything meaningful unlike the examples you gave or the rampant cherry picking that goes on here and on skeptic blogs. That is because that time period should include at least two full natural cycles that occur within our time scales. It is also about the start of the time thought be be the latency of the climate system. Even so the last decade was warmer than the one before and that is becoming a constant. BEST shows no evidence of global warming slowing down. Just because skeptics claim it should be warming faster than doesn't mean there is anything wrong with the physics.
Complain about this comment (Comment number 39)
Comment number 40.
At 14:36 3rd Nov 2011, Sheffield_city wrote:John_cogger. I was giving a Scarborough warning about the weather. I remember October 2000 being very warm, I was in Scarborough for the last week of October and it was tea shirt weather. Then winter hit us and it was pretty cold. The difference this time, is we will have a lot more snow.
Complain about this comment (Comment number 40)
Comment number 41.
At 15:02 3rd Nov 2011, greensand wrote:Quelle surprise!
"UAH Global Temperature Update for October 2011: +0.11 deg. C"
"The Northern Hemisphere, Southern Hemisphere, and tropics have all cooled substantially, consistent with the onset of another La Nina, with the tropics now back below the 1981-2010 average."
Well QV, I think we each get a point for that! Nearest I have ever been!
The full geographic split should be interesting but not yet available at:-
https://vortex.nsstc.uah.edu/data/msu/t2lt/uahncdc.lt
Complain about this comment (Comment number 41)
Comment number 42.
At 15:05 3rd Nov 2011, QuaesoVeritas wrote:#38. - Paul Briscoe wrote:
"Let's be clear. If they were to do so, it is very unlikely that statistics would support them!"
Based on past experience, the logic would be along the lines of "the world is still warming because the last 30 years are the warmest on record".
Complain about this comment (Comment number 42)
Comment number 43.
At 15:08 3rd Nov 2011, greensand wrote:Forgot the:-
"UAH Global Temperature Update for October 2011: +0.11 deg. C"
link:- https://www.drroyspencer.com/
Complain about this comment (Comment number 43)
Comment number 44.
At 15:12 3rd Nov 2011, QuaesoVeritas wrote:#41. - greensand wrote:
"Well QV, I think we each get a point for that! Nearest I have ever been!"
We will have to compare methodology later.
The only reason I said 0.11 to 0.21 was that up until last month, the actual UAH figure was coming out about 0.1c above my estimate based on AQUA CH5.
Suddenly last month the differential disappeared but I didn't know if it would return this month. It seems to depend upon whether the temp. is rising or falling. Possibly it's seasonal but I haven't looked at previous years to see if there was a similar pattern.
Strangely, the AQUA CH5 figure doesn't suggest a big fall in HadCRUT3, but it isn't usually reliable. Will have to wait for the HadSST2 figure for a reliable estimate.
Complain about this comment (Comment number 44)
Comment number 45.
At 15:23 3rd Nov 2011, Sheffield_city wrote:What ever happened to the hockey stick?
Complain about this comment (Comment number 45)
Comment number 46.
At 15:39 3rd Nov 2011, lateintheday wrote:Lazarus - such a small post and yet still so much wrong.
"There is if you want to determine anything meaningful unlike the examples you gave or the rampant cherry picking that goes on here and on skeptic blogs."
Of course pro AGW never do this do they because they are all fine upstanding scientists and skeptics are all evil. Since you brought up Muller, read what he has to say about climategate.
"That is because that time period should include at least two full natural cycles that occur within our time scales."
What nonsense is this. What two full natural cycles are you on about? How does this square with the PDO or the AMO etc. The reality is, 30yrs = climate is just a number. It may as well be 15yrs, 25yrs or 35yrs or 150yrs for that matter. Personally, I'm not that bothered since every measure and every anomaly is relative in the grand scheme of things and each time frame gives a broader picture.
"It is also about the start of the time thought be be the latency of the climate system."
Not to my knowledge. I'm pretty sure Hansen has recently estimated between 40yrs and 50yrs for Oceans to reach equilibrium after forcing. He also seems to be on a collision course with Trenberth if reports are to be believed.
QV and Greensand - congratulations. The baby has arrived safely this month it appears.
Complain about this comment (Comment number 46)
Comment number 47.
At 15:58 3rd Nov 2011, greensand wrote:#46 lateintheday wrote:
"QV and Greensand - congratulations. The baby has arrived safely this month it appears."
Thanks, but the little thing ain't saying too much yet, may get a better understanding when the full geographic data is out.
Been watching some below average temperature water gathering around Greenland and Iceland, be interesting to see what the UAH numbers are for the northern oceans and as QV says check them out against HadSST2.
https://weather.unisys.com/surface/sst_anom.gif
On second thoughts it might not show until Nov numbers.
Complain about this comment (Comment number 47)
Comment number 48.
At 16:20 3rd Nov 2011, lateintheday wrote:Greensand, excuse my ignorance but where will they get the sea temps from? I read that the satellite instrument (Spencer's) for this had died last month?
Complain about this comment (Comment number 48)
Comment number 49.
At 16:57 3rd Nov 2011, greensand wrote:#48 lateintheday:
As I understand it is lower troposhere temperatures above the designated areas. Hence the so far unsuccessful search for the LT "hot spot" over the tropics. Will do some work and see if I can get a reference.
The data I have been using comes from here:-
https://vortex.nsstc.uah.edu/data/msu/t2lt/uahncdc.lt
Hasn't got the Oct numbers but you can see the regions covered.
Also the post linked below by Steve McIntyre has thrown in another variable that will take me sometime to comprehend. It references the relationships between BEST, CRU and the satellite TLT data and throws in the "downscaling" of the satellite data? There is a lot in the post and in the comments.
https://climateaudit.org/2011/11/01/closing-thoughts-on-best/
Complain about this comment (Comment number 49)
Comment number 50.
At 10:53 6th Nov 2011, newdwr54 wrote:32. QuaesoVeritas:
Regarding what Santer et al. regard as the likely 'AGW signal' in global climate, here are the last 17 years' per-decade trends for the five main providers:
NOAA: +0.10 C
NASA: +0.15 C
HadCRU: +0.10 C
RSS: +0.07 C
UAH: +0.14 C
There are some curious anomalies in there. Why, for instance, does one satellite provider show twice as much average warming as the other (and a 'sceptic' too!)? We know why HadCRU disagrees with NASA, but why do NASA and NOAA disagree?
Interestingly, if you use 30 years' data for the trends you get much better agreement:
NOAA: +0.17 C
NASA: +0.18 C
HadCRU: +0.16 C
RSS: +0.16 C
UAH: +0.17 C
Complain about this comment (Comment number 50)
Comment number 51.
At 14:11 6th Nov 2011, QuaesoVeritas wrote:Thanks for doing that work newdwr54,
What will also interesting to see is how the trends over 17 years have varied with time. They are almost certainly falling, along with the trends over 20 and 10 years, but are they likely to approach zero? A rhetorical question, which I don't expect you to answer.
It is interesting to see how much higher the UAH trend is compared to that of RSS.
For most of this year, the UAH anomalies have been higher than one would expect from their relationship with AQUA CH5 temperatures, but I don't know if that would have a significant effect on the 17 year trend.
I have never fully understood why the UAH anomaly was preferred by sceptics, possibly due to the fact that the anomaly always appeared lower because the base period was more recent. Even over a 10 year period, UAH currently has the highest linear trend.
Complain about this comment (Comment number 51)