Key points about scale drawings and maps

- In scale drawings, all the lengths are multiplied by the same A number by which an amount or measurement is multiplied to enlarge or reduce it. so that they remain in the same Used to show how quantities and amounts are related to each other. When one amount changes, the other also changes, as set by proportion rules, eg if 1 item costs 10p, then 5 items cost 50p. when the drawing is made smaller or larger.
- The scale on a map shows how much bigger a real-life distance is compared to the measurement on the map.
- Map scales are written as either a key (for example 1 cm represents 4 km) or as a A ratio compares two or more quantities by using parts of a whole, eg a ratio of 1 : 5 means that for every 1 of the parts on the left, there are 5 of the parts on the right. in the form 1 : 𝑛 or 𝑛 : 1.
Make sure you know how to write ratios in the form 1 : 𝑛 or 𝑛 : 1, and can convert metric units to interpret scale drawings and map scales accurately.
Check your understanding
Scale factors and scale drawings
It is not always possible to draw objects, such as a building, using the real-life measurements, as they are too big or in other cases, too small.
Instead, a scale drawing is used to recreate measurements on a smaller or larger scale.
- A A number by which an amount or measurement is multiplied to enlarge or reduce it. describes how many times bigger the object is in real life. It can be found by dividing the measurement in real life by the measurement in the drawing.
- The measurements within a scale drawing are in the same Used to show how quantities and amounts are related to each other. When one amount changes, the other also changes, as set by proportion rules, eg if 1 item costs 10p, then 5 items cost 50p. to those in real life. If the width is double the length in the drawing, this is also the case in real life.
Follow the working out below
GCSE exam-style questions

- Here is a scale drawing of an apartment block and a tower.
What is the height of the tower in real life?
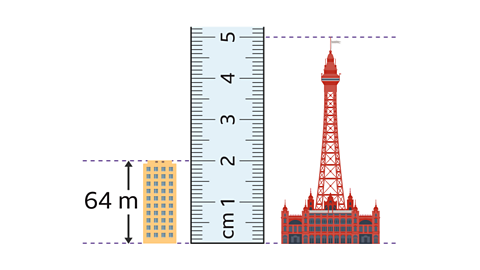
160 m
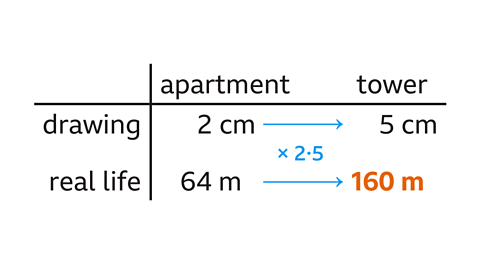
- Write down the measurements of the apartment block (2 cm), and the tower (5 cm) from the drawing.
- Calculate how many times taller the apartment block is compared to the tower.
5 ÷ 2 = 2·5 - The tower is 2.5 times taller than the apartment block. Multiply the real height of the apartment block by 2·5.
64 m × 2·5 = 160 m
- On a scale drawing 42 mm represents 8·4 m in real life.
Write the scale of the drawing as a ratio in the form 1 : 𝑛.
1 : 200
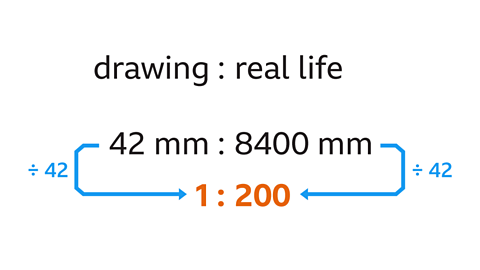
- Convert the units so both lengths are written in mm. 8·4 m = 840 cm = 8400 mm.
- Write the two measurements in a ratio with the scale drawing length as the first part:
42 : 8400 - Divide both parts of the ratio by 42 to give a ratio in the form 1 : 𝑛.
The scale is 1 : 200.
- Dolls’ house furniture is made at a scale of 1 : 12.
If a bed is 1·8 m long in real life, how long is the doll’s bed in centimetres?
15 cm
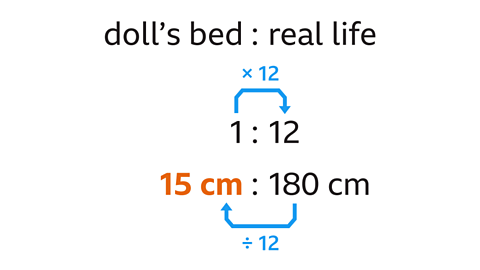
- Convert 1·8 m to cm.
The length of the real bed is 1·8 × 100 = 180 cm. - The ratio 1 : 12 means every 1 cm of the doll's bed is 12 cm in real life.
The scale factor is 12. - Divide the length of the real bed by 12 to find the length of the doll's bed.
180 ÷ 12 = 15 cm
Map scales
A map scale can be written in two ways:
- A measurement-based scale, eg where 1 cm represents 50 km.
- A ratio scale in the form 1 : 𝑛, eg the ratio 1 : 30,000 means that every centimetre on the map represents 30,000 cm in real life.
When a ratio is used as a map scale, the units of each part are the same. Units may need converting, often from cm to km, or km to cm.

Remember
- 1 cm = 10 mm
- 1 m = 100 cm
- 1 km = 1000 m
Follow the working out below
GCSE exam-style questions
- The image shows a map on a centimetre grid.
The actual distance between points A and B is 1800 metres.
What is the scale on the map?
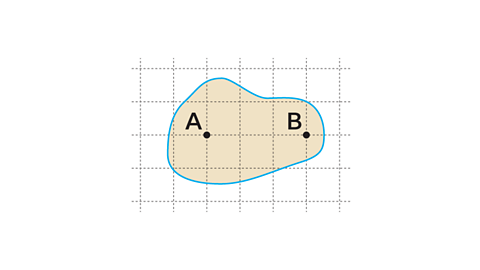
1 : 60,000
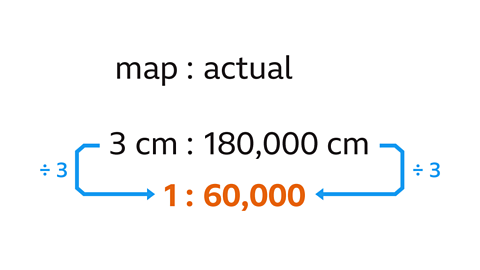
- Write the actual distance in cm to form the same units: multiply 1800 by 100 to convert 1800 m to 180,000 cm.
- The distance on the map is 3 cm. Write the ratio of the map distance to the actual distance as:
3 cm : 180,000 cm. - Write the ratio in the form 1 : 𝑛 by dividing both parts by 3.
The scale is 1 : 60,000.
- The actual distance between Harrogate and Tadcaster is 25 km. A map uses the scale 1 : 500,000.
How far apart are the two towns on the map in centimetres?
5 cm
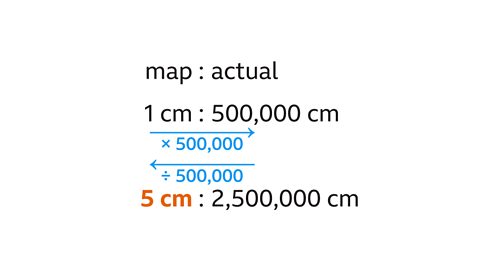
- To convert 25 km into centimetres, multiply by 1000 to convert from km to m, and then by 100 to convert from m to cm:
25 km = 25,000 m = 2,500,000 cm. - Draw a table and label the two parts of the map scale. Write the actual distance of 2,500,000 cm underneath the correct part of the ratio.
- The scale factor from the map distance to the actual distance is 500,000. To go from the actual distance to the map distance, divide by this scale factor:
2,500,000 cm ÷ 500,000 = 5 cm
- The scale on a map is 1 : 40,000.
Jessica wants to go on a walk that is a distance of 7 cm on the map.
What is the actual distance in kilometres?
2·8 km
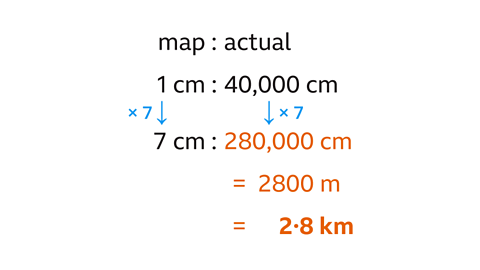
- Find the actual distance in cm.
- 1 : 40,000 means every 1 cm on the map represents 40,000 cm in real life.
- 7 cm must represent 40,000 × 7 = 280,000 cm in real life.
- Convert the distance to metres by dividing by 100.
- 280,000 cm = 2800 m
- Convert to kilometres by dividing by 1000.
- 2800 m = 2·8 km
Note that you can also find the actual distance of 280,000 cm by multiplying 7 cm by the scale factor of 40,000.
Quiz – Scale drawings and maps
Practise what you've learned about scale drawings and maps with this quiz.
Now you've revised map scales and drawings, why not look at this guide on converting fractions, decimals and percentages?
Play Sudoku with BBC Bitesize!
Every weekday we release brand new easy, medium and hard Sudoku puzzles. Perfect for testing your skill with numbers and logic.

More on Ratio, proportion and rates of change
Find out more by working through a topic
- count4 of 8
- count5 of 8

- count7 of 8