Before reading this guide, it may be helpful to read the following guides from Module 3 (M3), Module 6 (M6) and Module 7 (M7).
Functions and graphs
A function is a rule that is applied to one set of values to give another set of values.
A function can be illustrated on a graph – points are plotted as coordinates and joined by either a straight line or a smooth curve.
A linear function has an equation of the form \(y = mx + c\). Its graph is a straight line.
A quadratic function has an equation of the form \(y = ax^{2} + bx + c\) where \(b\) and/or \(c\) can be equal to zero, but \(a\) is not equal to zero. Its graph is a smooth symmetrical curve.
Some examples:
\(y = 5x^{2}\)
\(y = 3x^{2} + 2x – 5\)
\(y = 9 – x^{2}\)
\(y = 2x^{2} – 3x\)
For Module 7 (M7) Graphs, you'll need to know…
- more about quadratic functions and their graphs,
- be able to recognise two further types of functions and graphs – cubic functions and reciprocal functions.
Graphs of quadratic functions
A quadratic graph is produced when you have an equation of the form \(y = ax^{2} + bx + c\), where \(b\) and \(c\) can be zero but \(a\) cannot be zero.
All quadratic graphs have a line of symmetry.
Positive quadratic graphs (where \(a > 0\)) are U-shaped and have a turning point at the bottom of the curve. Negative quadratic graphs (where \(a< 0 \)) are \(\cap\)-shaped, like an inverted U, and have a turning point at the top of the curve.
Plotting a quadratic graph
Example
Draw the graph of \(y = x^{2} – x – 4 \).
Solution
First, we need to complete a table of values:
| \(x\) | –3 | –2 | –1 | 0 | 1 | 2 | 3 | 4 | 5 |
| \(y\) | 8 | 2 | –2 | –4 | –4 | –2 | 2 | 8 | 16 |
Then plot these points and join them with a smooth curve.
Points of intersection with straight lines
At the point (or points) where two graphs intersect, the \(x\) and \(y\) values are the same for both functions. We use this information to find the solution to simultaneous linear equations.
Simultaneous equations where one of the graphs is quadratic and the other is a straight line can also be solved by reading the points of intersection.
Example
The graph of \(y = x^{2} – x – 2\) has been drawn below.
On the same grid, draw the line \(y = x + 1\). Write down the coordinates of the points of intersection of the two graphs.
Solution
To draw the line \(y = x +1\), chose three values of \(x\)
when \(x = 0, y = 1 \)
\(x = 1, y = 2 \)
\( x = 2, y = 3\)
Plot the points \((0, 1) (1,2)\) and \((2, 3)\)
Join the points with a straight line extending it to the edges of the grid.
To draw a straight line from its equation, you only need three points. If they do not lie on a straight line, one or more of your points is wrong and you need to check your accuracy when you substituted the \(x\) values.
Read the points of intersection from the graph.
The line crosses the curve at \((-1,0)\) and \((3,4)\)
Answer
\((-1,0)\) and \((3,4)\)
In the example, the points of intersection of \(y = x^{2} – x – 2\) and \(y = x + 1\) give a solution to the equation \(x^{2} – x – 2 = x + 1\)
Question
Complete the table for \(y = 5 + 6x – x^{2}\) and draw its graph.
| \(x\) | −1 | 0 | 1 | 2 | 3 | 4 | 5 |
| \(y\) | −2 | 10 | 14 | 13 |
On the same grid, draw a suitable straight line to solve the equation \(5 + 6x – x^{2} = x + 7\)
Answer
The quadratic equation has a negative \(x^{2}\) coefficient, so we are expecting an upside down U-shaped curve, \(\cap\). Plot the points from the table and join them with a smooth curve.
When \(x = 0, y = 5 + 6(0) – (0)^{2} = 5\)
When \(x = 2, y = 5 + 6(2) – (2)^{2} = 5 + 12 – 4 = 13\)
When \(x = 4, y = 5 + 6(5) – (5)^{2} = 5 + 30 – 25 = 10\)
| \(x\) | −1 | 0 | 1 | 2 | 3 | 4 | 5 |
| \(y\) | −2 | 5 | 10 | 13 | 14 | 13 | 10 |
To solve the equation \(5 + 6x – x^{2} = x + 7\), draw the line \(y = x + 7\)
When \(x = 0, y = 7\)
\( x = 2, y = 9\)
\(x = 4, y = 11\)
Plot the points \((0, 7) (2, 9)\) and \((4, 11)\).
Draw a straight line through the points and across the grid.
Read the \(x\) values of the points of intersection from the graph. They will be estimated values as they fall between two integers.
Answer
\(x \approx 0.4\) and \(x \approx 4.6\)
Cubic graphs
A cubic equation contains only terms up to and including \(x^{3}\).
Here are some examples of cubic equations:
\(y = x^{3}\)
\(y = x^{3} + 5\)
Cubic graphs are curved, but can have more than one change of direction.
Example
Draw the graph of \(y = x^{3}\).
Solution
First, we need to complete our table of values:
| \(x\) | −2 | −1 | 0 | 1 | 2 |
| \(y\) |
when \(x = −2, y = (−2 \times −2 \times −2) = −8\)
when \(x = −1, y = (−1 \times −1 \times −1) = −1\)
when \(x = 0, y = (0 \times 0 \times 0) = 0\)
when \(x = 1, y = (1 \times 1 \times 1) = 1\)
when \(x = 2, y = (2 \times 2 \times 2) = 8\)
| \(x\) | −2 | −1 | 0 | 1 | 2 |
| \(y\) | −8 | −1 | 0 | 1 | 8 |
The graph will look like this:
Question
Draw the graph of \(y = x^{3} + 5\).
First, we need to complete our table of values:
| \(x\) | −2 | −1 | 0 | 1 | 2 |
| \(y\) |
when \(x = −2, y = (−2 \times −2 \times −2) + 5 = −3\)
when \(x = −1, y = (−1 \times −1 \times −1) +5 = 4\)
when \(x = 0, y = (0 \times 0 \times 0) = 0 + 5 = 5\)
when \(x = 1, y = (1 \times 1 \times 1) = 1 + 5 = 6\)
when \(x = 2, y = (2 \times 2 \times 2) = 8 + 5 = 13\)
| \(x\) | −2 | −1 | 0 | 1 | 2 |
| \(y\) | −3 | 4 | 5 | 6 | 13 |
The graph will then look like this:
Reciprocal graphs
A graph of the form \(y = \frac{1}{x}\) is known as a reciprocal graph and once drawn, looks like this:
| \(x\) | −5 | −4 | −3 | −2 | −1 | 0 | 1 | 2 | 3 | 4 | 5 |
| \(y = \frac{1}{x}\) | −0.2 | −0.25 | −0.33 | −0.5 | –1 | No value | 1 | 0.5 | 0.33 | 0.25 | 0.2 |
Summary of graph shapes

\(y = ax^{2} + bx + c\)

\(y = ax^{3} + bx^{2} + cx +d\)

\(y = \frac{a}{x}\)
Test yourself
Question
Using a grid similar to the one, complete the table and use it to draw the graph of \(y = 2x^{2} + x – 6\) for \(–3 \leq x \leq 3\).
By drawing a straight line on the same grid, find solutions to the equation \(2x^{2} + x – 6 = –x + 2\)
| \(x\) | –3 | –2 | –1 | 0 | 1 | 2 | 3 |
| \(y\) | 9 | 0 | –6 | 4 |
Answer
| \(x\) | −3 | −2 | −1 | 0 | 1 | 2 | 3 |
| \(y\) | 9 | 0 | −5 | −6 | −3 | 4 | 15 |
Now draw the line \(y = –x + 2\).
When \(x = 0, y = 2\)
When \(x = 2, y = 0\)
When \(x = –2, y = 4\)
Plot these points and draw a straight line across the grid.
The points of intersection are \(x \approx –2.7\) and \(x \approx 1.5\).
Question
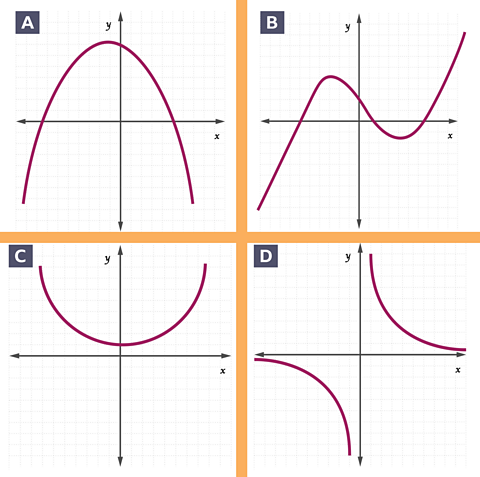
Match each of the graphs above with the equations below.
- \(y = 2x^{2}–3x + 7\)
- \(y = \frac{2}{x}\)
- \(y = 2x^{3}–10x + 7\)
- \(y = –2x^{2} + 7\)
Answers
- Graph C shows the equation \(y = 2x^{2} –3x + 7\).
- Graph D shows the equation \(y = \frac{2}{x}\).
- Graph B shows the equation \(y = 2x^{3} – 10x + 7\).
- Graph A shows the equation \(y = –2x^{2} + 7\).
More on M7: Number
Find out more by working through a topic
- count1 of 3