Key points

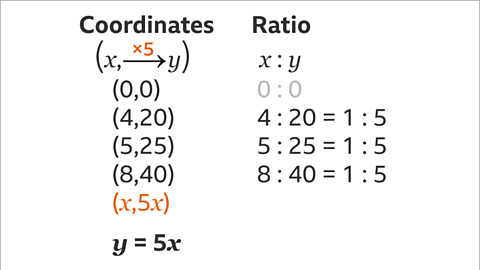
- When one variable is zero so is the other. As one variable increases the other does at the same rate. When 𝒚 is plotted against 𝒙 this produces a straight-line graph through the origin. is where the variables move in the same direction and by the same proportion. As one A quantity that can take on a range of values. increases or decreases so does the second variable at the same rate. When the value of \(x\) is multiplied by 10, \(y\) is also multiplied by 10. When \(x\) is halved, \(y\) is also halved. So \(x∶y\) is always the same. The notation and the general equation for \(y\) being directly proportional to \(x\) is \(y=nx\).
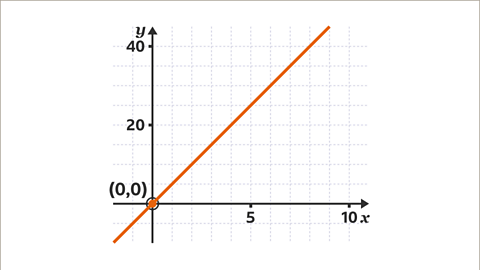
- A graph showing direct proportion is a straight line passing through the The reference point in a coordinate system from which all other measurements are taken. This point has the coordinates 0, 0 and is usually labelled with the letter O., which is the coordinate (0, 0). When \(x=\) 0, \(y=\) 0
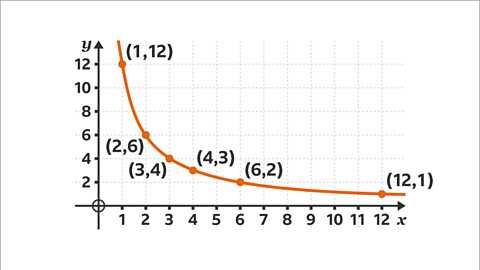
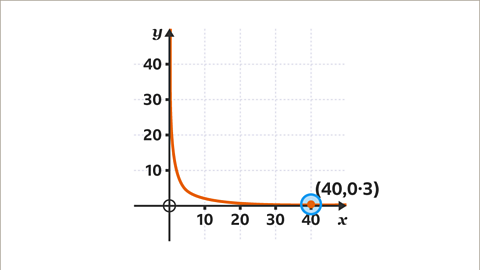
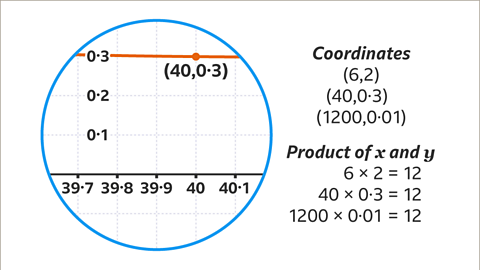
- The notation and the general equation for When two variables have a product that is constant, they are inversely proportional. For example, a rectangle with a fixed area of 20 cm² has a length and width that will always multiply together to give 20. The lengths and widths of these rectangles are inversely proportional. graphs is \(y=\frac{k}{x}\). The product of the two variables, \(x\) and \(y\), is always \(k\). For \(k=\) 20, when \(x=\) 4, then \(y=\) 5. When \(x=\) 20, then \(y=\) 1
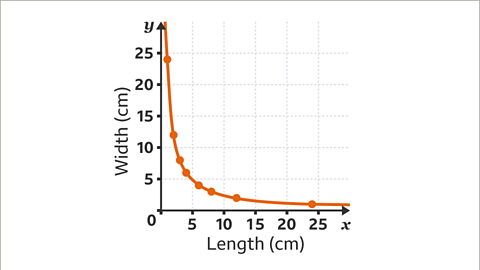
- A graph showing inverse proportion is a curve. The curve gets closer to the axes as \(x\) and \(y\) reach Very large and very small values are referred to as extreme values.. As one variable increases, the second variable decreases at the same rate. When the value of \(x\) is multiplied by 10, \(y\) is divided by 10. When \(x\) is halved, \(y\) is doubled.
- Graphs are drawn by plotting pairs of values \((x,y)\), named The ordered pair of numbers (𝒙, 𝒚) that defines the position of a point is the coordinate pair (or the coordinates.). A direct proportional graph is drawn plotting three coordinates. An inverse proportional graph requires more points to give an accurate curve.
How to recognise whether graphs show direct or inverse proportion
If a graph shows direct proportion:
- the graph is a straight line
- the line goes through the origin (0, 0)
- for any coordinate \((x,y)\), \(x : y\) is constant
- the equation of the line has the general form \(y=nx\)
If a graph shows inverse proportion:
- the graph is a curve
- the curve does not cross either axis
- for any coordinate \((x,y)\), the product of \(x\) and \(y\) is always the same \((xy=k)\)
- the equation of the curve has the general form \(y=\) \( \frac{k}{x}\) for each coordinate
Examples
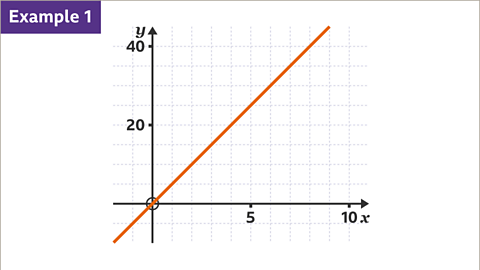
Image caption, Explain why this graph shows direct proportion.


1 of 8
Question
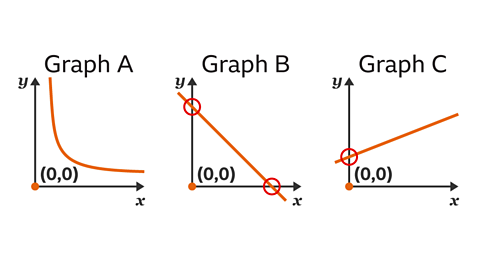
Explain why none of these graphs shows direct proportion.
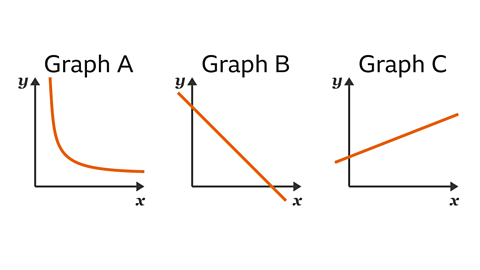
A graph shows direct proportion when the graph is a straight line, and the line goes through the origin (0, 0).
Graph A is not a straight line, so does not show direct proportion.
Graph B is a straight line, however the line does not pass through the origin (0, 0), so the graph does not show direct proportion.
Graph C is a straight line, however the line does not pass through the origin (0, 0), so the graph does not show direct proportion.
How to draw a direct proportion graph using real-life data
To draw a graph for direct proportion:
Identify the ratio between the variables \((x:y)\).
Draw a table of values. Use the ratio to complete the table.
- The first coordinate is always (0, 0).
- One coordinate repeats the given ratio.
- Multiply to find at least one other coordinate.
- Three coordinates are needed, although more may be plotted.
Plot the coordinates.
Draw a straight line through the points and through the origin (0, 0).
Examples
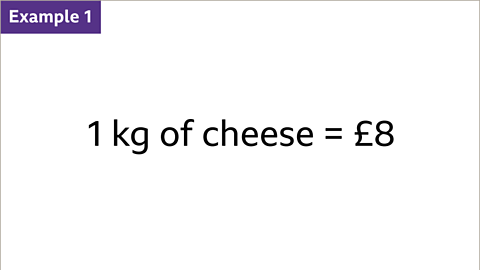
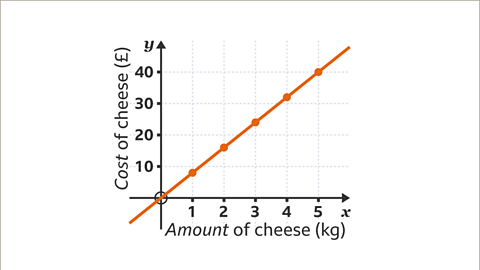
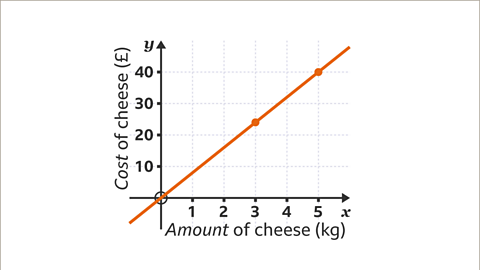
Image caption, 1 kg of cheese costs £8. Draw a graph of the amount of cheese (𝒙) against the cost (𝒚). Draw the graph to show the cost of up to 5 kg of cheese.


1 of 9
Question
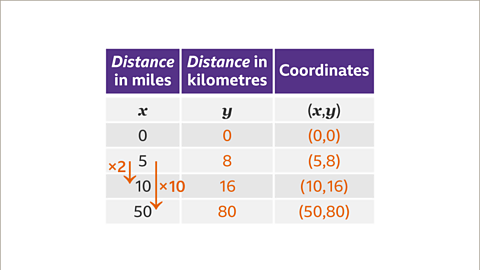
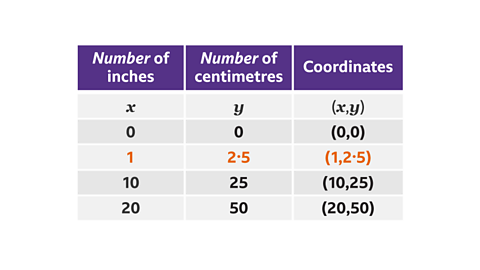
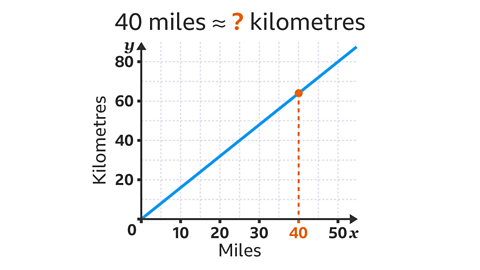
One inch is approximately 2∙5 centimetres. Complete the table of values for the coordinates to be plotted.
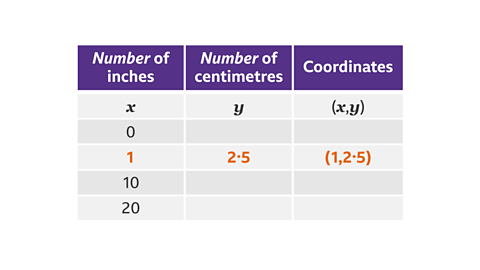
A length measured in inches is directly proportional to the length measured in centimetres.
The ratio inches : centimetres is always 1 : 2∙5
Multiply the length in inches by 2∙5 to find the length in centimetres.
Zero inches is the same as zero centimetres.
10 inches are 10 × 2∙5 = 25 (centimetres).
20 inches are 20 × 2∙5 = 50 (centimetres).
The coordinates are (0, 0), (1, 2∙5), (10, 25) and (20, 50).
How to draw a graph for inverse proportion
To draw a graph for inverse proportion:
Identify the constant The result of multiplying one number by another, eg the product of 4 and 5 is 20 since 4 × 5 = 20 of the variables \((x)\).
Draw a table of values. Find Two numbers that, when multiplied together, make a selected whole number. Eg, 3 and 4 are multiplied together to make 12 so 3 and 4 are a factor pair of 12. A whole number may have one or more factor pairs. of the product to complete the table.
- Each pair will have the same product.
- Several coordinates are needed because the graph is a curve.
Plot the coordinates.
Draw a smooth curve through the points.
Example
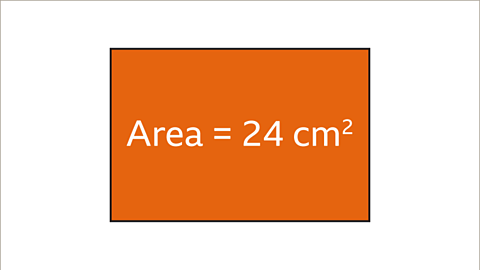
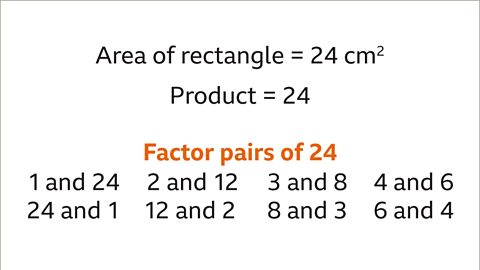
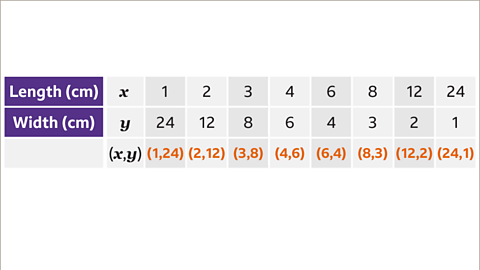
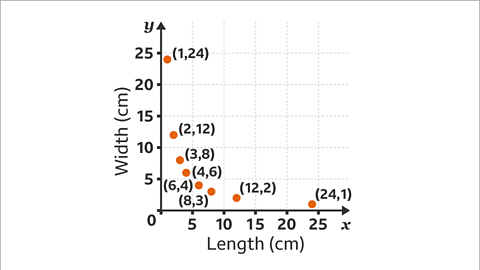
Image caption, A rectangle has a fixed area of 24 cm². Draw the graph of the length of the rectangle (𝒙) against its width (𝒚).

1 of 6
Question
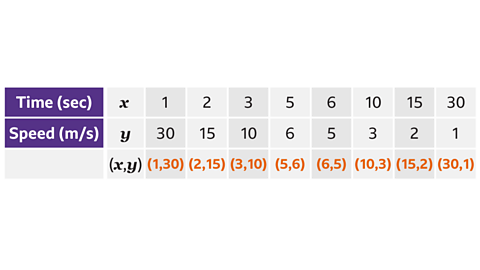
An object travels 30 metres. Complete the table of values for the coordinates (time and speed) to be plotted.
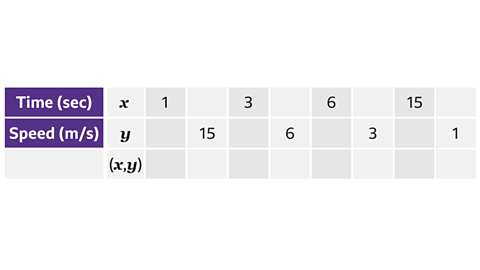
The distance is 30 metres. The constant product of speed × time is 30
The factor pairs of 30 are 1 and 30, 2 and 15, 3 and 10, 5 and 6
These are used to find the coordinates that are needed for the graphs.
The coordinates needed are:
(1, 30), (2, 15), (3, 10), (5, 6), (6, 5), (10, 3), (15, 2) and (30, 1).
Practise drawing direct and inverse proportion graphs
Practise drawing direct and inverse proportion graphs in this quiz. You may need a pen and paper to complete these questions.
Quiz
Play Sudoku with BBC Bitesize!
Every weekday we release brand new easy, medium and hard Sudoku puzzles. Perfect for testing your skill with numbers and logic.

More on Direct and inverse proportion
Find out more by working through a topic
- count4 of 4
- count1 of 4

- count2 of 4