Key points

Conversion graphs are used to change one unit into another. For example, changing between miles and kilometres or pounds sterling to a foreign currency. These units are When one variable is zero so is the other. As one variable increases the other does at the same rate. When 𝒚 is plotted against 𝒙 this produces a straight-line graph through the origin..
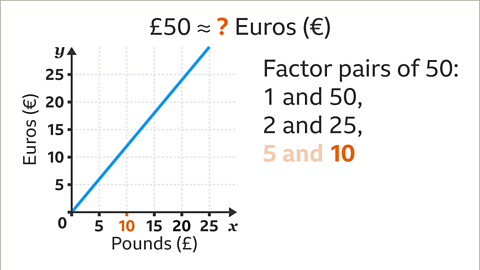
For A quantity that can take on a range of values. In a conversion graph the variables usually represent measurements in different units. that are directly proportional, larger values may be found by Multiply by an amount to get a larger value. For example, the coordinate (5, 8) can be scaled up by multiplying by 10 to give (50, 80). the values. Converting £50 to euros may be When a precise conversion is not possible, approximate values are used. The symbol for 'approximately equal to' is ≈ by first converting £10 to euros and then multiplying the result by 5. This is because 10 × 5 = 50
It is also possible to have a conversion graph to switch between units that are not directly proportional. For example, temperature can be measured in degrees Centigrade (°C) and degrees Fahrenheit (°F). These units increase at a fixed rate but 0°C is 32°F not 0°F.
Video
Watch the video to learn how graphs can make converting between two different sets of units easy.
A conversion graph is a way of representing the relationship between two sets of variables that vary in direct proportion, like miles to kilometres, Celsius to Fahrenheit or pints to litres.
To make a conversion graph first create the axes, remembering to label them. For example, miles and kilometres.
5 miles is approximately 8 kilometres. So plot a point, based on the values 5 and 8. Drawing a straight line through it from the origin, creates the graph. The origin is 0, 0 because 0 miles travelled is also 0 kilometres travelled.
The graph can be used to convert any value from one scale to the other. For example, 4 miles is approximately 6.4 kilometres and 4 kilometres is approximately 2.5 miles.
Another way to plot the graph is to use the conversion rate. For miles to kilometres that's 1.6 kilometres per mile to one decimal place. Every additional one to the right corresponds to moving up 1.6. The conversion rate is also the gradient of the graph. In this case 1.6 kilometres per mile.
From driving to exchanging money, graphs help make converting easy.
How to use a conversion graph to convert from one unit to another
To convert from an amount with units on the \(x\)The line on a graph that runs horizontally (left-right) through the origin. It is used as a reference to measure from. :
- On the \(x\)-axis, locate the given amount.
- Draw a vertical line, using a ruler, from the given amount up to the The diagonal line in a conversion graph used to convert one unit to another..
- Draw a horizontal line, using a ruler, from the conversion line across to the \(y\)-axis.
- Read the value on the \(y\)-axis.
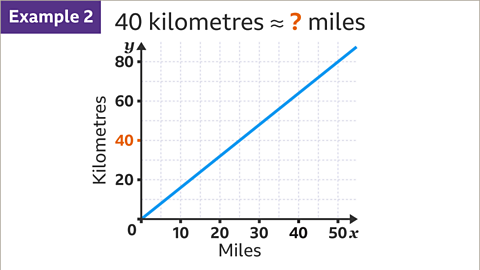
To convert from an amount with units on the \(y\)The line on a graph that runs vertically (up-down) through the origin. It is used as a reference to measure from.:
- On the \(y\)-axis, locate the given amount.
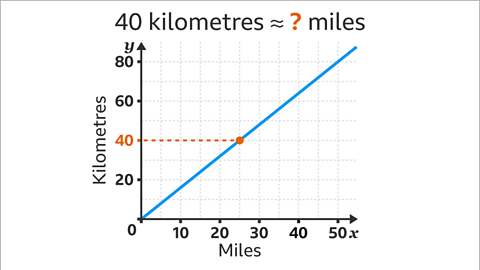
- Draw a horizontal line, using a ruler, from the given amount across to the conversion line.
- Draw a vertical line, using a ruler, from the conversion line down to the \(x\)-axis.
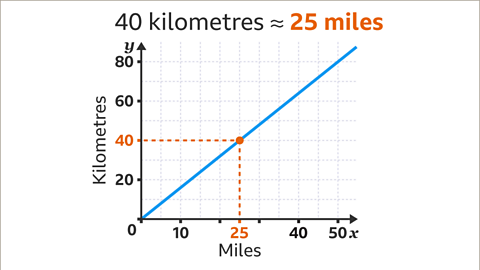
- Read the value on the \(x\)-axis.
Examples
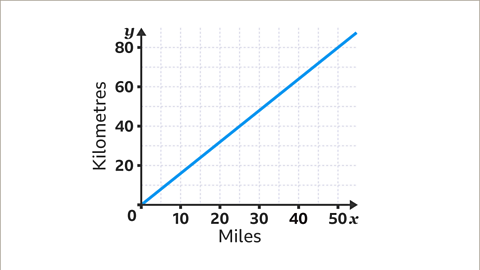
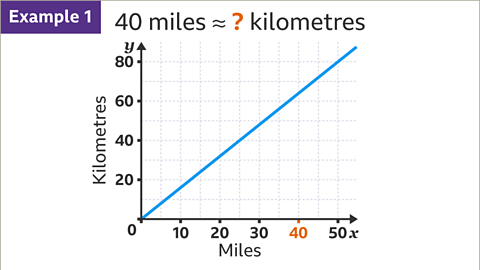
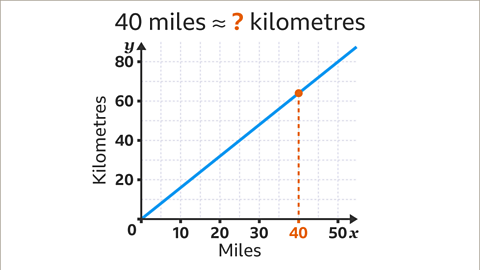
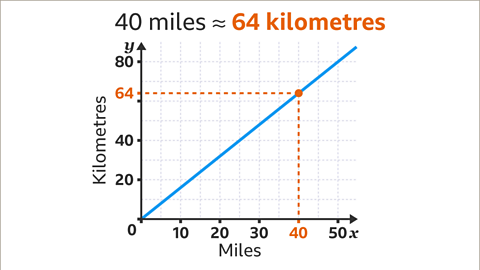
Image caption, This graph can be used to convert between miles and kilometres.
1 of 7
Question
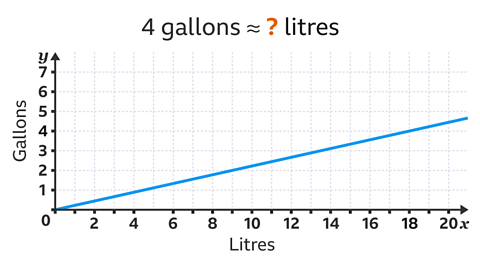
Use the conversion graph below to convert 4 gallons into litres.
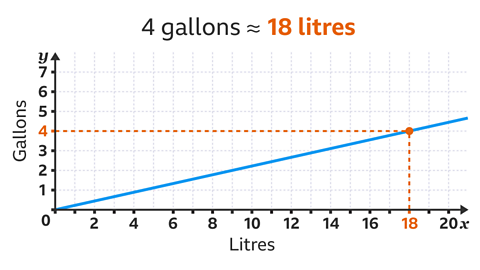
On the \(y\)-axis, locate the given amount (4 gallons).
Draw a horizontal line from 4 gallons across to the conversion line.
Draw a vertical line from the conversion line down to the \(x\)-axis.
The value on the \(x\)-axis is 18. 4 gallons is approximately 18 litres.
How to find larger values by scaling up
For conversion graphs based on As one variable increases the other variable increases at the same rate and when one is zero the other is also zero. For example the amount of cattle feed and its cost are directly proportional., a value can be scaled up to find larger values.
To find larger values by scaling up:
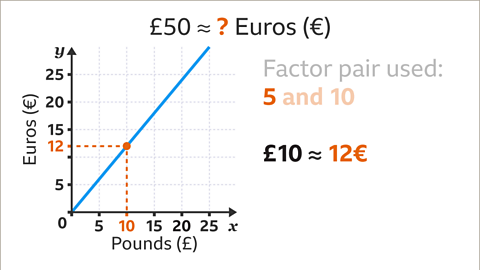
- Find Two numbers that, when multiplied together, make a selected whole number. Eg, 3 and 4 are multiplied together to make 12 so 3 and 4 are a factor pair of 12. A whole number may have one or more factor pairs. of the amount to be converted (the initial amount).
- Use the largest factor of the initial amount that can be read on the relevant axis, to find a conversion amount from the graph.
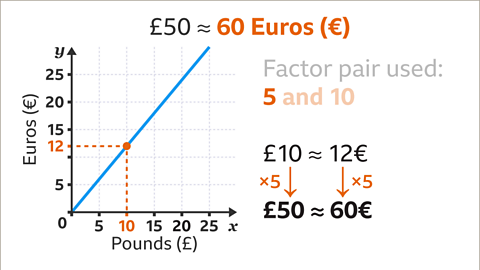
- Scale-up the conversion amount by multiplying by the factor that completes the factor pair.
Example
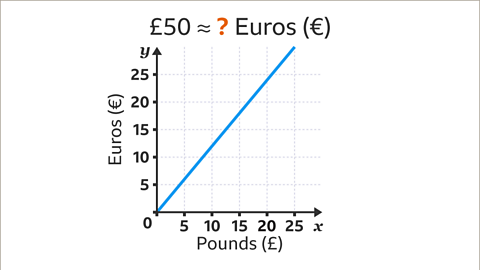
Image caption, This graph is used to convert between pounds (£) and euros (€). Convert £50 to €. (Note: This is an example, exchange rates are variable).
1 of 4
Question
Use the miles to kilometres conversion graph to convert 400 kilometres into miles.
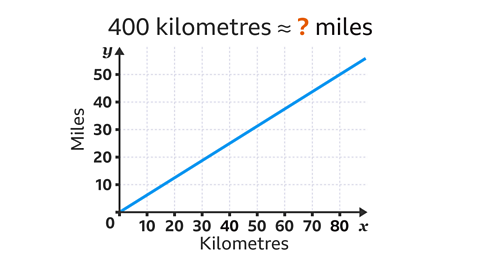
The kilometres axis does not go up to 400 kilometres.
A lower reading can be scaled up to find the conversion.
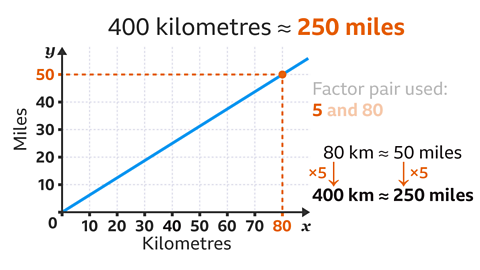
The factor pair with the largest factor of 400 that can be read from the graph is 80 (80 × 5 = 400).
80 kilometres are approximately 50 miles.
Scale up the conversion by multiplying by the factor that completes the factor pair (5). 50 × 5 = 250
400 kilometres is approximately 250 miles.
Practise using conversion graphs
Practise using conversion graphs with this quiz. You may need a pen and paper to help you work out your answers.
Quiz
Play Sudoku with BBC Bitesize!
Every weekday we release brand new easy, medium and hard Sudoku puzzles. Perfect for testing your skill with numbers and logic.

More on Direct and inverse proportion
Find out more by working through a topic
- count1 of 4
- count2 of 4