Key points

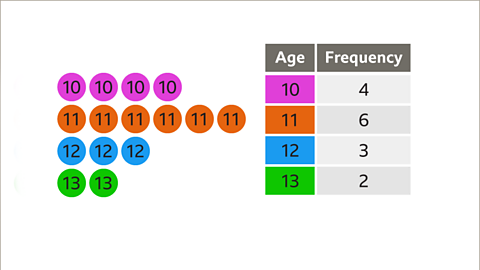
A set of data can be presented in a The number of times something occurs. table instead of a long list of numbers. A frequency table shows how many times a value occurs.
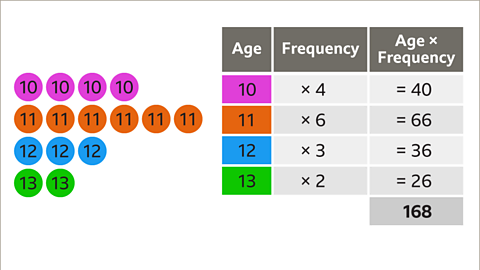
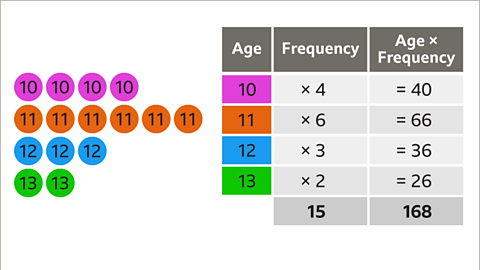
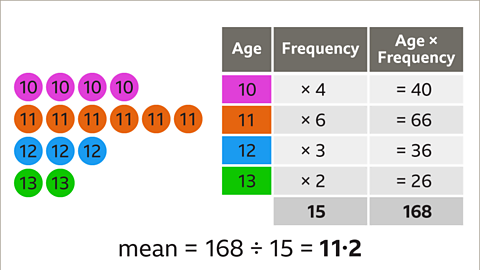
To find the sum of all the values, multiply each category by its frequency and then find the total of the results. The sum of all the frequencies shows how many values there are. The mean is the sum of all the values divided by how many values there are.
The A type of average calculated by finding the value that occurs most often. The mode can have one value, more than one value, or no value. from a frequency table is the value that has the highest frequency.
The The difference between the highest and lowest values in a set of numbers. measures how spread out the data is. It is the difference between the lowest and highest value.
How to find the mean from a frequency table
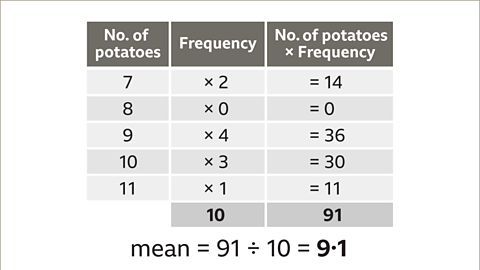
The The most commonly used measure of average. To calculate the mean from a list of numbers, add the values together and divide the total by the number of values. from a list is calculated by adding all the values and dividing by how many values there are. When data is shown in a frequency table, these figures are found by carrying out calculations using the rows and columns.
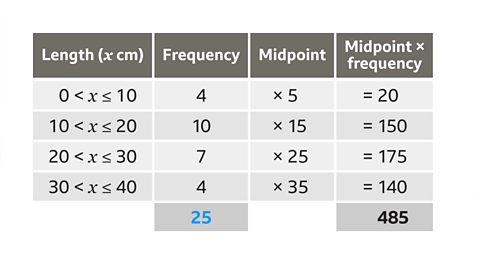
To find the mean from a frequency table:
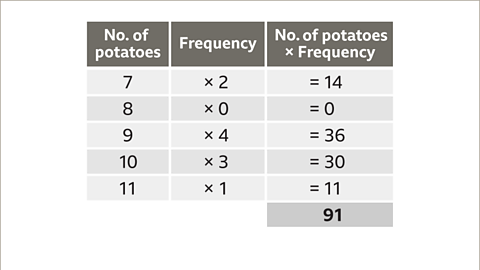
- Set up a new column to multiply each category by its frequency.
- Find the sum of the new column. This finds the total of all the values in the frequency table.
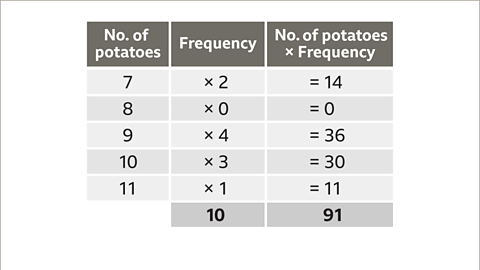
- Add the frequencies to find how many values there are.
- Divide the total of all the values by how many values there are.
Examples
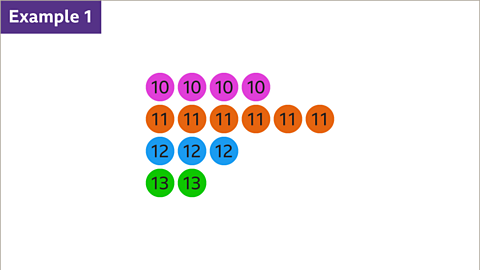
Image caption, Each circle represents a child who attended a summer school, along with their age.


1 of 10
Questions
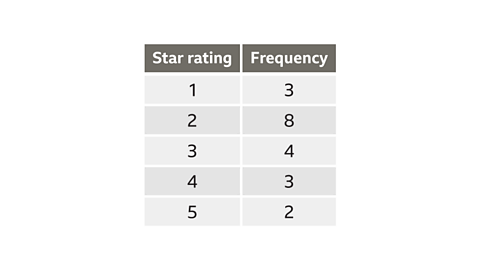
1. Finding the mode
The table shows the star rating for 20 hotels.
What is the mode star rating?
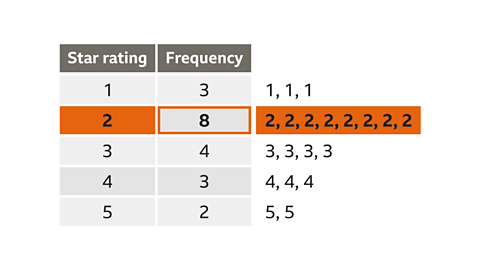
The mode is the most common value.
If the values were presented in a list, it would be clear that the mode is 2
When looking at the table, the most common star rating is the star rating that has the highest frequency. The highest frequency is 15. These 15 hotels have a star rating of 2. Therefore, the mode star rating is 2
2. Finding the range
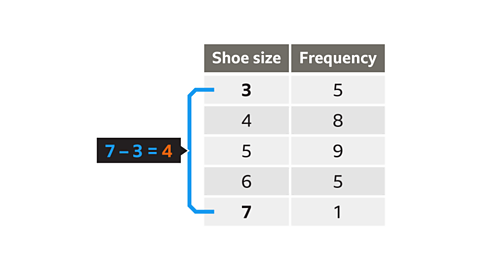
The table shows the shoe sizes of a class of students.
What is the range?
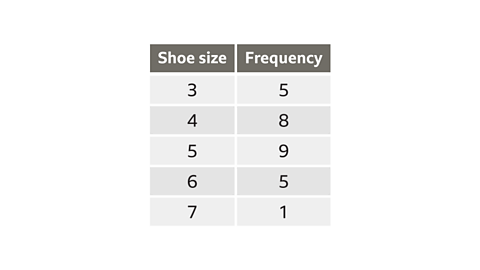
The range is the difference between the lowest and highest shoe size.
The lowest shoe size is 3
The highest shoe size is 7
The range is 7 - 3 = 4
Practise working out mean, mode and range from a frequency table
Practise working out mean, mode and range from a frequency table with this quiz. You may need a pen and paper to help you with your answers.
Quiz
Real-life maths

Data obtained from customer satisfaction surveys can often contain hundreds or thousands of values. Presenting the data as a table makes it much easier to analyse and make conclusions.
Calculating A single ‘typical’ value that is used to represent a set of values. The most commonly used averages are mean, median and mode. and ranges from survey data gives insight into the overall satisfaction level of customers. By identifying areas where satisfaction is high or low, companies can make data-driven decisions to improve their products or services.
Play Sudoku with BBC Bitesize!
Every weekday we release brand new easy, medium and hard Sudoku puzzles. Perfect for testing your skill with numbers and logic.

More on Averages
Find out more by working through a topic
- count4 of 4
- count1 of 4
- count2 of 4