Key points
An average is a single ‘typical’ value that is used to represent a set of values. There are three main types of average. They are called the The most commonly used measure of average. To calculate the mean, add the values together and divide the total by the number of values., A type of average calculated by finding the middle value of a set of numbers in ascending order. If there are two middle numbers, the median is the mean of those two numbers. and A type of average calculated by finding the value that occurs most often. The mode can have one value, more than one value, or no value. .
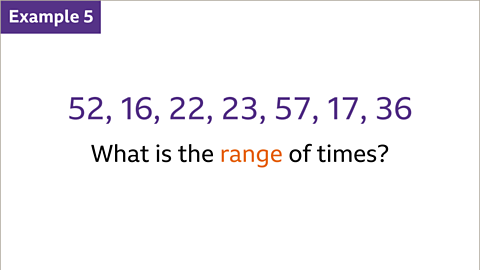
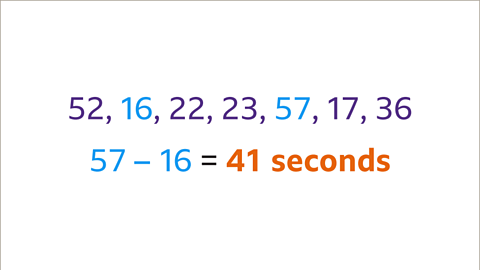
The The difference between the highest and lowest values in a set of numbers. is not an average. It is a measure of how spread out the values are. It is calculated by subtracting the lowest value from the highest value.
Together with the range, averages are used to summarise data. The most appropriate average to use depends on the data values, and what conclusions need to be made.
An average is meant to reflect a typical value. The average used needs to take into account any A value that is an unusual result that lies well beyond the rest of the data. that could If a set of data is skewed, it is not evenly spread out. An average could be skewed because of an unusually high or low value. This would make the average higher or lower than would be expected. the average.
Video
Different types of averages appear all the time in the world of sport. Watch Steph, a sports coach, talk about how the mean, median and mode are useful in team sports and in other events such as gymnastics.
Bobby: You’re a sports coach, but how did you get into sports?
Steph: So, I played loads of sports growing up, all kinds of sports. And then I got into watching sports in my local area and on TV, where I watched things like the Football World Cup and the Olympics.
Bobby: What did you learn from watching things like the Olympics?
Steph: So, one thing I learned is that sports have different scoring systems. So with football, for example, you would take how many goals were scored but in gymnastics, the gymnast would do a routine and then there are a number of judges that will give that routine a score. And then the average of those scores is calculated to come up with the final score for the gymnast.
Bobby: Ah, so that’s the mean average, and let’s say we were thinking about the median average where we look at the middle value of a set of data. Where might you see that?
Steph: Not so much in scoring, but you might use it, for example, if you have a football team and you want to see what the average height is, and you don’t want the shortest player on the team and the tallest player on the team, maybe your goalkeeper, todistort that, you might look at the middle point to choose the average height there.
Bobby: Would you ever use the mode, which is where you look at the most common piece of data?
Steph: Yeah, you might use the mode, for example, in a football game, to see when a goal is most likely to be scored. So, is it the first ten minutes, the last ten minutes or somewhere in between? Then if you know your opponent will be looking to attack then, you can better defend against them.
Bobby: Where else might you see averages?
Steph: All over sports, particularly on the data side. So, you might see an average of goals scored, assists, minutes played, but you might see it in off-the-pitch stuff as well, such as the finances and the money that comes into your sports club.
Types of averages and the range
There are three main types of A single ‘typical’ value that is used to represent a set of values. The most commonly used averages are mean, median and mode. that can be calculated to show a typical value from a set of data:
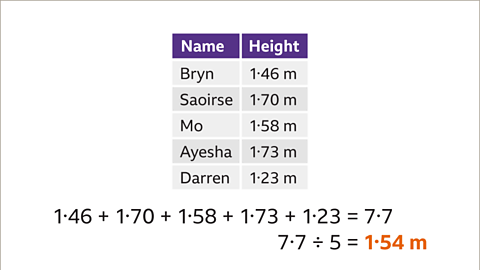
- The mean is the most commonly used average. It is found by finding the total of the values and dividing by how many values there are.
- The median is an average that is found by listing the values in order and finding the middle value.
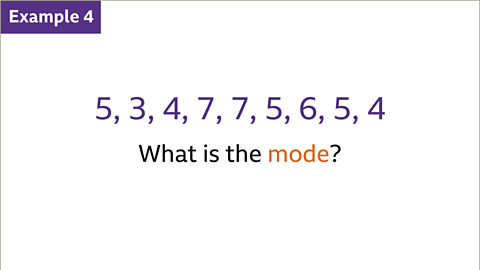
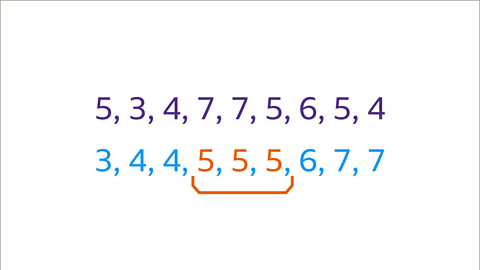
- The mode is the value that occurs most often. This average can be used for non-numerical values, eg ‘red’.
The range is not an average. Instead, it is used to show how varied the data is.
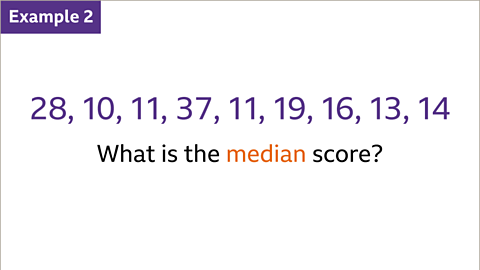
Examples
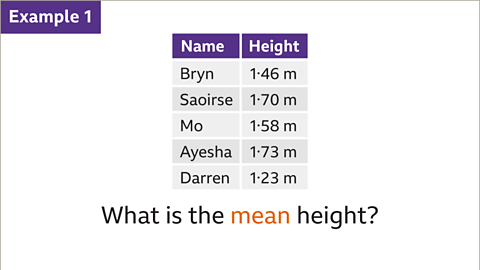
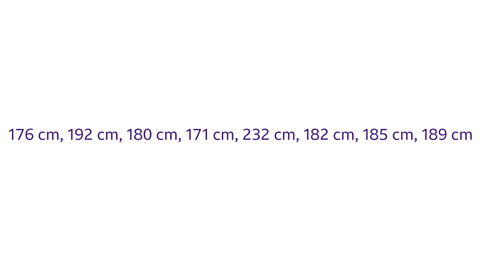
Image caption, The table shows the heights of five students. Use a calculator to find the mean height.
1 of 10
Question
Which average would be the most appropriate to summarise this set of heights?
Why would the other two averages not be appropriate?
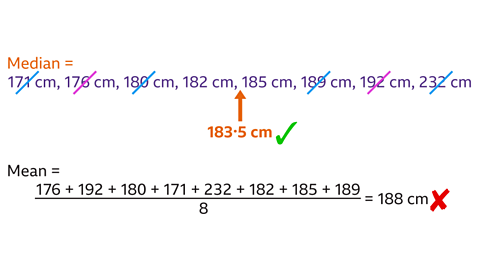
The best average to use would be the A type of average calculated by finding the middle value of a set of numbers in ascending order. If there are two middle numbers, the median is the mean of those two numbers..
232 cm is much higher than the other heights, and is an A value that is an unusual result that lies well beyond the rest of the data. in the data. It might be a height that has been measured or written incorrectly, or it could just be a value that is different to the others in the set.
An average is meant to reflect a typical value. If the mean was used to summarise the data, the A value that is an unusual result that lies well beyond the rest of the data. would be included in the calculation, and would If a set of data is skewed, it is not evenly spread out. An average could be skewed because of an unusually high or low value. This would make the average higher or lower than would be expected. the average. However, the median is much less affected by the outlier.
There is no mode because each value appears once, so the A type of average calculated by finding the value that occurs most often. The mode can have one value, more than one value, or no value. would not be useful to show a typical height.
Practise mean, median, mode and range
Quiz
Practise calculating and interpreting mean, median, mode and range with this quiz. You may need a pen and paper to help you with your answers.
Real-life maths
Supermarkets use averages to keep track of sales, and to order the right amount of stock for the future.
The mode can be used to show which item is selling most and therefore needs a higher order. The mean can be used to calculate the average annual sales of a certain product over a year.
A median value would be better to use if the supermarket didn’t want figures to be affected by unusually higher sales in December, for example.
The range can also be used to show if there are wide variations in sales over the year, or whether a similar amount of stock is sold every month.
Play Sudoku with BBC Bitesize!
Every weekday we release brand new easy, medium and hard Sudoku puzzles. Perfect for testing your skill with numbers and logic.

More on Averages
Find out more by working through a topic
- count2 of 4
- count4 of 4