Key points

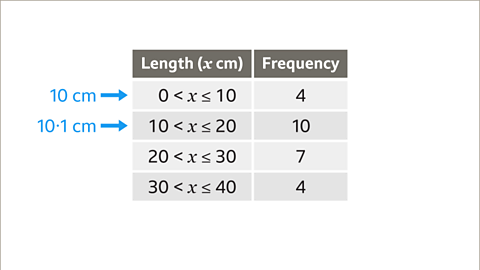
A grouped frequency table is a way of presenting data in groups called A group created to contain a set of data. For example, the class 10 < 𝒙 < 20 contains values of 𝒙 bigger than 10 and less than or equal to 20. Calculating the mean from a grouped frequency table uses a similar method to calculating the The most commonly used measure of average. To calculate the mean from a list of numbers, add the values together and divide the total by the number of values. from an ungrouped frequency table.
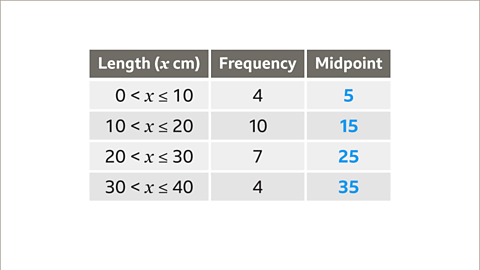
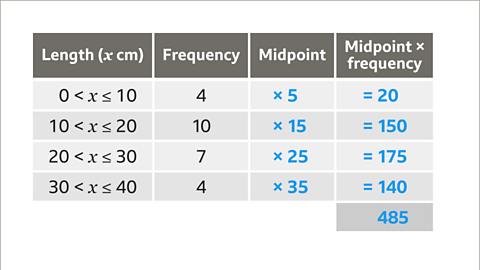
The The middle of two values or coordinates. of each group is used as an To guess roughly or give an approximate value. value because the exact values of each piece of data cannot be seen. A new column is created for the midpoints of each group multiplied by the The number of times something occurs.. This column is totalled, and divided by the total frequency to find an estimate for the mean.
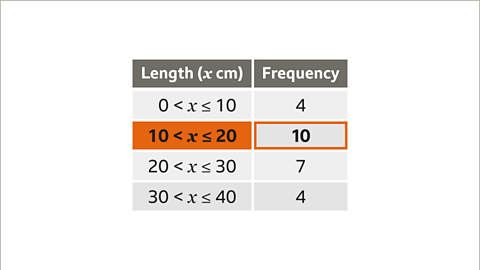
The The group in a grouped frequency table that contains the most pieces of data. It is the group with the highest frequency. is the group in a frequency table that has the highest frequency.
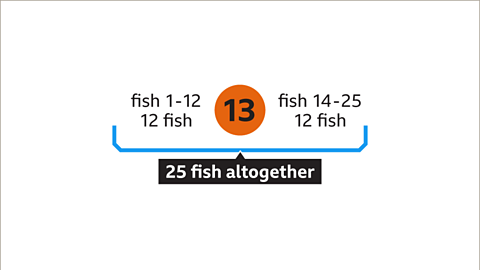
The class that contains the A type of average calculated by finding the middle value of a set of numbers. If there are two middle numbers, the median is the mean of those two numbers. If there are 𝒏 values, the median is the ⁿ⁺¹⁄₂th value. value, is the group that contains the middle value. If there are \(n\) values, the middle value is the \( \frac{𝒏+1}{2} \)th value.
To find the modal class, identify the class with the highest frequency.
How to find averages in grouped frequency tables
- To calculate an estimate for the mean from a grouped frequency table:
- Set up a new column to write the midpoint of each class.
- Set up another column to multiply each midpoint by its frequency.
- Find the sum of the multiplications. This finds the estimated total of all the values in the frequency table.
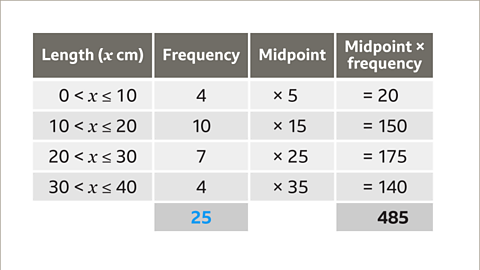
- Add the frequencies to find how many values there are.
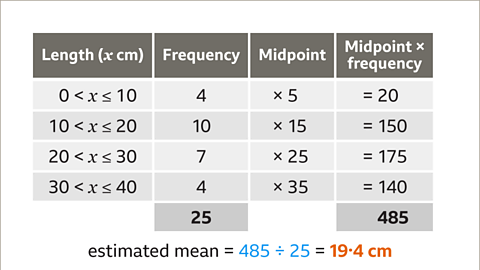
- Divide the total of all the values by how many values there are.
To find the class that contains the median, identify the class that contains the middle value. For a set of data with \(n\) values, the middle value is the \( \frac{𝒏+1}{2} \)th value.
To find the modal class, identify the class with the highest frequency.
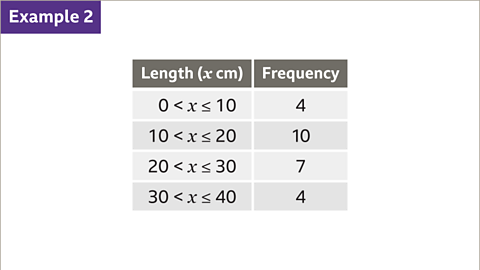
Examples
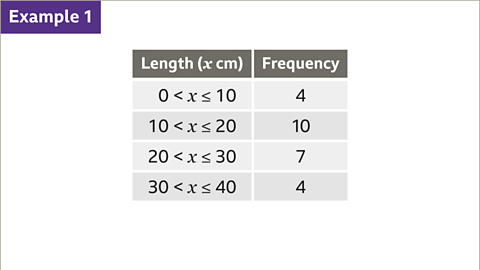
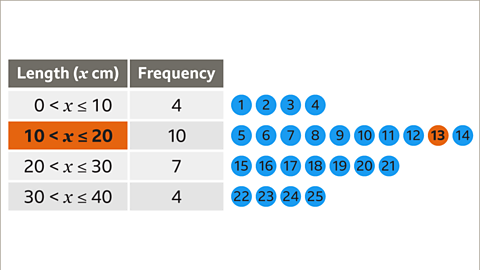
Image caption, The table shows the lengths of 25 fish. Calculate an estimate for the mean length.
1 of 10
Question
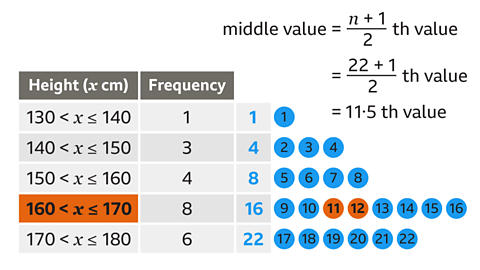
Which class contains the median height?
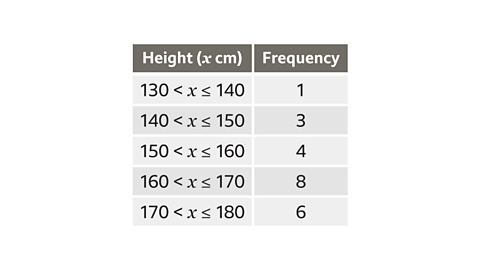
The median height is the middle height. There are 22 heights in total. Find which height the middle height is by adding 1, then dividing by 2.
23 ÷ 2 = 11·5
The middle height is the 11·5th height.
There is 1 height up to 140 cm.
There are 4 heights (1 + 3) up to 150 cm.
There are 8 heights (1 + 3 + 4) up to 160 cm.
There are 16 heights (1 + 3 + 4 + 8) up to 170 cm.
The 11·5th height must be between 160 and 170 cm.
The class that contains the median is 160 < \(x\) ≤ 170
Practise working out averages from grouped data
Practise working out averages from grouped data with this quiz. You may need a pen and paper to help you with your answers.
Quiz
Real-life maths

Grouped data is used in medical studies to identify if a treatment is more effective for certain groups of patients. Data could be grouped by age, amount of medicine given, or time since infection.
Calculating A single ‘typical’ value that is used to represent a set of values. The most commonly used averages are mean, median and mode. such as the mean, median or mode helps to summarise the data so that healthcare researchers can recommend specific treatments for patients.
Play Sudoku with BBC Bitesize!
Every weekday we release brand new easy, medium and hard Sudoku puzzles. Perfect for testing your skill with numbers and logic.

More on Averages
Find out more by working through a topic
- count1 of 4

- count2 of 4