Key points
- An understanding of The most commonly used measure of average. To calculate the mean, add the values together and divide the total by the number of values., A type of average calculated by finding the middle value of a set of numbers in ascending order. If there are two middle numbers, the median is the mean of those two numbers., A type of average calculated by finding the value that occurs most often. The mode can have one value, more than one value, or no value. and The difference between the highest and lowest values in a set of numbers. is essential to be able to compare sets of data.
- Data can be compared in two different ways:
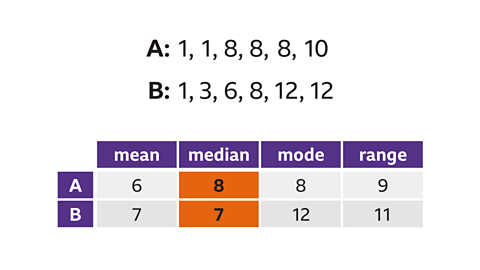
- By comparing an A single ‘typical’ value that is used to represent a set of values. The most commonly used averages are mean, median and mode., such as the mean, median or mode. An average gives a typical value, so comparing averages shows whether one set of data is generally higher or lower than the other. The mean is the most common way to compare two sets of data, but the median or mode may be better if there is an A value that is an unusual result that lies well beyond the rest of the data. in the data.
- By comparing the The difference between the highest and lowest values in a set of numbers.. The range shows how spread out the data is, so comparing ranges shows whether one set of data is more than the other.
Video
Watch the video to hear Steph, a sports coach, talk about why collecting and comparing data is useful and interesting for coaches, players and fans.
Bobby: Hi, Steph.
Steph: Hi, Bobby.
Bobby: How do you go about selecting your starting line-up?
Steph: So, our whole philosophy is based on every girl getting as much game time as possible and making that fair across all the players. So, what I do is I track the minutes that players play. I have a spreadsheet that I put that into after each match and I track that across the course of the season. I keep an eye on that and that means I can then adjust my starting line-up as we go along to make sure players get as much playing time and as equal playing time as possible.
Bobby: Would that be similar to what they do at elite level?
Steph: No, at elite level they would be tracking different stats. They might track playing time but that’s more for fitness reasons. The things they’ll be looking at are more like performance based stats. So, say for example, you’ve got a striker. The main purpose of your striker is to score you goals. So you’re going to be tracking how many goals that striker has scored, how many chances they’veconverted, and then if you're choosing between two strikers, you might use that stat to help you out.
You might also use stats to help you choose what team is going to give you the best chance of beating your opposition.
Bobby: So you’re tracking a lot of data - how do you actually go about trying to see what’s happening?
Steph: So, there’s loads of apps and visualisation tools at the minute. I know even in the grassroots game, there’s cameras that you can film your games with and they will then pull stats from that. Visualisation tools where you can pull graphs, graphics and lots of things that make it easier for coaches to look at the data and engage with it.
Bobby: So it sounds like for coaches, there’s a lot of data to compare but what about for us fans and viewers?
Steph: Yeah, I think it makes it really exciting for fans and viewers. There’s so much data out there, particularly if you follow a specific team, whether it’s football or another sport, you can really look into that data. Everyone likes to, for example in football, have something to say about the team a manager has chosen. Well, data gives you even more to look at around that.
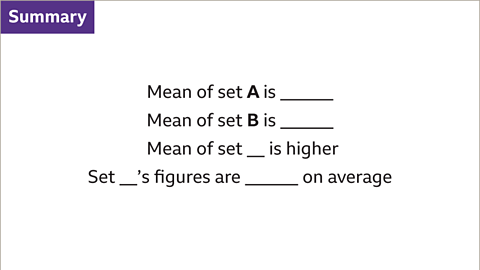
How to compare data sets
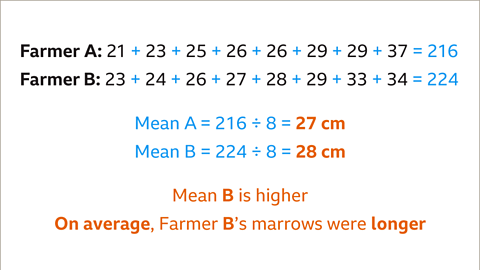
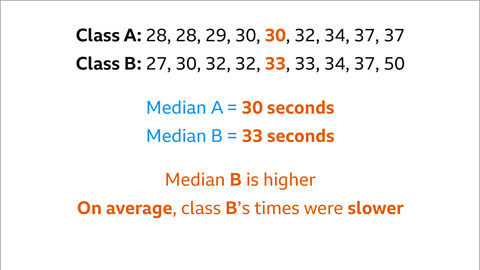
- To compare two or more data sets, it is too complex to look at every value, especially if there are a large number of figures. It is easier to compare the data using one typical value to represent each data set, such as the The most commonly used measure of average. To calculate the mean, add the values together and divide the total by the number of values., A type of average calculated by finding the middle value of a set of numbers in ascending order. If there are two middle numbers, the median is the mean of those two numbers. or A type of average calculated by finding the value that occurs most often. The mode can have one value, more than one value, or no value. . This helps to suggest which set of data is higher on average.
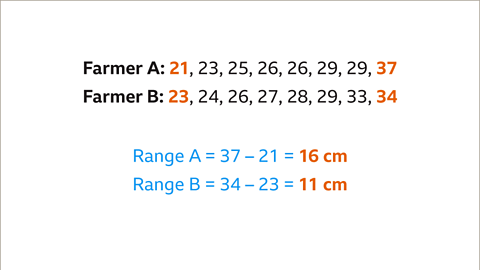
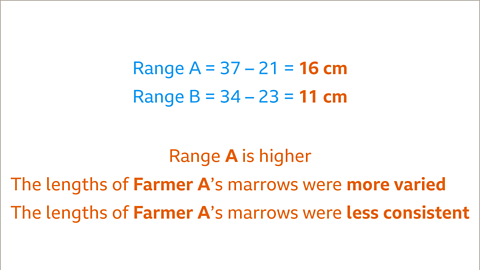
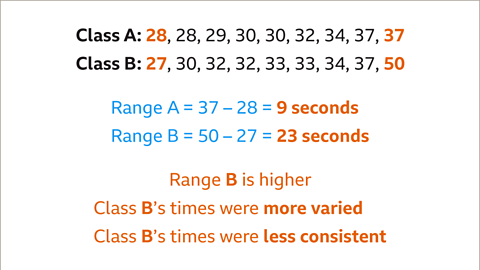
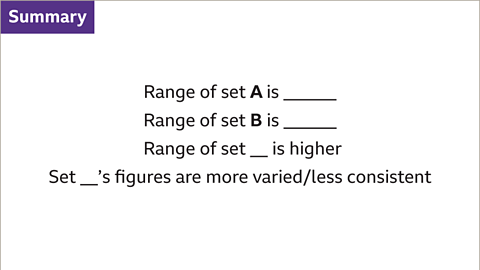
- The The difference between the highest and lowest values in a set of numbers. is the difference between the lowest and highest values. It measures how varied the data is. If a set of data has a lower range, the values are closer together and so the data is more consistent.
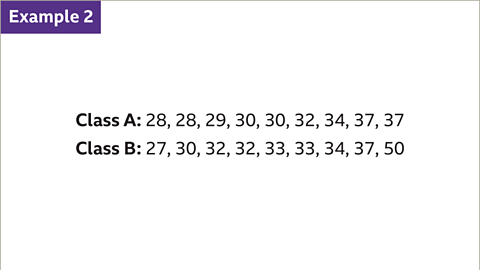
Examples

Image caption, Two farmers grow 8 marrows. These are the lengths of the marrows in cm.
1 of 9
Match the comparisons with the statements
Practise comparing data with this activity. Match the comparisons with the correct statement.
Question
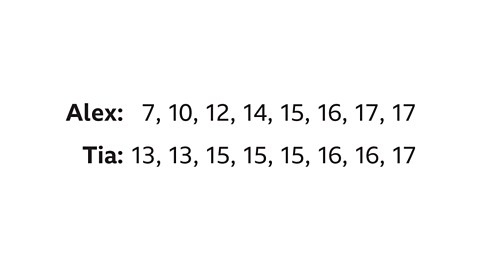
Alex and Tia have completed eight spelling tests and their ordered results are below. Each student wants to argue they have performed better.
What average could each of them use to suggest they are better at spelling?
Could the range be used as evidence too?
Whose argument would be most convincing?
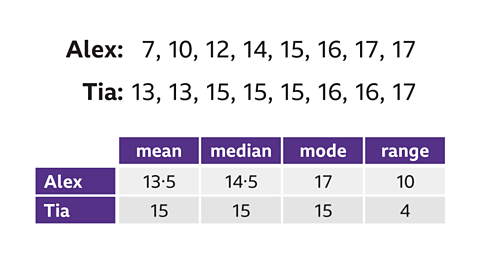
Tia’s mean and median are both higher. Tia could use either of these averages to argue she is better at spelling.
Alex’s mode is higher. Alex could argue he has performed better because his most common score was 17, which is higher than Tia’s mostcommon score of 15. However, comparing the mode is not a good representation, as it is not an indicator of the rest of his results.
Tia’s range is a lot smaller, so she could argue her results are less spread out.
Together with the higher mean and median, Tia’s argument that her results are more consistent and better on average is likely to be mostconvincing.
Practise comparing sets of data
Quiz
Practise comparing sets of data with this quiz. You may need a pen and paper to help you.
Real-life maths

Statistics and averages are often presented in the news, in documentaries or on social media.
Different averages can be used to support a particular point of view. Statistics may be carefully chosen for content in the media to make an argument or present a certain way of thinking to an audience.
By selecting a particular average to compare figures, it is possible to influence other people's opinions.
As a reader or viewer, a clear understanding of averages is helpful to spot when data may be presented in a way that is potentially misleading.
Play Sudoku with BBC Bitesize!
Every weekday we release brand new easy, medium and hard Sudoku puzzles. Perfect for testing your skill with numbers and logic.

More on Averages
Find out more by working through a topic
- count4 of 4
- count1 of 4