
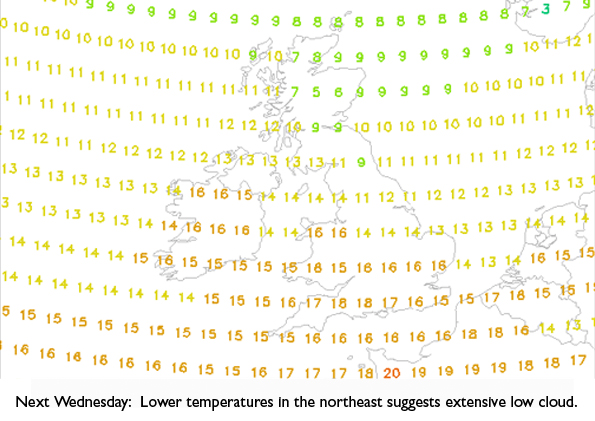
Quiet spell of autumn weather on the way
After what has seemed like a relentless period of unsettled weather stretching back to the end of March, it's nice to be able to report that a quieter spell of weather seems likely next week - although talk of an 'Indian Summer', for our region at least, is a little far-fetched.
Friday and Saturday look generally dry, although there will be some fog to contend with in the mornings.
The change will come courtesy of a warm front which will bring some rain and drizzle from the southeast later on Sunday.
Thereafter, the good news is that a ridge of high pressure will dominate our weather, meaning much drier weather on the whole next week.
And at first glance, it is easy to get carried away with the fact that the air which is on its way from the continent is warm.
But, unfortunately for us, it has to travel across the North Sea.
And as it does so, the warmer air coming into contact with the colder North Sea is likely to generate extensive low cloud at times.
In these situations it is possible to get quite high temperatures - for example where there is shelter from the prevailing south-easterly wind, like west of the Pennines, or areas where the warm air only has to travel across a short sea track, like southern parts of the UK.
But for our part of the world, skies are likely to be predominantly cloudy - although with light winds and generally dry conditions (apart from drizzle which can form in extensive low cloud), it should be an improvement compared with what we've been used to.
And let's hang on to the possibility that even here cloud breaks can occur in this set up, leading to at least the chance of some warm sunshine at times.
Follow me on twitter @Hudsonweather
 Hello, I’m Paul Hudson, weather presenter and climate correspondent for BBC Look North in Yorkshire and Lincolnshire. I've been interested in the weather and climate for as long as I can remember, and worked as a forecaster with the Met Office for more than ten years locally and at the international unit before joining the BBC in October 2007. Here I divide my time between forecasting and reporting on stories about climate change and its implications for people's everyday lives.
Comment number 1.
At 18:40 18th Oct 2012, PingoSan wrote:Take it you don't fancy the 1065Mb greenland high then Paul that's been showing on the GFS repeatedly? Low solar showing its presence felt already.
Complain about this comment (Comment number 1)
Comment number 2.
At 21:05 18th Oct 2012, ukpahonta wrote:UK experiences 'weirdest' weather By Roger Harrabin
'Sarah Jackson from the Met Office confirmed that they did not discern any pattern that suggested manmade climate change was at play in UK rainfall - although if temperatures rise as projected in future, that would lead to warmer air being able to carry more moisture to fall as rain.
She said that this year's conditions were partly caused by a move to a negative phase of the North Atlantic Oscillation which would be likely to lead to more frequent cold drier winters - like the 1960s - and also wetter summers for 10-20 years.'
https://www.bbc.com/news/science-environment-19995084
What no CO2 warming, for another 10-20 years, good to know it's only us that are going to cool whilst the rest of the world bake in increased temperatures!
Complain about this comment (Comment number 2)
Comment number 3.
At 07:38 19th Oct 2012, PingoSan wrote:"although if temperatures rise as projected in future, that would lead to warmer air being able to carry more moisture to fall as rain."
Is that like how temperatures haven't been rising for the last 16 years? Good job they called it a projection rather than a prediction.
Harrabin must have written that article through gritted teeth, knowing he couldn't blame it on despicable Man.
Complain about this comment (Comment number 3)
Comment number 4.
At 08:23 19th Oct 2012, ukpahonta wrote:'But scientists present from the Met Office and CEH said not much could be read into the weird weather. Terry Marsh from CEH said: "Rainfall charts show no compelling long-term trend - the annual precipitation table shows lots of variability."'
Confirms what QV has been telling us!
'"Longer term we will see a trend to drier summers but superimposed on that we will always see natural variability," she said.'
Is this written to convey that natural variability will always override the long term trend to drier summers? Certainly makes the case for natural variability stronger than has been in the past, perhaps it will be explained by a post on the Met Office news blog in the same manner as the recent DM article.
Complain about this comment (Comment number 4)
Comment number 5.
At 09:00 19th Oct 2012, openside50 wrote:so its moved onto global weirding now has it?
and when did harraboin come back?
more importantly has he explained himself re certain relationships he had with certain bodies he was reporting on without telling his readers about said relationship
Complain about this comment (Comment number 5)
Comment number 6.
At 10:47 19th Oct 2012, QuaesoVeritas wrote:A typical BBC approach, plenty of quotes saying that scientists say we can't attribute this to "climate change", while implying it is.
There was an equivalent item on the BBC News Channel by Harrabin, which started with the words "A great wave pours over the harbour wall at Lynmouth in Devon today. A storm, whipping up the high tide along much of the coast of South West England. A reminder of the power of the weather, in an extraordinary year. (accompanied by pictures of waves breaking on the harbour wall). Remember how it all began. Month after month of drought - the soil parched, farmers desperate and the usually dry months of summer approaching."
Precisely what have waves hitting the harbour wall at Lynmouth got to do with high rainfall?
What does he mean when he says "usually dry months of summer"?
In fact, the median seasonal rainfall figures, between 1766 and 1965, according to HadUKP, are as follows:
WINTER = 222.25 mm
SPRING = 179.30 mm
SUMMER = 228.75 mm
AUTUMN = 265.55 mm
So, in fact, historically, summer is the second wettest season, after Autumn and since by definition, approximately 50% of summer rainfall figures are ABOVE the median figure, talk of "usually dry summers" is nonsense.
It is true, that using the 1961-90 average, the figures are as follows:
WINTER = 252.41 mm
SPRING = 200.93 mm
SUMMER = 204.47 mm
AUTUMN = 257.89 mm
The 30 year average summer rainfall actually reached a low of 195.18 mm in 2001, so the PERCEPTION that summers are usually drier than other seasons, seems to be mainly due to below average rainfall during the late 20th century. If anything, any "weird weather" we have been having was during that period, rather than recently.
Actually, the 30 year mean rainfall figure is somewhat unreliable as a method of establishing normality. While summer is currently the 2nd driest season, and indeed, was the driest during the 30 years to 2004, during the early 19th century, it was the 2nd wettest, with the 30 year mean reaching 254.7mm, compared with the current figure of 216.54 mm.
Incidentally, when I was searching for flooding information at Lynmouth, I found this article on the BBC website, referring to a flood there in August 1952:
https://www.bbc.co.uk/devon/news_features/2002/lynmouth_flood.shtml
So the belief that recent weather is "extraordinary" is nonsense.
Complain about this comment (Comment number 6)
Comment number 7.
At 11:32 19th Oct 2012, John Marshall wrote:#6 QV Lynmouth was in August as was Boscastle. Both devastating flash floods. The comment last night that flooding is a winter problem is not actually shown by the data. Many recent flood events have occurred in late summer. But flooding in future may become an all year round problem because rivers are not dredged and there is far more concrete on the surface increasing runoff.
Complain about this comment (Comment number 7)
Comment number 8.
At 11:33 19th Oct 2012, QuaesoVeritas wrote:One section of the Harrabin article which puzzles me is the following:
"Sarah Jackson from the Met Office confirmed that it did not discern any pattern that suggested Man-made climate change was at play in UK rainfall - although if temperatures rise as projected in future, that would lead to warmer air being able to carry more moisture to fall as rain.
She said that this year's conditions were partly caused by a move to a negative phase of the North Atlantic Oscillation which would be likely to lead to more frequent cold, drier winters - like the 1960s - and also wetter summers for 10-20 years."
Is a "negative phase" in the AMO not when the index goes below zero?
Are we not currently in a warm phase of the AMO, with an index of +0.487 (NOAA).
Was there not recently some research published which suggested that high summer rainfall was associated with a WARMER North Atlantic?
https://www.bbc.co.uk/news/science-environment-19848112
I am genuinely puzzled, so can anyone explain?
Did she mean "positive", not "negative", or is it a misquote?
Complain about this comment (Comment number 8)
Comment number 9.
At 11:42 19th Oct 2012, QuaesoVeritas wrote:#7. - John Marshall wrote:
"The comment last night that flooding is a winter problem is not actually shown by the data."
Are you referring to the Harrabin news item?
I didn't think it was referring to winter flooding, but to summer flooding, and the fact that it was allegedly unusual.
Complain about this comment (Comment number 9)
Comment number 10.
At 13:23 19th Oct 2012, lateintheday wrote:I heard a similarly annoying radio4 programme 'costing the earth' the other day. Describing the effect on crop yields of the US drought and the UK summer deluge, one interviewee, (is that a word?) a certain Prof Rogers was getting away with all manner of global 'weirding' nonsense. Not a single challenge to any of his comments. It's not a show I usually listen to but going by its title, perhaps this is just typical of its standard production values.
Complain about this comment (Comment number 10)
Comment number 11.
At 14:18 19th Oct 2012, lateintheday wrote:And from the last post entry which is now closed.
Newdwr54 said . . .
Water vapour is a trace gas in the atmosphere.
Is it also unimportant?
Not surprisingly, the comparison was with CO2. As I understand it, atmospheric water vapour is present at around 30,000 ppm in the tropics as opposed to CO2 at just under 400ppm.
So, a slight difference in the abundance of these trace gases.
Complain about this comment (Comment number 11)
Comment number 12.
At 14:19 19th Oct 2012, QuaesoVeritas wrote:Re my #6, it turns out that the BBC News item was by David Shukman, not Roger Harrabin.
Sometimes I get the two of them mixed up!
Complain about this comment (Comment number 12)
Comment number 13.
At 14:48 19th Oct 2012, QuaesoVeritas wrote:#10. - lateintheday wrote:
"I heard a similarly annoying radio4 programme 'costing the earth' the other day. Describing the effect on crop yields of the US drought and the UK summer deluge, one interviewee, (is that a word?) a certain Prof Rogers was getting away with all manner of global 'weirding' nonsense. Not a single challenge to any of his comments. It's not a show I usually listen to but going by its title, perhaps this is just typical of its standard production values."
I have listened to the programme over the years, and in the early days I used to agree with it's content, and I probably still do, on general environmental issues.
Now I think that people at the BBC are so convinced by their own propaganda on "climate change", that they are not capable any more of challenging the claims.
What really annoys me is that having been told that there is a difference between "climate" and "weather", the proponents of "climate change" are now trying to use a couple of years of wet summers to argue their case.
Complain about this comment (Comment number 13)
Comment number 14.
At 16:33 19th Oct 2012, lateintheday wrote:Yes QV, I suspected that might be the case. One chap said he found it hard to believe that in the 21st Century, we could be facing a future of uncertain food production, mass starvation, food migrants etc etc . . climate change etc etc . . . wars, flood and famine etc etc.
Not much (if anything) said about the population explosion since the industrial revolution. I read recently that world population was less than a billion about a hundred years ago (not 100% sure if that's right) but clearly, food production increased dramatically over the 20thC and implying any future food shortages will be down to climate change is somewhat blinkered.
Complain about this comment (Comment number 14)
Comment number 15.
At 17:14 19th Oct 2012, QuaesoVeritas wrote:Regarding my post #8, I was, of course, confusing the North Atlantic Oscillation (pressure), with the Atlantic Multidecadal Oscillation (temperature)!
Too many oscillations!
Complain about this comment (Comment number 15)
Comment number 16.
At 17:19 19th Oct 2012, QuaesoVeritas wrote:lateintheday,
One problem is that a long time ago, Malthus predicted that there would be famine due to increased population and he has been proven wrong - so far, because improvements in agriculture have allowed food production to increase faster than population.
Most people assume that will continue to be the case, but I am not so sure. Of course, if there are food shortages in the future, it will probably be blamed on "climate change", not excessive population growth.
Complain about this comment (Comment number 16)
Comment number 17.
At 20:28 19th Oct 2012, jkiller56 wrote:Yes Paul, I fear you will be right about the North Sea cloud and drizzle. It has happened so many times before. I believe that the section of coast between the Humber and Tweed is the only part of Britain where the east coast has lower sunshine levels than comparable latitudes on the west coast - largely as a result of this phenomenon.
However as you suggest - it can be unpredictable. Warm moist air is the worst and produces the thickest condensation. But even air colder than the sea can produce a similar result - in that case presumably because rising air off the "warm" sea produces convective cloud?
I think the nub of the problem is that continental air often contrasts strongly with the North sea temperature (either warmer or colder). Conversely on the west coast air from the Atlantic is uniformly matched to the sea surface and does not meet any contrasting surfaces before it hits land. Exceptions might include very warm maritime tropical air cooling as it moves north which can produce similar "sea fret" mist and drizzle on the west coast.
Complain about this comment (Comment number 17)
Comment number 18.
At 21:01 19th Oct 2012, newdwr54 wrote:11. lateintheday wrote:
I wrote: "Water vapour is a trace gas in the atmosphere. Is it also unimportant?"
LitD wrote: "As I understand it, atmospheric water vapour is present at around 30,000 ppm in the tropics as opposed to CO2 at just under 400ppm. So, a slight difference in the abundance of these trace gases."
____________________________
Throughout the atmosphere, air is present at about 0.4%, while CO2 is present at about 0.04%; so ten times less. Both are 'trace gases' (i.e less than 1% of the atmosphere); both have a profound impact on the temperature of the atmosphere.
But both are just 'trace gases'. John Marshall (comment 101 on the previous thread) dismissed trace gases in favour of solar variation.
In fact, changes in solar variation affect tropospheric temperatures in a very minor way compared to the impact that trace gases have on the atmosphere (by trapping and recycling solar energy).
Complain about this comment (Comment number 18)
Comment number 19.
At 21:07 19th Oct 2012, newdwr54 wrote:18. I wrote:
"Throughout the atmosphere, air is present at about 0.4%..."
Should of course read:
"Throughout the atmosphere, *water vapour* is present at about 0.4%..."
Another long day.
I should also take the opportunity to mention that size (or in this case volume) isn't everything. The reason CO2 in particular is considered to be so important is because of its residence time in the atmosphere (as a total gas; not as individual molecules).
Water vapour comes and goes; CO2 is there for hundreds of years. In that sense, it is the atmosphere's thermostat, all other things being equal.
Complain about this comment (Comment number 19)
Comment number 20.
At 21:22 19th Oct 2012, jkiller56 wrote:To various#above
Regarding comments about "global weirding" - did you see the programme on this very subject last night on BBC4?
It focused on a number of "unusual" extreme weather events of recent times which overall seem to be increasing in frequency and intensity. Your much loved friends in the MO were on of course (among many others) - having dismissed in broad terms the likelyhood that the sun had caused recent perturbations in European weather. But oh dear - they would wouldn't they -I hear you sigh.
The overall message was not that any particular weather event was down to GW, but that increasing temps will increase the frequency of extremes proportionally ie enhancing what could be called natural variation - but not neccessarily masking it completely.
Perhaps the most profound comment came at the end where it was freely admitted that the planet had been through hotter and more violent times in the prehistoric past - and was thus, in itself, quite able to cope with similar in the future.
The real question was a human one - ie was it desirable or even OK that (if avoidable) warming which is likely to cause extreme distress to the human population as a whole should be simply allowed to happen. I suppose smug westerners can comfortably argue to the bitter end that it might be all "natural" and is not really our responsibility. But then, comfortable westerners are the ones least likely to suffer.
In a nutshell - nature and the planet is utterly indifferent whether you are right or wrong - only people will care.
Of course this was yet another BBC programme which in itself will give some of you enough grounds to believe it to be pure propaganda. Perhaps commercially financed broadcasters would be a more reliable source of info?
Complain about this comment (Comment number 20)
Comment number 21.
At 23:10 19th Oct 2012, ukpahonta wrote:'The amount of water vapor in an atmosphere is constrained by the restrictions of partial pressures and temperature. Dew point temperature and relative humidity act as guidelines for the process of water vapor in the water cycle. Energy input, such as sunlight, can trigger more evaporation on an ocean surface or more sublimation on a chunk of ice on top of a mountain. The balance between condensation and evaporation gives the quantity called vapor partial pressure.
The percentage water vapor in surface air varies from a trace in desert regions to about 4% over oceans.
The mean annual precipitation for the planet is about 1 meter, which implies a rapid turnover of water in the air – on average, the residence time of a water molecule in the troposphere is about 9 to 10 days.'
https://en.wikipedia.org/wiki/Water_vapor
Not exactly a decent reference but enough that the majority will recognise. Hardly a trace gas in areas that receive the most energy from the sun, which contributes to the concentration of water vapour in the atmosphere.
As for the residence time for CO2 there is certainly not a consensus opinion as yet:
https://judithcurry.com/2011/08/24/co2-discussion-thread/
Over a thousand comments, if your weekend is quiet.
Complain about this comment (Comment number 21)
Comment number 22.
At 00:03 20th Oct 2012, QuaesoVeritas wrote:#20. - jkiller56 wrote:
"Regarding comments about "global weirding" - did you see the programme on this very subject last night on BBC4?"
I was convinced that "Horizon" programme was a repeat, (and has probably been discussed here), but it wasn't listed as such in the Radio Times, so I didn't watch/record it.
Having said that it is going to be shown again at least another two times, so I will have opportunity to see it. However, I am still convinced it is a repeat and that it was based on a flawed premise, i.e. that there is something "weird" about recent weather, simply because more of it is reported as a result of better monitoring and communications.
Did you see the recent "Mayan Apocalypse" programme? Lots of misguided people attributing all of the "weird" events we are allegedly having, to the approaching end of the world, predicted by the fact that the Mayan calendar happens to run out on December 21st, 2012.
I put belief in "climate change" in the same category.
Complain about this comment (Comment number 22)
Comment number 23.
At 00:07 20th Oct 2012, PingoSan wrote:Do we know where this UK Weirding nonse has come from?
I just calculated all the standard deviations of precipitation, temperature, etc. And nothing has stood out.
1928 stood out.
Complain about this comment (Comment number 23)
Comment number 24.
At 00:12 20th Oct 2012, PingoSan wrote:Can the Met Office say how they came to their figurs about the most "weird weather" or are they hallowe'en pumpkins expecting people to be skared of their basic stats?
Complain about this comment (Comment number 24)
Comment number 25.
At 02:02 20th Oct 2012, lateintheday wrote:newdwr54 - LOL.
Thankfully, Ukpahonta has spared me the burden of replying sensibly to your last post. Just as well, since I'm far too inebriated by a trace amount of alcohol to respond in detail. Nevertheless, I'm curious as to why you should even try to argue the point. Even 'science of doom' accepts that the proportional contribution to the greenhouse effect of water vapour is orders of magnitude greater than CO2. The residence time is a complete red herring which you should be ashamed of, unless that is, you're a fan of Python and are simply 'arguing in your spare time'.
I'm off to bed - not entirely convinced that my alcohol content is at trace level. I think Pingu has been on the same stuff. That's friday night for you.
Complain about this comment (Comment number 25)
Comment number 26.
At 06:00 20th Oct 2012, PingoSan wrote:Well I did what any good scientist would do and checked the Met Office figures. I looked at the Standard Deviation for monthly rainfall totals back through history to the 1700s. I also looked for annual October to September, just in case. In each case, 1928 threw up the highest standard deviation. So, Met Office, what were humans doing in 1928 to cause such Weird Weather?
I fear they will soon pull the CET data to avoid such inconvenient and unfortunate assessment of their own data.
Complain about this comment (Comment number 26)
Comment number 27.
At 08:04 20th Oct 2012, ukpahonta wrote:PingoSan
'As the Met Office guides the nation at times of crisis'
https://www.metoffice.gov.uk/barometer/people/2012-07/ready-steady
If there is no crisis........
Complain about this comment (Comment number 27)
Comment number 28.
At 09:50 20th Oct 2012, QuaesoVeritas wrote:#26 - PingoSan
Well I did what any good scientist would do and checked the Met Office figures. I looked at the Standard Deviation for monthly rainfall totals back through history to the 1700s. I also looked for annual October to September, just in case. In each case, 1928 threw up the highest standard deviation. So, Met Office, what were humans doing in 1928 to cause such Weird Weather?
I was trying to replicate what you did, but I am not entirely certain what you mean.
Did you use HadUKP monthly data for England & Wales which starts in 1766?
I calculated the standard deviations of the monthly figures for each calendar year and 1929 came out the highest, followed by 1799, 1852 and 2000.
The different year is probably due to the fact that you used October to September, although I am not sure why you did that, especially since it means reorganising the data file.
One argument the proponents of "weirdness" use is that the frequency of "heavy rain events" is increasing, but I counted the number of days with rainfall over 10mm in England & Wales, and that was nearly as high in the 1950's and probably as high or higher, in the 1920's and 1870's.
Complain about this comment (Comment number 28)
Comment number 29.
At 09:59 20th Oct 2012, QuaesoVeritas wrote:I recently had some communication with someone from the Environment Agency in the N.E. and he says that recently there was a 1 in 5 year rainstorm, which produced a 1 in 60 year river flow. Of course, that could be partially due to the exact location of the rainstorm in the catchment area.
However, it is evidence that fairly normal rainfall figures are producing unusual flooding events, and he thinks that change in land use are the major contributing factor.
I don't know how long he will keep his job if he continues to express that opinion!
Complain about this comment (Comment number 29)
Comment number 30.
At 16:12 20th Oct 2012, QuaesoVeritas wrote:On this week's "Any Questions", on BBC Radio 4, Bob Crow, the General Secretary of the RMT, said the following during about energy prices:
"Don't forget, in the second round of pit closures, not the first round of pit closures of 84/85, but the pit closures that took place in the early 90's, it was the dash for gas. We was told that gas was going to be so cheap that we had to shut coal mines down in Great Britain. Here's an island with 300 years of coal beneath us and we've only got left 1700 miners, producing some of the best coal in the world."
And later in the same question:
"Wind farms is an opportunity to have the most friendliest, environmental way of energy. The reality is that if you use solar, and you use hot-rock, and you use tidal, you can use wind as well, to provide a hell of a lot of our energy. Why is it, that we are all walking around, in October, with no coats on, sweating, with leaves on the trees, because you've got an environmental problem. Unless you sort this environmental problem out very quickly, the next generation of children are going to be living in a world that's totally coated in carbon dioxide."
On the one hand, he seemed to be advocating the use of our coal reserves, but on the other, implying that we were suffering "climate change" because it was warmer than it should be, and there were still leaves on the trees in October.
Actually according to CET, the average temperature for October is currently 1c BELOW the 1961-90 average for the 19th, which if it continues to the end of the month, would result in a figure of 9.6c, the lowest figure since 2003, 0.1c below the median October CET figure since 1659 and almost identical to the mean October CET figure for the first 30 years of the series, i.e. 1659 to 1688. Othewise, the current CET figure is actually BELOW normal for the time of the year.
And what he meant by "a world that's totally coated in carbon dioxide", is anyone's guess.
The problem is, like a lot of people, he has taken in a lot of the "climate change" propaganda, without checking the facts for himself.
Complain about this comment (Comment number 30)
Comment number 31.
At 16:15 20th Oct 2012, paulcottingham wrote:The Unified Theory of Climate shows that with the carbon dioxide atmospheres of Venus as well as the atmosphere of the Earth, the increase in pressure reduces the speed of transfer of heat, the increase in heat maintains the equilibrium with the input of heat from the Sun, as more heat is transferred but at a slower rate, maintaining the equilibrium. With the increase in pressure using the Unified Theory of Climate, you get a calculation that gives a result for the 20th Century Man-made warming of about 0.001 Kelvin. So the change in temperature on the surface is caused by the change in the grey body temperature and that is caused by a change in the Earths cloud albedo. According to the work of Nir Shaviv galactic cosmic ray levels have been relatively stable during the present scientific era, so the changes in cosmic ray levels that produce the muons that reach the low cloud base are at present due to solar magnetic effects. So if you want to find out what causes the Weather then you should go to the weatheraction.com website of Piers Corbyn, and if you want to find out what causes climate change. An hour long DVD about Cosmoclimatology called “The Cloud Mystery” has been produced by an independent production company. The DVD can be purchased on the https://www.thecloudmystery.com website. A book called “The Chilling Stars” was published in 2007 after Henrik Svensmark completed his work. And if you are a Mensa member, join the Space Special interest group for further information about the above.
Complain about this comment (Comment number 31)
Comment number 32.
At 16:23 20th Oct 2012, newdwr54 wrote:21.ukpahonta wrote:
Re water vapour vrs CO2 in terms of magnitude: throughout the atmosphere water vapour outnumbers CO2 by 10/1. Obviously most water vapour is concentrated in the lower troposphere, where it has a local impact; whereas CO2 is more evenly distributed, and has a global impact.
But the fact remains that they are both 'trace gases' in the atmosphere. Yet their impact is to elevate surface temperatures to over 30oC above what they would otherwise be. So minor fluctuations in solar output have only a fraction of the overall impact that trace gases do on global surface temperatures, which is the only point I was making in the original comment on the previous thread.
Re Dr Curry's blog: there seems to be the usual conflation of CO2's residence time as total gas in the atmosphere vrs the residence time of individual molecules, which can be relatively brief. However, as the Wikipedia link in Curry's blog explains, the latter explanation tends to exclude "the balancing fluxes of CO2 into the atmosphere from the geological reservoirs".
The IPCC, which is a peer review body, recognise that a large portion (20%?) of the CO2 increase caused by AGW will still be present in the atmosphere for hundreds of years, if not longer.
Complain about this comment (Comment number 32)
Comment number 33.
At 16:46 20th Oct 2012, PingoSan wrote:"The IPCC, which is a peer review body"
An absolute guarantee of accuracy, especially in climate science.
Complain about this comment (Comment number 33)
Comment number 34.
At 16:56 20th Oct 2012, quake wrote:NASA calculates CO2 contributes about a 20% of the Earth's greenhouse effect and water vapor about 50%.
https://www.giss.nasa.gov/research/briefs/schmidt_05/
Complain about this comment (Comment number 34)
Comment number 35.
At 18:25 20th Oct 2012, Fudsdad wrote:I refer to QV's comment at 30 above.
Quite why Bob Crow has a platform to make such ill-informed comments is known only to the BBC. Clearly his support for the coal mines is incompatible with reducing our CO2 emissions and his interpretation of the October weather we are experiencing can only mean that he was in fact indoors when he thought he was outside. That Dimbleby did not intervene to point out the fatuous nature of his comments (whilst interrupting Farage at every turn) just reinforces our impression of BBC bias.
Complain about this comment (Comment number 35)
Comment number 36.
At 00:12 21st Oct 2012, jkiller56 wrote:QV #22
Yes the Horizon prog. probably was a repeat. Do you think constant repeats account for the impression that the BBC is biased?
What you say about more widespread communication and reporting is certainly a possibility. However, it is one I would have thought obvious enough to be taken into consideration by those working in the field.
I missed the "Mayan Apocalypse" programme, sadly. Still, I look forward to experiencing it first hand when it occurs at the end of the year.
Complain about this comment (Comment number 36)
Comment number 37.
At 00:18 21st Oct 2012, jkiller56 wrote:Fudsdad#35
Perhaps Dimbleby didn't want the question to deviate into a discussion about the weather?
Also, Crow is a bit of a rough neck - whereas Farage is just a likeable nutcase.
Complain about this comment (Comment number 37)
Comment number 38.
At 07:22 21st Oct 2012, QuaesoVeritas wrote:#36. - jkiller56 wrote:
"Yes the Horizon prog. probably was a repeat. Do you think constant repeats account for the impression that the BBC is biased?"
Thanks, I thought so, but it wasn't listed in the R.T. as a repeat - I will be complaining!
"What you say about more widespread communication and reporting is certainly a possibility. However, it is one I would have thought obvious enough to be taken into consideration by those working in the field."
Possibly, but not by the the general public.
"I missed the "Mayan Apocalypse" programme, sadly. Still, I look forward to experiencing it first hand when it occurs at the end of the year."
Strangely, none of the closest descendants of the Mayans they interviewed had heard of the prediction!
Complain about this comment (Comment number 38)
Comment number 39.
At 07:42 21st Oct 2012, ukpahonta wrote:Met Shots part deux:
https://www.dailymail.co.uk/news/article-2220722/The-REALLY-inconvenient-truths-global-warming-Last-week-explosively-revealed-16-year-pause-rising-temperatures--triggering-bitter-debate-You-decide-real-facts-.html
Complain about this comment (Comment number 39)
Comment number 40.
At 11:31 21st Oct 2012, John Marshall wrote:#9 QV.
yes but Harrabin did not claim anything, but the man from the Environment Agency, interviewed, did state that flooding was a winter problem.
Complain about this comment (Comment number 40)
Comment number 41.
At 15:06 21st Oct 2012, ukpahonta wrote:QV 8&15
Some good reading found over the weekend after my interest was triggered:
'We are currently in the warm phase of the AMO (since 1995) and the cool phase of the PDO (flickering since 1999; decisively cool since 2008). The previous similar regime was in the 1950’s, which was characterized by above average rainfall in the Sahel and south Asia, drought in the southwest U.S., and many intense hurricane landfalls in the U.S. Based upon previous regime shifts, it might be anticipated that this regime will continue for at least another decade.'
https://judithcurry.com/2011/01/04/scenarios-2010-2040-part-iii-climate-shifts/
Includes an update, Tomas Milanovic provides a summary and interpretation of Tsonis (2007). Which inspired the authors of the paper below.
'Proxy and instrumental records reflect a quasi-cyclic 50-to-80-year climate signal across the Northern Hemisphere, with particular presence in the North Atlantic.'
https://www.springerlink.com/content/p1275t4383874p65/fulltext.pdf
The authors of which present their paper in a guest post at:
https://pielkeclimatesci.wordpress.com/2011/04/21/guest-post-atlantic-multidecadal-oscillation-and-northern-hemisphere%E2%80%99s-climate-variability-by-marcia-glaze-wyatt-sergey-kravtsov-and-anastasios-a-tsonis/
'This line of inquiry was motivated by related previous research of Tsonis et al. (2007) and Swanson and Tsonis (2009), whose work identified five intervals throughout the 20th century during which certain high-frequency indices synchronized. Three of these five intervals coincided with multidecadal hemispheric climate-regime shifts, which were characterized by a switch between distinct atmospheric and oceanic circulation patterns, a reversal of NHT trend, and by altered character of ENSO variability. Our results provide a more detailed picture of these “successful” (~1916, ~1940, and ~1976) and “unsuccessful” (~1923 and ~1957) synchronizations among the higher-frequency indices. '
There's that 1976 climate shift again with other examples and all tied in with oceanic oscillations.
Complain about this comment (Comment number 41)
Comment number 42.
At 17:36 22nd Oct 2012, newdwr54 wrote:Speaking of climate shifts:
The David Rose 'No global cooling for 16 years' MoS article (which was accompanied by a graph showing the past 15, not 16 years) has come in for some criticism, and rightly so, in my view. I think probably the best so far is that by Grant Foster (aka 'Tamino'): https://tamino.wordpress.com/2012/10/21/temperature-analysis-by-david-rose-doesnt-smell-so-sweet/
By starting his analysis of HadCRUT4 in September 1997 (although he doesn't make it clear that he started on that exact month), Rose's data immediately rings 'cherry pick' alarm bells. Rose later claimed that he chose 1997 because "that’s when the previous warming trend stopped" (quote and link in the first link above).
Tamino uses data from 1975, which really did see a trend shift, but even the past 30 years' data are sufficient to show why Rose thought he could get away with making his 'trend shift' claim: https://www.woodfortrees.org/plot/hadcrut4gl/from:1982.67/plot/hadcrut4gl/from:1982.67/to:1997.67/trend/plot/hadcrut4gl/from:1997.75/to:2012/trend
There was fairly strong warming between September 1982 and August 1997; then much weaker warming between September 1997 and August 2012. So a shift in the trend, right? Not so.
Tamino points to a very simple way of demonstrating that Rose's claim is utterly wrong. All you have to do is take the above WfT graph and add the linear trend over the full 30 year cycle: https://www.woodfortrees.org/plot/hadcrut4gl/from:1982.67/plot/hadcrut4gl/from:1982.67/to:1997.67/trend/plot/hadcrut4gl/from:1997.75/to:2012/trend/plot/hadcrut4gl/from:1982.67/trend
The linear trend between September 1982 and August 2012 is actually *stronger* than it was between September 1982 and August 1997. There has been no slow down in the long term trend whatsoever.
The only thing short periods within a longer term (minimum 30 year) temperature series show is that, while natural variability is continuous, the fluctuations it drives have minimal impact on the long term trend.
Complain about this comment (Comment number 42)
Comment number 43.
At 19:02 22nd Oct 2012, jkiller56 wrote:QV#38
Well, repeat or not, I hope you enjoy the "weirding" prog.
Mind you, whatever the content, I wouldn't want to convey the impression that I actually thought it was a GOOD programme. Too "flash, bang wallop".
But that's what you get when the BBC are forced to chase the ratings game. Can't have science programmes that are too serious - or else the "Daily Mail" brigade start bleating on about having to pay the license fee for programmes they never watch.
So there has to be lots of jumpy camera "action", random lightening flashes and other assorted silliness to keep them awake - the poor dears!
Complain about this comment (Comment number 43)
Comment number 44.
At 19:28 22nd Oct 2012, ukpahonta wrote:#42
lolwot, makes the same case with the same enthusiasm over on Judith Currys blog, currently probably the main discussion (third post) on the plateau in global temperatures. Soon rebutted though:
https://judithcurry.com/2012/10/21/sunday-mail-again/
Complain about this comment (Comment number 44)
Comment number 45.
At 20:58 22nd Oct 2012, QuaesoVeritas wrote:#42. - newdwr54 wrote:
"The linear trend between September 1982 and August 2012 is actually *stronger* than it was between September 1982 and August 1997. There has been no slow down in the long term trend whatsoever. "
A clever trick, but it doesn't alter the fact that the trend over the period 1997 to 2012 is lower than that over the period 1982 to 1997.
Complain about this comment (Comment number 45)
Comment number 46.
At 21:06 22nd Oct 2012, QuaesoVeritas wrote:#43. - jkiller56 wrote:
"But that's what you get when the BBC are forced to chase the ratings game. Can't have science programmes that are too serious - or else the "Daily Mail" brigade start bleating on about having to pay the license fee for programmes they never watch. "
Personally I think the BBC are making too many documentaries at the moment, often duplicating the subject matter. There just isn't time to watch them all.
I think the licence fee should be halved to force them to make less programmes.
"So there has to be lots of jumpy camera "action", random lightening flashes and other assorted silliness to keep them awake - the poor dears!"
I agree, which is why I haven't watched it again. I just couldn't take any more of the gimmicks. Too many directors trying out fancy techniques instead of concentrating on the subject.
The funniest one was the one about "dark matter", which they seemed to illustrate by some sort of black goo.
Complain about this comment (Comment number 46)
Comment number 47.
At 09:08 23rd Oct 2012, newdwr54 wrote:44. ukpahonta wrote:
"Soon rebutted though:..."
Your link took me to a remark on Curry's blog by Latimer Alder. This poster states: "When T(t2) =T(t1) that says that it hasn’t warmed between t1 and t2."
If that statement refers to the period highlighted by Rose, i.e. Sept 1997 to August 2012, then first of all it's not true. The trend between those dates is a rising trend. It's very slight, but it's there nevertheless.
More importantly, 15 years is too short a period from which to detect an AGW signal. That would be true even if it had cooled slightly, or even if it had warmed strongly over that period. Santer et al. (2011) claimed that 17 years is the minimum from which an AGW signal can be identified from temperature data, with 32 years being sufficient to confirm the signal. The latter figure tallies with the WMO's recommended 30 years.
At the minute, the 32 year trend in HadCRUT4 is +0.16C/decade; the 17 year trend is +0.10C/decade. If we reach August 2014 and the 17 year trend (i.e. since September 1997) is flat or cooling, then David Rose is entitled to make his 'no warming' argument. Presently he can't make a scientifically compelling case, in my view.
Complain about this comment (Comment number 47)
Comment number 48.
At 09:27 23rd Oct 2012, newdwr54 wrote:45.QuaesoVeritas wrote:
I wrote: "The linear trend between September 1982 and August 2012 is actually *stronger* than it was between September 1982 and August 1997. There has been no slow down in the long term trend whatsoever. "
QV wrote: "A clever trick, but it doesn't alter the fact that the trend over the period 1997 to 2012 is lower than that over the period 1982 to 1997."
______________________
It's not intended to alter any facts QV. What it does do is reject David Rose's claim that "the previous warming trend stopped" in September 1997.
This is true whether Roes's phrase "the previous warming trend" means the 15 years prior to September 1997, or right back to 1975, when the last statistical 'shift' was confirmed.
In both cases the long term trends (1975-2012 or 1982-2012) are warmer than the short term trends that led up to 1997 (1975-1997 or 1982-1997). So whatever else it did, the warming trend did *not* stop in 1997 as Rose claimed. The only way he can claim that it did is to divide the surface temperature record into discrete 15-year-long segments.
Per my reply to ukpahonta above, for a variety of valid scientific reasons you can't legitimately do that.
Complain about this comment (Comment number 48)
Comment number 49.
At 10:45 23rd Oct 2012, QuaesoVeritas wrote:The JAXA Arctic sea ice extent is still above 2007 and 2011, the previous two lowest years, on the same date, and is currently increasing at a much faster rate than normal for the time of year.
However, while the extent is catching up on the next lowest year, 2008, there seems to be no immediate prospect of it exceeding that year at the moment.
Complain about this comment (Comment number 49)
Comment number 50.
At 13:06 23rd Oct 2012, ukpahonta wrote:#47 Newdwr54
If two years is what it takes for you to be convinced then that is fine, each at their own pace.
Lucy is doing some exciting technical stuff over at The Blackboard that if correct gives upper and lower bounds to climate sensitivity that basically rule out CAGW.
https://rankexploits.com/musings/2012/pinatubo-climate-sensitivity-and-two-dogs-that-didnt-bark-in-the-night/
'Allowing for uncertainties in the temperature and flux datasets, the response from Pinatubo is compatible with a 2xCO2 climate sensitivity of between 0.9 and 1.7C, with a ML value around 1.4C. Outside this range from 0.9 to 1.7C, it is not possible to obtain simultaneous matches to temperature and energy balance data within a temperature excursion range of 0.5 to 0.7C. '
Complain about this comment (Comment number 50)
Comment number 51.
At 15:29 23rd Oct 2012, lateintheday wrote:This made me chuckle.
Peter Gleick (amazingly) on a WUWT post comments
"Climate science is based on physics, models, and observations. Of course the science isn’t “settled” or “incontrovertible” but it sure is solid. . . .I suppose that apples might start to rise tomorrow, but the possibility does not merit equal time in physics classrooms.”
Gary Mount responded
"Gravity can be measured to at least 15 significant digits. Climate scientists don’t even know what the value of the first digit for climate sensitivity is . They aren’t even sure of the sign (negative or positive)."
Complain about this comment (Comment number 51)
Comment number 52.
At 16:18 23rd Oct 2012, newdwr54 wrote:51. lateintheday wrote:
"Gary Mount responded
"Gravity can be measured to at least 15 significant digits. Climate scientists don’t even know what the value of the first digit for climate sensitivity is . They aren’t even sure of the sign (negative or positive).""
Can you (or Gary Mount) name any working climate scientist who thinks the climate sensitivity of CO2 is likely to be negative?
Complain about this comment (Comment number 52)
Comment number 53.
At 16:43 23rd Oct 2012, lateintheday wrote:Your use of 'likely' sums it up nicely thanks newdr54.
Complain about this comment (Comment number 53)
Comment number 54.
At 17:06 23rd Oct 2012, newdwr54 wrote:50. ukpahonta wrote:
"If two years is what it takes for you to be convinced then that is fine, each at their own pace."
I note that you require me to wait a further two years into the future, rather than for you or David Rose to simply cast your range back a further two years into data we already have, pre September 1997.
By August 2014 I'd expect both the 32 and the 17 year trends in HadCRUT4 to still be positive. We'll have to wait and see.
And then presumably we will just have to wait *another* two years? It's a bit like that time in January 2010 when Rose claimed that a new mini ice age had already started: https://www.dailymail.co.uk/sciencetech/article-1242011/DAVID-ROSE-The-mini-ice-age-starts-here.html
2010, of course, turned out to be either the warmest or joint warmest year on record.
Complain about this comment (Comment number 54)
Comment number 55.
At 18:07 23rd Oct 2012, newdwr54 wrote:49. QuaesoVeritas:
Two predictions about Arctic sea ice extent in 2013:
1. Arctic sea ice extent will expand back out to its usual 15m km2 +/- 300,000 km2 (NSIDC) by March 2013.
2. (With less confidence) Arctic sea ice will recover from the 2012 low in September 2013, but will still fall below the minimum extent seen in 2011 (i.e. below 4.6m km2).
The first prediction is non-controversial and easy to make. It's based on the last 10 year average Arctic maximum extent with standard deviations. (Note, it says nothing about the volume of the ice.) It would be a major surprise if Arctic sea ice does not reach somewhere close to its 10 year average maximum extent in 2013.
The second prediction is more out on a limb. It's based on the observation that since 2001 there have been three very steep year-on-year declines in minimum Arctic sea ice extent. These were:
i) 2001-2002;
ii) 2006-2007;
iii) 2011-2012.
Following the steep declines at i) and ii) above, while sea ice extent recovered a little, it did not reach the extent from which the major decline fell. In other words, while 2003 and 2004 both saw higher minimum extents than 2002, they were both below the extent set in 2001.
The same is true with 2008-2011, all of which had higher minimum extents than 2007, but all of which fell below the extent set in 2006.
So I'm betting that the same will hold true for the decline seen between 2011 and 2012. 2013 Arctic sea ice minimum extent will probably recover from the 2012 low, but it's unlikely to fall under the extent set in 2011.
Complain about this comment (Comment number 55)
Comment number 56.
At 18:15 23rd Oct 2012, newdwr54 wrote:55.
Sorry, last sentence should finish:
"... [minimum 2013 extent] is unlikely to be above the extent set in 2011".
Complain about this comment (Comment number 56)
Comment number 57.
At 07:39 24th Oct 2012, QuaesoVeritas wrote:I wonder how long it will before someone describes the current extended period of mist and fog as "weird weather", for autumn.
Complain about this comment (Comment number 57)
Comment number 58.
At 21:01 24th Oct 2012, theelasticjesuz wrote:I thought a BBC blog would have a better informed conversation about AGW (Yes! It is folks) but alas I stumble upon the same data-mined, biased twaddle that fills Youtube. If any of you non-believers can cite one ref against AGW without introducing the word 'economics' into your argument then fire away. Better still, DO NOT CITE WUWT (you sensible 'realist' (LOL) atheists know what I'm talking about) or Stephen McKintyre, Ross McKitrick, Ball, Balluinas, Pat Michaels, etc etc or any of the long train of 'sensible realist scientists' who accidentally stumbled upon Heartland, the CEI, Americans for Prosperity, CATO, George C Marshall Inst and every other puppet organisation funded by Big Oil.
Oh...and his Lordship Lord Christopher Monckton (the guy who regularly gets eaten for breakfast by decent journalists (WITH bona fide science degrees) like Peter Hadfield (Potholer54, to all you people who pretend not to frequent Youtube).
For QueasoVeritas: I wonder how long before someone describes the hottest decade on record as NOT being the hottest decade on record; before record melt in the arctic is NOT record melt in the arctic, before we realise the 11 million hectares of deforestation per annum is but a figment of Al Gore's imagination, and that the world is about to be taken over by a communistic green sludge from Alpha Obama. ?!?
Complain about this comment (Comment number 58)
Comment number 59.
At 21:19 24th Oct 2012, QuaesoVeritas wrote:#58. - theelasticjesuz wrote:
"For QueasoVeritas: I wonder how long before someone describes the hottest decade on record as NOT being the hottest decade on record; before record melt in the arctic is NOT record melt in the arctic, before we realise the 11 million hectares of deforestation per annum is but a figment of Al Gore's imagination, and that the world is about to be taken over by a communistic green sludge from Alpha Obama. ?!?"
It's good to have a newcomer to the blog, especially of the "warmist" persuasion, since the discussion has been getting a bit stale of late. Better to "mine data" than to ignore it, when it contradicts your assumptions.
What has deforestation got to do with "climate change"? Personally I am against deforestation (assuming you mean the rain-forest) but it is a separate issue to "climate change".
I'm still trying to work out what the last part of the above means. Is this a correct reading of it?
"I wonder how long before we realise that the world is about to be taken over by a communistic green sludge from Alpha Obama. ?!?"
Can you clarify that?
Complain about this comment (Comment number 59)
Comment number 60.
At 22:22 24th Oct 2012, greensand wrote:@58 theelasticjesuz wrote:
"the same data-mined, biased twaddle that fills Youtube"
Don't do Youtube, only do data
"without introducing the word 'economics'"
Don't do economics, only do data
"DO NOT CITE WUWT"
Don't cite WUWT, only do data
Only do data, actual observational data, isn't that what AGW is based upon?
Enjoyed the rant, knock yourself out, I am sure that at present the BBC really appreciates a little light relief from the colonies!
Complain about this comment (Comment number 60)
Comment number 61.
At 22:29 24th Oct 2012, theelasticjesuz wrote:"Rainforest a separate issue to warming."
Are you serious?
For detailed analysis go here: https://www.fas.org/sgp/crs/misc/R41144.pdf
https://www.fas.org/sgp/crs/misc/R41144.pdf or WWF or Mongabay.com et al
In short -
1] Rainforest recycles 20-25% of atmopheric CO2. In other words, for every tree that disappears, not only do we lose a lung which uses photosynthesis to convert CO2 into much needed oxygen, be add to the amount of NEW carbon in the atmosphere. Double trouble.
2] Rainforest is being cleared at a rate of 11 million hectares per year to -
a]harvest methane machines (a Cow to you and me) Methane being 23x more potent GHG than CO2.
b]Bio fuels (a waste of time to you and me (and probably the only thing we will agree on))
c] mine for minerals,
d] Last and definitely NOT least, plant oil palms that end up in washing powder, peanut butter et al.
In short - we are destroying the lungs of the planet. Added to this we are decimating boreal forest: Siberia and Canada.
As for 'warmist.' You mean I have faith in science: in the 2nd Law of Thermodynamics; in the work of Arrhenius, Fourier and John Tyndall, in the overwhelming number of scientists who know that in any closed system, an increase in A means a reduction in B.
---
"I wonder how long before we realise that the world is about to be taken over by a communistic green sludge from Alpha Obama. ?!?"
Your re-phrasing of this sarcastic passage to suit a political ideal which I had already assumed - and quite correctly - merely proves my point that ALL deniers are of a certain political ilk, who argue against AGW, not because they understand it to be wrong, but because it interferes with their narrow view of the universe. I assume you vote Tory or Republican; you think Atlas Shrugged is the last book of the New Testament, and you think taxation is an abomination wrought by Satan himself.
Complain about this comment (Comment number 61)
Comment number 62.
At 22:34 24th Oct 2012, theelasticjesuz wrote:@Greensand.
So what and where is your data? Prove to the world that increasing CO2 is not and WILL NOT have a detrimental effect on life.
Complain about this comment (Comment number 62)
Comment number 63.
At 22:45 24th Oct 2012, greensand wrote:62. theelasticjesuz wrote:
"Prove to the world that increasing CO2 is not and WILL NOT have a detrimental effect on life."
Que?
Well, apart from the fact that without it there would be no life and terrestrial life itself has demonstrated how it prospered with previously higher concentrations.
Complain about this comment (Comment number 63)
Comment number 64.
At 23:32 24th Oct 2012, theelasticjesuz wrote:Que Que?
Yes, thanks for that. I'm well conversed with the 30 degree cooler model that Anthony Watts doesn't understand cos there's still too much albedo bouncing off his pate. But as I've repeated many times to others (perhaps I should have said 'human life' as opposed to 'life' per se) that homo (afarensis etc thru sapiens) has evolved - or rather come to fruition - during a moderately low CO2 period.
And despite the occasional yet geologically short spurt, ie Toba 74000 years ago, I maintain that since evolutionary development is affected (in part or whole) by its environment, then why would any of us WANT to live Jurassically or Carboniferously (for want of better words) when the 250 ppm over the past million years seems to have suited us just fine.
Sorry. I would rather my offspring develop fingers than twigs.
Complain about this comment (Comment number 64)
Comment number 65.
At 23:44 24th Oct 2012, theelasticjesuz wrote:My apologies. The previous message (64) was directed at and a response to 63. Greensand.
Complain about this comment (Comment number 65)
Comment number 66.
At 23:53 24th Oct 2012, greensand wrote:64. theelasticjesuz wrote:
"I'm well conversed with the 30 degree cooler model that Anthony Watts doesn't understand"
What relevance has that got? Why bring Anthony Watts into the discussion. I have already told you that I don't cite WUWT!
"But as I've repeated many times to others (perhaps I should have said 'human life' as opposed to 'life' per se)"
I have no knowledge, nor do I want to know what you have "repeated many times to others"
Without all life there would be no 'human life'.
"Sorry. I would rather my offspring develop fingers than twigs."
I agree, they probably would benefit from such a development, mine I am happy to say are quite dextrous, with both fingers and toes.
Complain about this comment (Comment number 66)
Comment number 67.
At 00:49 25th Oct 2012, lateintheday wrote:elastic - how many people on the planet these days? How many people on the planet with CO2@250ppm?
Complain about this comment (Comment number 67)
Comment number 68.
At 00:56 25th Oct 2012, RobWansbeck wrote:Don't feed the trolls.
Complain about this comment (Comment number 68)
Comment number 69.
At 10:07 25th Oct 2012, QuaesoVeritas wrote:#61. - theelasticjesuz wrote:
"In short - we are destroying the lungs of the planet. Added to this we are decimating boreal forest: Siberia and Canada."
Yes, but that is a "bad thing" in it's own right, irrespective of any effect any effect it may or may not have on "climate change".
"Your re-phrasing of this sarcastic passage to suit a political ideal which I had already assumed - and quite correctly - merely proves my point that ALL deniers are of a certain political ilk, who argue against AGW, not because they understand it to be wrong, but because it interferes with their narrow view of the universe. I assume you vote Tory or Republican; you think Atlas Shrugged is the last book of the New Testament, and you think taxation is an abomination wrought by Satan himself."
You make a lot of assumptions which are wrong. From what you say, I assume that you don't eat beef or drink milk, don't drive a petrol powered car, but I am probably wrong.
I re-phrased the passage in an attempt to understand what you meant, and I am still not sure that I do.
Complain about this comment (Comment number 69)
Comment number 70.
At 13:25 25th Oct 2012, theelasticjesuz wrote:1] in response to 67 Lateintheday
"how many people on the planet these days? How many people on the planet with CO2@250ppm?"
I can comfortably say the vast majority of the human race that has EVER lived since the numbers before the 'bottlenecking' 74000 years is vague, and that EVERY human being alive on the planet today (and who has lived over the last 74000 years) is a direct result of said 'bottlenecking.'
However evidence states (https://climate.nasa.gov/evidence/%28 (and this graph alone takes us back 400,000 years) long before Toba(bottlenecking))) that Co2 levels for the past 650,000 years have NEVER been higher than the 1950 level (300ppm) - and despite several glacial periods CO2 levels have never been higher than 300 ppm and lower than 180 ppm hence average of 250 ppm.
The current explosion in human population has happened during the 20th century (1 billion 1800-7 billion 2012) onwards (btw an interesting article here -https://www.prb.org/Articles/2002/HowManyPeopleHaveEverLivedonEarth.aspx suggests the total number of people who have ever lived to be around 108 billion.
However, (if correct) the 108 billion is spread out over a very long period (australopithecus etc takes us back between 2 and 5 million years) homo sapiens developed est 200,000/400,000? years ago)) and doesn't take into account mortality rates etc.
Complain about this comment (Comment number 70)
Comment number 71.
At 13:49 25th Oct 2012, theelasticjesuz wrote:With ref to 69 QV.
My point is simple. The vast majority of people who believe AGW is a scam, is over-exaggerated, or doesn't exist at all, are usually recognisable by their constant referencing to Anthony Watts, Christopher Monckton, Judith Curry, Roy Spencer, John Christie, Nigel Lawson, GWPF, Daily Mail, Telegraph, James Inhofe, Richard Lindzen, Glenn Beck, Fox News, Martin Durkin's 'Great Global Warming Swindle,' Piers Corbynn, David Bellamy, Jeremy Clarkson, Kelvin McKenzie, Roger Pielke, the Oregon Petition...etc etc
And strangely enough, people who makes such references also have a tendency to bring economics (invariably the Austrian School of) into their arguments (LOL).
Can't possibly think why?
Complain about this comment (Comment number 71)
Comment number 72.
At 14:10 25th Oct 2012, theelasticjesuz wrote:Also to QV
"Yes, but that is a "bad thing" in it's own right, irrespective of any effect any effect it may or may not have on "climate change".
Emph IRRESPECTIVE and MAY OR MAY NOT HAVE.
No MAY. All Definite. Without the boreal and RF, CO2 levels go through the roof. End of. I won't even cite links since the web is full of them, from NASA to rainforestsos WWF to Mongabay.
BTW I do have a petrol driven car and I do eat meat. But that isn't to say that I wouldn't jump at the chance to drive something more eco-friendly if the forecourts weren't full of petrol, petrol or diesel engines and fuel stations weren't controlled by Exxon, Exxon, Exxon, Chevron, BP, BP, BP, and Shell.
Wonderful to have choice in this great free market, is it not?
Complain about this comment (Comment number 72)
Comment number 73.
At 14:12 25th Oct 2012, ukpahonta wrote:Nanoo, Nanoo, Mork calling Orson!
Complain about this comment (Comment number 73)
Comment number 74.
At 14:12 25th Oct 2012, Spanglerboy wrote:I pop by to make sure there has been no change to the banter and lo and behold the quiet little backwater that is Paul's blog has a giant troll on board. RobWansbeck has the answer. Adios.
Complain about this comment (Comment number 74)
Comment number 75.
At 15:03 25th Oct 2012, theelasticjesuz wrote:73,74. Whatever.
Hmmm! Seems to me you lot have had it your own way for far too long. As for troll??? I take it you mean that anybody who disagrees with your apparent scepticism (LOL) is a troll?
Okay. Let's take a look at the evidence -
Prosecution: ' One who posts a deliberately provocative message to a newsgroup or message board with the intention of causing maximum disruption and argument.'
Defence: A public forum run by a weatherman who sometimes makes controversial statements other than weather - 'like the hike in energy bills, due in part, to decarbonising the economy.' Not very impartial, I must say.
Defence: A public forum full of deniers who, having cosied up to each other and massaged each others' egos for far too long now find themselves in the awful position of having to defend their opinions (yes, opinions).
Hey, if you lot feel your position on climate is so solid, then get off your backsides and present your findings to the relevant scientific body or court of law...since to do otherwise is simply allowing the likes of Al Gore, Richard Alley, Ben Santer, to keep pilfering your hard-earned taxes...
After all, isn't that what all this is about? A little cosy meeting room for non-political (laugh! I nearly fell off my chair) pseudo intellectuals who pretend to know more than the Royal Society, NASA, NOAA put together, but are just too busy getting angry with their tax returns to do anything about it (LOL)?
As for you Spanglerboy...yeah...bring on RobWansbeck, (whoever he may be) since your style to stand at the back while the big boys trade punches seems to suit you just fine.
And this is for Paul Hudson. Paul, I hope you'll honour my right to free speech and my defence of a science that is 99% nailed on. Because if you don't, Ill set Christa Ackroyd on you...and that's nearly as scary as the TRUE TROLLS that infest this blog.
Complain about this comment (Comment number 75)
Comment number 76.
At 16:45 25th Oct 2012, quake wrote:You've come in like a bull in a china shop. It's like a meteor has slammed into a quiet backwater, as spanglerboy put it. Your choice, but you risk upsetting a balance. If you will, your impact is analogous to a suddenly large pulse of CO2 on a stable ecosystem. Your action could prompt escalation which as a tipping point could cause the blog to lurch into a completely different and permanent state.
Complain about this comment (Comment number 76)
Comment number 77.
At 16:58 25th Oct 2012, ukpahonta wrote:"your impact is analogous to a suddenly large pulse of CO2 on a stable ecosystem."
Totally agree!
Complain about this comment (Comment number 77)
Comment number 78.
At 17:41 25th Oct 2012, theelasticjesuz wrote:76. Quake.
So explain to me, the state of play?
From my point of view, I simply stumble upon a blog that at first impression seems innocuous; occupied it would seem (having perused many comments from your own boards) by fairly intelligent people who may - or may not work for the Met Office - but nonetheless show a genuine interest in the temp anomalies as they come in - as it were.
However, interjected among these comments are the subtle and sometimes more sinister finger-pointing that one would expect from James Dellingpole and all the other idiots (sorry...but I've spent far too many years defending the science to call a spade anything other than a spade) who know far more about winning an audience than a scientific debate.
So. What is your position?
a] You either all work for the Met office and are sceptical of the numbers nonetheless.
b] You don't work for the Met office but are determined to prove the figures wrong even though I have yet to see any of your 'presented' anomalies in minus figures.
c] You are bored mathematicians/scientists who have an axe to grind with James Hansen because he burst the tyre of your mini bus in 1987.
d] You are politically motivated idiots - possibly middle managers at ASDA - who think global warming is a complete fiction because Charles Koch said so.
BTW My impact could only be analogous to a suddenly large pulse of CO2 on a stable ecosystem if you believe that CO2 possesses such properties. And since most deniers believe that this contradicts the 2nd Law...????
BTWBTW If by upsetting a balance you are inferring that this blog is the sole property of you and your friends, that free speech is free so long as it's your point of view, then I rest my case.
Have a nice day.
Complain about this comment (Comment number 78)
Comment number 79.
At 18:02 25th Oct 2012, Expatback wrote:When is the BBC going to show the 'deniers' point of view on AGW, surely in the persuit of fairness this should show balance. Or have we got another 'Savillsation' situation?
Surely articles such as the one in 'The Mail' and all the issues of solar cycles and the elements of the Ocean Atmosphere Systems require an airing? Are we still too dumb to understand these more complex issues, or is the Beeb still too left wing?
Come on Paul I dare you!
https://www.dailymail.co.uk/sciencetech/article-2217286/Global-warming-stopped-16-years-ago-reveals-Met-Office-report-quietly-released--chart-prove-it.html
Complain about this comment (Comment number 79)
Comment number 80.
At 18:06 25th Oct 2012, ukpahonta wrote:Heeheehee! .... priceless.
Complain about this comment (Comment number 80)
Comment number 81.
At 18:22 25th Oct 2012, newdwr54 wrote:I was working. What did I miss?
Complain about this comment (Comment number 81)
Comment number 82.
At 18:27 25th Oct 2012, lateintheday wrote:"(sorry...but I've spent far too many years defending the science to call a spade anything other than a spade)"
Are you sure that wasn't a shovel?
Complain about this comment (Comment number 82)
Comment number 83.
At 18:39 25th Oct 2012, ukpahonta wrote:Sorry Expatback back you snook in before my last post, the times they are a changin. The Savile issue is major for Auntie and may flow into the miners dispute and Maggies political requirements which opens the door to political influence. Could roll for a couple of years unless a line is drawn in the sand now with substantial changes to the trust which could benefit the overall independence.
Complain about this comment (Comment number 83)
Comment number 84.
At 18:50 25th Oct 2012, theelasticjesuz wrote:"When is the BBC going to show the 'deniers' point of view on AGW,"
The same time the Daily Mail stops peddling lies about AGW to please its sponsors.
BTW Point of view is Man Utd or Man City. Truth is the science that states CO2 is a GHG.
Complain about this comment (Comment number 84)
Comment number 85.
At 19:18 25th Oct 2012, theelasticjesuz wrote:___/---------a plateau IS NOT a decline------------
___/
__/
__/
"So let’s be clear. Yes: global warming is real, and some of it at least has been caused by the CO2 emitted by fossil fuels. But the evidence is beginning to suggest that it may be happening much slower than the catastrophists have claimed – a conclusion with enormous policy implications."
The last paragraph, Daily Mail 16th Oct. Just in case, eh?
Complain about this comment (Comment number 85)
Comment number 86.
At 21:41 25th Oct 2012, ukpahonta wrote:#81
Not a lot, the Messiah has arrived and we're the Judean People's Front.
Complain about this comment (Comment number 86)
Comment number 87.
At 22:04 25th Oct 2012, greensand wrote:@86 ukpahonta
Have you been checking the east night sky? Difficult here, not seen the sky for a week! Should be clear this weekend so might do a little star gazing, just in case, wouldn't want to miss a sighting.
Complain about this comment (Comment number 87)