
Parts of UK at risk of renewed flooding
UPDATE at 6.30pm
Lastest information from American GFS model shifts emphasis for heavy rain towards the earlier ECMWF solution detailed below, i.e with much of Yorkshire and Lincolnshire at risk of some of the highest rainfall totals.
ENDS
Amber alerts are in force for parts of the UK tomorrow, with heavy prolonged rain likely to lead to renewed flooding in places.
This is on top of possible localised flooding from scattered thunderstorms today, and a risk of flooding on saturday across parts of Northern Britain.
Computer models have in the last few days consistently developed an area of low pressure over the near continent tonight, bringing the centre across East Anglia and the Midlands tomorrow.
This feature will be very active, driven by high humidity air, leading to prolonged heavy, thundery rain.
The precise northern and southern boundary of this area of rain is open to some doubt at the moment.
The chart below, from the UK Met Office, gives an indication of the highest risk area (yellow) of the heaviest rain (50mm or more in total on Friday), with East Anglia, the Midlands and Wales in the firing line.
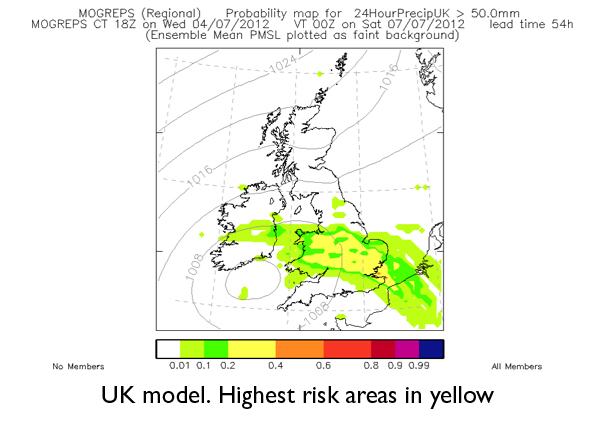
The area fringes into parts of Yorkshire and Lincolnshire too. This is considered to be the most likely outcome at the moment.
But the European Centre for Medium Range Forecasting (ECMWF) model, shown below, has the risk of disruptive rainfall further north (Red), with parts of Yorkshire and the Humber at highest risk.
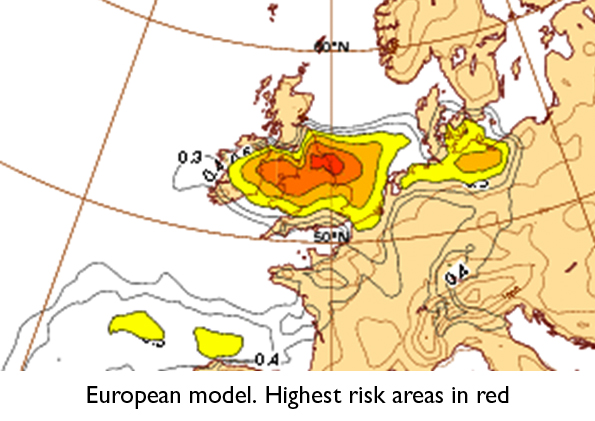
The European model arguably offers the most consistent and reliable guidance for weather forecasters, and gives an insight into the on-going uncertainty regarding the positioning of tomorrow's heavy rain.
Whichever is correct, with much of the land now saturated, another month's worth of rain in less than 24 hours tomorrow will inevitably lead to renewed flooding across parts of the UK.
Follow me on twitter @Hudsonweather
 Hello, I’m Paul Hudson, weather presenter and climate correspondent for BBC Look North in Yorkshire and Lincolnshire. I've been interested in the weather and climate for as long as I can remember, and worked as a forecaster with the Met Office for more than ten years locally and at the international unit before joining the BBC in October 2007. Here I divide my time between forecasting and reporting on stories about climate change and its implications for people's everyday lives.
Page 1 of 2
Comment number 1.
At 16:01 5th Jul 2012, Tim wrote:At the start of the summer they were saying the water table was very low and would never recover. I suspect within 5 years there will be no more talk about man causing global warming, as a massive correction factor will be caused by the weather. It is about time people got to the cause and not the effect. For example Einstein travelling on a beam of light, to discover that time travels backwards, when you go faster than the speed of light.
Complain about this comment (Comment number 1)
Comment number 2.
At 16:55 5th Jul 2012, E Gouthwaite wrote:I wonder if a trip to the Nano technology fastival in Tehran might have some answers to control it a little better Fukusimi have forgot the Tsunami now https://festival.nano.ir/
Complain about this comment (Comment number 2)
Comment number 3.
At 17:29 5th Jul 2012, grumpyoldman58 wrote:In March we were all going to dehydrate to death. Now we are all going to drown. In Perth, Western Australia, last night temperatures dropped below freezing. As yet there are no reports of anyone freezing to death but give them time. Every effort must be made to have 50 million dead due to catastrophic climate change by the end of the year so that the prophecy may be fulfilled.
Complain about this comment (Comment number 3)
Comment number 4.
At 17:40 5th Jul 2012, john_cogger wrote:@1 Tim
The water table was very low. They said it would take months of above average rain to replenish. They have got months of way above average rain instead.
@3 grumpyoldman58
Not sure how Perth being cold makes much of a difference to GLOBAL temps but feel free to expand.
Complain about this comment (Comment number 4)
Comment number 5.
At 17:48 5th Jul 2012, Tim wrote:grumpyoldman58 Reminds me of the flu outbreak that was going to kill millions. John Cogger, the next step in God's plan is to give us lots of cold weather to rebalance matters. I have a word with him via direct link every night.
Complain about this comment (Comment number 5)
Comment number 6.
At 17:56 5th Jul 2012, john_cogger wrote:@5 Tim
He never answered your snow prayers last year... He will only give you your presents if you are a good boy. Oh sorry that's Santa... still he has about the same influence on the weather...
Complain about this comment (Comment number 6)
Comment number 7.
At 18:01 5th Jul 2012, john_cogger wrote:Interesting to see that WUWT might be turning on one of it's own?
Complain about this comment (Comment number 7)
Comment number 8.
At 18:32 5th Jul 2012, oldgifford wrote:Ref. Piers Corbyb accuracy he has issued a forecast for July.
https://www.weatheraction.com/docs/WANews12No32.pdf
So judge for yourself.
Complain about this comment (Comment number 8)
Comment number 9.
At 18:53 5th Jul 2012, Tim wrote:John cogger I haven't believed in Santa since I was seven and man made global warming since 2006. We have to look at the direction the weather is going in not one year. But since 1998 the world hasn't become warmer and at some point things will collapse and people will complain how cold it has become. I hope that we can produce enough food then.
Complain about this comment (Comment number 9)
Comment number 10.
At 18:57 5th Jul 2012, Tim wrote:Quoted from Piers forecast. Ongoing extremes and major contrasts across USA and Europe and associated large amplitude swings in the Jet Stream are aspects of pre-Little Ice Age Weather patterns as the world descends towards a new Little Ice Age of a colder climate caused by low solar activity especially around 2020-45. Solar Lunar Action Technique SLAT 8A predicts these changes.
Complain about this comment (Comment number 10)
Comment number 11.
At 19:22 5th Jul 2012, newdwr54 wrote:7. john_cogger:
Never did I think I would be posting a comment in support of Anthony Watts! I could have written that first paragraph myself.
Be interesting to see what PC makes of it.
Complain about this comment (Comment number 11)
Comment number 12.
At 19:27 5th Jul 2012, john_cogger wrote:@8 Oldgifford
Piers has also released one for Europe -
"Europe July 2012 "Off-the-scale" Flood & Fire extremes likely"
https://www.weatheraction.com/docs/WANews12No31.pdf
Not really a forecast as such and not much to judge on, but we will see.
Complain about this comment (Comment number 12)
Comment number 13.
At 19:50 5th Jul 2012, QuaesoVeritas wrote:#1. - Tim wrote:
"For example Einstein travelling on a beam of light, to discover that time travels backwards, when you go faster than the speed of light."
I didn't think it was possible to travel faster than the speed of light!
In theory, time slows down as you approach the speed of light, but never travels backwards.
Complain about this comment (Comment number 13)
Comment number 14.
At 20:25 5th Jul 2012, QuaesoVeritas wrote:#8. - oldgifford wrote:
"Ref. Piers Corbyb accuracy he has issued a forecast for July.
So judge for yourself."
Not a lot of verifyable specifics to get your teeth into on that.
Lets take:
"Searing heat will grip West / South
parts with extremely dangerous
‘out-of-control’ forest fires
especially later in month"
What is "searing heat"?
What is an "out of control forest fire"?
Aren't all forest fires "out of control" by definition?
Are forest fires all that unusual in July in the U.S.?
What is meant by "West/South parts"?
If this is the S.W. of the U.S., it is interesting that the current
extended range GFS forecast on the Ryan Maue web site isn't showing
particularly high anomalies in that area up to the 21st, in fact often negative
anomalies. Most of the high temperatures seem to be in the N.W. and later the area around the Gt. Lakes, so it will be interesting to compare.
No doubt there is more detail on the non-public forecast.
Complain about this comment (Comment number 14)
Comment number 15.
At 20:31 5th Jul 2012, QuaesoVeritas wrote:#11. - newdwr54 wrote:
"Never did I think I would be posting a comment in support of Anthony Watts! I could have written that first paragraph myself."
Same here, from the "other side of the fence".
My thoughts almost exactly.
I want to take PC seriously but his whole approach is off-putting.
Complain about this comment (Comment number 15)
Comment number 16.
At 22:39 5th Jul 2012, greensand wrote:Is being none PC becoming PC?
Suits me I have always been none PC.
Thanks for the heads up Paul, have battened down the hatches!
Complain about this comment (Comment number 16)
Comment number 17.
At 22:58 5th Jul 2012, newdwr54 wrote:I notice Roy Spencer's running a little late with the UAH June update. I've often seen comments that Roy tends to be a bit tardy with updates that show warming, and I must say that's the impression I get too, sometimes.
So I was sad enough earlier today to check back over the last 16 months on his website to see if there was any truth in this meme.
This is not meant to be a serious exercise, by the way. I noticed a comment in one of his monthly updates in which he explained that his daughter had been in a bad car smash. Obviously many things in life are more important than updating climate databases. Hopefully his daughter is well and on the mend.
So honestly, this is not meant as personal criticism. You might say it's 'purely for entertainment purposes' ;-)
In the past 16 months there were eight rises and eight falls in UAH temp data, conveniently enough. (I stopped at 16 months because I was bored scanning back through the old posts, and not for any nefarious reason, btw.)
The date on which the previous month's data were posted during 'cooling' periods ranged between the 2nd and the 5th. The average was the 3rd. The date on which the previous month's data were posted during 'warming' periods was the 1st - 15th. The average was the 7th.
There is no correlation between the scale of the warming and the length of time it took to post the data.
Although there is a sizeable difference between the 'average' time it takes Roy Spencer to post cooling vrs warming data, with the cooling data usually emerging faster, it's also true that the fastest data he put out in the past 16 months was 'warming', and that the scale of the warming seems to have no impact on publication date.
However, based on Roy's 16 month publication record, you might suspect that UAH for June 2012 is likely up on May 2012. The AQUA CH5 data also support that view.
But this is frivolous. I just posted it to explain the odd comment I make re the publication date of UAH data. As I mentioned above, Roy Spencer, like the rest of us, has more important things in life to worry about than numbers.
Complain about this comment (Comment number 17)
Comment number 18.
At 00:04 6th Jul 2012, greensand wrote:@17. newdwr54
Not for the first time DW, I have to agree with you, you are sad.
Tell you what, "'purely for entertainment purposes' ;-)" re-post it here:-
https://www.drroyspencer.com/
I am sure it will be welcome, especially as it is not a personal criticism as demonstrated by the effort you have taken to name. at least 4 or 5 times, the person that you are not personally criticising .
Complain about this comment (Comment number 18)
Comment number 19.
At 08:16 6th Jul 2012, QuaesoVeritas wrote:#17. - newdwr54 wrote:
"So I was sad enough earlier today to check back over the last 16 months on his website to see if there was any truth in this meme. "
Yes, waiting for the figures each month can be frustrating and can divert you (i.e. me) into some strange areas.
I wonder if you found any relationship with the time of year, i.e. do the figures tend to be later during the summer or holiday months, when there might be other distractions, for example around July 4th as at the moment?
It has been particularly frustrating recently, as RSS figures for June are also later than usual and the UKMO HadCRUT3 figures for May were particularly late this month and for some reason the HadSST2 figures still haven't been published!
Added to which, Roy Spencer is "teasing" us by publishing articles on on other topics.
Complain about this comment (Comment number 19)
Comment number 20.
At 08:20 6th Jul 2012, QuaesoVeritas wrote:Is it my imagination or is the MO paying more attention to the current "rain event" than it did to the one last Thursday?
As someone who lives in the N.E., I think that we had relatively little warning of the severity of that event, compared to this one.
Is it possible that this is to divert attention away from their failures in forecasting last Thursday's flooding?
Complain about this comment (Comment number 20)
Comment number 21.
At 08:53 6th Jul 2012, jkiller56 wrote:Yes, this weather is moving from the bizarre to the "getting a bit frightening" catagory.
Still, take heart sceptics, I'm sure it has all happened before and this is just a "natural" variation. No doubt if you dig deeply, hard and long enough - precedents will be there.
Mind you, I seem to remember a certain meteorologist by the name of Paul Hudson being quoted in the Yorks. Post after the floods of 2007 saying that it was "exactly" the sort of weather being predicted by AGW theory!
Complain about this comment (Comment number 21)
Comment number 22.
At 09:07 6th Jul 2012, jkiller56 wrote:QV #14
Not a lot of specifics in the Corbyn forecast - indeed not - if anything rather sketchy and vague but above all melodramatic of course.
Nothing to persuade me yet to switch from Russell Grant, Oldgifford#8 - bearing in mind he is also, like Corbyn, very much still in business.
Complain about this comment (Comment number 22)
Comment number 23.
At 09:26 6th Jul 2012, Tim wrote:QuaesoVeritas.:-) I once watched a program where they took an atomic clock around the world and time slowed. I am sure that some where in the universe travel can be faster than the speed of light, I suppose that is where they are coming from with the "God particle". This will ultimately result in time travel in a physical way, but people have been doing this in their mind since the start of the world. I often dream about things in the future, that haven't happened --------- Moving on what concerns me, is if a Maunder minimum period comes along and we have been focusing on the opposite extreme, this could cause a shortage of food and cause social unrest. Governments always focus on the wrong dichotomy, because they can't deal with things in a holistic way, due to being dictatorships. At the time of the last Maunder minimum in 1645, we had a civil war and King Charles the 1st lost his head. We now have another Charles 3rd. Life throws up some strange coincidences, which aren't down to probability.
Complain about this comment (Comment number 23)
Comment number 24.
At 09:38 6th Jul 2012, QuaesoVeritas wrote:Apparently the worst storm to hit Britain was that of November 26th, 1703.
Fortunately, this was documented in the book "The Storm", by Daniel Defoe, of "Robinson Crusoe" fame.
As a result of the storm, actually thought to be a hurricane, 8000 people were killed and many windmills caught fire because the strong winds were making the sails turn so fast. Thousands of Oak trees were blown down and a large part of the British navy was destroyed.
Apparently the weather in 1703 had been particularly bad, with seemingly endless rain and strong winds and on May 26th, the vicar of Cheshunt preached a sermon on the "Strange Unpleasantness of the Weather at Present", in which be blamed the weather on "divine displeasure", and predicted worse to come, "should the country not turn wholeheartedly towards a renewed contemplation of God".
Does that sound familiar?
Of course, if the storm was to happen now, we know what would be blamed.
Complain about this comment (Comment number 24)
Comment number 25.
At 09:57 6th Jul 2012, Boanta wrote:1703----Was that not well within the LIA period?
Complain about this comment (Comment number 25)
Comment number 26.
At 10:08 6th Jul 2012, Boanta wrote:22 The WeatherAction release specifically mentions record or near record heat in Eastern Europe. What's vague about that? It also mentions gales, tornadoes, thunderstorm-floods and giant hail for Northwest Europe. There's nothing vague about events like that and they will be easy to chronicle. 'Off the Scale'' could probably be better defined. Yes this is quite dramatic language, but PC has to up the linguistic ante as he is operating in a sales-survival environment and not in a mega - miilion hand outs one.
Complain about this comment (Comment number 26)
Comment number 27.
At 10:11 6th Jul 2012, Tim wrote:I remember being in a shocking storm in the early 1990's in the South East, when travelling back from Exeter. The motorway was shut down and the A38 ground to a halt, I ended up staying over at some where close to Weston Super Mare.
Complain about this comment (Comment number 27)
Comment number 28.
At 10:26 6th Jul 2012, greensand wrote:“The awful August of 1912”
https://forum.netweather.tv/topic/39868-the-awful-august-of-1912/
“It was the coldest August on record for the CET with 12.9, it was the wettest on record with 192.9mm. There was also some serious flooding for East Anglia”
The whole thread is worth a read.
h/t splitpin at BH
Complain about this comment (Comment number 28)
Comment number 29.
At 13:54 6th Jul 2012, QuaesoVeritas wrote:#28. - greensand wrote:
"h/t splitpin at BH"
No, you are going to have to explain that to me!
I also found a short discussion about the 1703 storm, but they didn't seem to know about the Daniel Defoe book.
Complain about this comment (Comment number 29)
Comment number 30.
At 14:47 6th Jul 2012, QuaesoVeritas wrote:Official UAH figures for June:
Global = 0.369c (+0.077c)
N.H. = 0.54c (+0.096c)
S.H. = 0.199c (+0.058c)
Equivlant to 0.623c, 0.855c and 0.403c respectivey, relative to 1961-90.
https://www.drroyspencer.com/
Complain about this comment (Comment number 30)
Comment number 31.
At 15:07 6th Jul 2012, QuaesoVeritas wrote:Paul Homewood has posted more about English rainfall trends on "Not A Lot of People Know That":
https://notalotofpeopleknowthat.wordpress.com/2012/07/06/english-summer-rainfall-trends/
This more or less reflects what I have been saying myself, i.e. that current rainfall patterns may only represent a return to those which existed prior to the 1960's or earlier.
Complain about this comment (Comment number 31)
Comment number 32.
At 15:26 6th Jul 2012, greensand wrote:@29. QV
posted by commentor "splitpin" here:-
https://www.bishop-hill.net/blog/2012/7/4/did-stern-account-for-war-and-peace.html?currentPage=2
Complain about this comment (Comment number 32)
Comment number 33.
At 16:07 6th Jul 2012, QuaesoVeritas wrote:#32. - greensand wrote:
"posted by commentor "splitpin" here:-"
Thanks, I knew it would be obvious.
I don't read B.H. regularly.
But I still don't understand why the hat-tip especially.
Complain about this comment (Comment number 33)
Comment number 34.
At 16:25 6th Jul 2012, greensand wrote:@33. QV
Just to acknowledge how I became aware of “The awful August of 1912”.
I had not heard about it prior to the "splitpin" comment.
Complain about this comment (Comment number 34)
Comment number 35.
At 17:05 6th Jul 2012, Tim wrote:QuaesoVeritas. If summer rain fall is going back to what it was before the 60's, couldn't it be the same for winters. The year before last, was a sign of things to come. We need to plan for that.
Complain about this comment (Comment number 35)
Comment number 36.
At 18:15 6th Jul 2012, QuaesoVeritas wrote:#35. - Tim wrote:
"If summer rain fall is going back to what it was before the 60's, couldn't it be the same for winters. The year before last, was a sign of things to come. We need to plan for that.
I think you are probably correct.
Complain about this comment (Comment number 36)
Comment number 37.
At 18:18 6th Jul 2012, QuaesoVeritas wrote:#34. - greensand wrote:
"Just to acknowledge how I became aware of “The awful August of 1912”.
I had not heard about it prior to the "splitpin" comment."
Sorry, I'm not "tuned in" today.
Complain about this comment (Comment number 37)
Comment number 38.
At 20:25 6th Jul 2012, Leedschris wrote:This spell of weather reminds me of my memories of the summer of 1968 when I was living in the Midlands. interestingly on 1 July that year we also had a sahara dust fall, much like the one we had a couple of weeks back. As the month progressed there was a series of low pressures that produced major flooding in the SW of England on 10th July and then in the Midlands on 11th - some of the worst floods in decades. I think rain totals in Leicestershire were about 70mm overnight (annual rainfall normally about 630mm) and produced flooding that has never been seen since then. Interestingly there were further floods later in the year in SE England
Complain about this comment (Comment number 38)
Comment number 39.
At 20:54 6th Jul 2012, Paul Homewood wrote:Long term Met Office records show that most wet summers occurred during the Little Ice Age during the 18th and 19th centuries. The 3 wettest summers since 1776 were 1912, 1879 and 1829. Since about 1976, however, there has been a gradual trend to wetter summers again.
Don't automatically assume wet summers mean global warming, as the opposite seems to be true.
https://notalotofpeopleknowthat.wordpress.com/2012/07/06/english-summer-rainfall-trends/
Complain about this comment (Comment number 39)
Comment number 40.
At 20:57 6th Jul 2012, Paul Homewood wrote:I should also point out that DEFRA models project much drier summers. (They also project wetter winters, that have in fact been getting drier in the last few years).
Perhaps Paul can tell us what this tells us about the accuracy and usefulness of their models?
Complain about this comment (Comment number 40)
Comment number 41.
At 22:22 6th Jul 2012, jkiller56 wrote:to Leedschris #38
Yes, I remember the summer of 1968 - it was a bit of an oddity. V.wet in the east but at times unusually warm and dry in western parts. We had a 2 week hol in N.Devon in late July and it was virtually cloudless for the entire duration (my friend on the east coast had an awful time). I believe 1968 was almost the best ever summer in the Western Isles and is remembered by my Lake District friends as a great summer. An interesting factor was the arctic sea ice which I read was at its greatest extent (at least in the Atlantic quarter) in memory - half surrounding Iceland that spring. Perhaps this had something to do with the unusual weather.
So, overall, different in many ways from this year.
As regards the Little Ice Age. Given that we are well past the Milankovitch cycle peak heat imput for this interglacial - it certainly ought to be getting colder by now.
And as for weather comparisons with such times - I guess you would need to check out all the possible contributing factors for individual years like volcanoes, sea ice, blocking highs etc etc - much of which might be difficult to assess from so far back. There are certainly many examples of volcanic disturbances which it is claimed are evident in the paintings of Turner and other artists of the era. The famously cold "year without a summer" (the year Mary Shelly was inspired to write "Frankenstein") - 1816- was caused by a major erruption.
The well known meteorologist H Lamb, relates much of the LIA storminess and general severity to arctic cooling and spreading sea ice - rather the reverse of today's situation.
Complain about this comment (Comment number 41)
Comment number 42.
At 22:47 6th Jul 2012, john_cogger wrote:Did the wet summers happen at the start, middle or end of the LIA? Because we are yet to see any sign of cooling in the temps or places like the arctic.
Complain about this comment (Comment number 42)
Comment number 43.
At 23:25 6th Jul 2012, ukpahonta wrote:Bicentennial Decrease of the Total Solar Irradiance Leads to Unbalanced Thermal Budget of the Earth and the Little Ice Age
Applied Physics Research Vol. 4, No. 1; February 2012
https://www.ccsenet.org/journal/index.php/apr/article/view/14754
Full paper can be downloaded
Complain about this comment (Comment number 43)
Comment number 44.
At 00:08 7th Jul 2012, greensand wrote:@41 jkiller56
"Yes, I remember the summer of 1968"
How old were you in '68?
Complain about this comment (Comment number 44)
Comment number 45.
At 09:39 7th Jul 2012, jkiller56 wrote:John Cogger#42
An interesting point. According to Lamb, the Little ice Age deterioration in Europe began very abruptly after about 1300AD. though a steady increase in storminess in the 13th cent is evident. However, arctic chilling can be traced to an earlier date. His evidence for this is based on the experience of Norse settlers in Greenland etc, where sea ice began to increase around 1200AD- at first intermittently then more permanently from then on. The colonies were, as we know, eventually completely cut off from Europe and thence perished (about 1500AD). Before this southward migrating (retreating) Eskimo met and traded with the Norse for the first time. (so says Lamb).
The rest of the LIA is as they say history but as you say, the arctic chilling element is certainly absent today, whatever other similarities there might be.
To Greensand #44
How old was I in 1968? Old enough! - I kept my first rudimentary weather diary in 1969. How old was Leedschris#38 who also remembers it, for that matter? To be fair I also refer to books of course. Out of interest the mean daily sunshine level in north west Scotland in August 1968 was about 8 hours - over much of eastern England, it was less than 4.
Complain about this comment (Comment number 45)
Comment number 46.
At 10:03 7th Jul 2012, john_cogger wrote:I see Piers is realeasing his full USA forecast on WUWT to prove to doubters he is right.
He has also released a Brit and Ire sumary here -
https://twitpic.com/a4q45r/full
Released on the 28th of June.
He seems to of missed the current heavy rain and floods.
Complain about this comment (Comment number 46)
Comment number 47.
At 11:07 7th Jul 2012, Tim wrote:John Cogger. Piers is re affirming what I have been saying to Paul the weather man since 2006, after working for a Carbon Management company and finding it was a big hoax. I remember in 1976 when we had a very warm summer, that they talked about a new ice age coming. I can remember some extreme events that year and being in a terrific thunder and lightening storm, while camping in Bournemouth, with the family. I think we should be planning for 30/40 years of cold winters and a colder world. Otherwise we will have massive social unrest, with the lack of food. Too much emphasis has been placed on man made global warming and we should always plan for both extremes, I think that is called holistic, but governments to this date aren't built that way. They either focus completely one way or the other. There is always middle ground.
Complain about this comment (Comment number 47)
Comment number 48.
At 11:10 7th Jul 2012, QuaesoVeritas wrote:newdwr54, from your post #72 (July 4th), in the previous topic:
"If my (fairly ragged, it has to be said) CH5 prediction based on previous ENSO 3.4 values is anywhere near right, then there should be a slight rise in CH5 over the next week, followed by a fairly sharp fall into the second week of July. "
This is *not* intended as a criticism, as I realise this isn't an exact science.
The CH5 temp. seems to have fallen by about 0.1 degrees, and the anomaly by about 0.13 degrees since the end of June.
Do you think that the fall you anticipated has come early, or do you expect the fall to continue until the middle of July?
Complain about this comment (Comment number 48)
Comment number 49.
At 11:28 7th Jul 2012, QuaesoVeritas wrote:#40. - PaulHomewood wrote:
"I should also point out that DEFRA models project much drier summers. (They also project wetter winters, that have in fact been getting drier in the last few years)."
Yes, it was my impression that the predictions were that "climate change" would cause wetter winters and drier summers, yet the recent drought (prior to April), was blamed on low winter rainfall, but was still blamed on "climate change". Of course, when specific predictions fail, it is all blamed on "climate chaos" in any case, *not* the inadequacy of the models.
Your recent blog on summer rainfall trends is interesting and coincides with my own view that rainfall in general seems to be returning to the pattern seen prior to 1970.
It isn't just the amount of rain which has increased since then. I calculated the number of "heavy rain days" (over 10mm), in the HadUKP daily rainfall series, which goes back to 1931, for England & Wales, and while it is true that the rolling frequency of days with over 10mm has increased from 12.8 for the 10 years ending 1978, to 20.1 by 2009 (2011 = 18.1), that only represents a return to similar levels in the early 1960's.
Since there is a strong correlation between annual rainfall and days with over 10mm, it is possible to estimate the number of days from the longer-term annual figures and it seems quite likely that "heavy rain days" were equally frequent, possibly more frequent, in the 1920's, 1870's and 1760/70's.
Complain about this comment (Comment number 49)
Comment number 50.
At 13:05 7th Jul 2012, oldgifford wrote:In many towns, people have been battling to stop rising water entering their homes.
https://www.bbc.co.uk/news/uk-18744189
"Dr Claire Goodess, Senior Researcher in Climatic Research Unit at the University of East Anglia, says over the next few decades there will be an increase in heavy rainfall events."
From the video, and I'm not a stenographer.
For the decades to come.
Increase in heavy rainfull events
Increase in dry hot temperatures more heatwaves
Lots of exteme weather events.
Is this the greenhouse effect?
Human activity is changing the risk of such events.
Put your hat on, watch out for the frogs, flies, lice and locusts etc.
Interesting review from climate scientists at the Guardian
https://www.guardian.co.uk/environment/blog/2012/jul/03/weather-extreme-blame-global-warming?newsfeed=true
Though I wonder if they handpicked the experts?
Complain about this comment (Comment number 50)
Comment number 51.
At 13:16 7th Jul 2012, oldgifford wrote:https://www.metoffice.gov.uk/climate-change/guide/how
There's a wide range of evidence which indicates our climate is warming:
Increasing temperatures at the surface, above the surface, and in the depths of the ocean
Changes in rainfall patterns
Increasing temperatures
We know from global temperature records that the Earth has warmed by about 0.75°C in the last century. From the 1970s to 1990s warming was faster than over the century as a whole, but the rise has slowed more recently.
Changes in rainfall
Evidence shows rainfall patterns are changing across the globe. Generally, wet places are becoming wetter and dry areas are becoming drier. However, there are also changes between seasons in different regions. For example, rainfall in the UK during summer is decreasing, while in winter it is increasing.
OG - So there it is folks, this summer's rainful isn't happening!
Complain about this comment (Comment number 51)
Comment number 52.
At 20:56 7th Jul 2012, newdwr54 wrote:39. PaulHomewood:
From your link (to your own website, I think?) you say:
"I currently have an FOI request asking [The Met Office] when they will change to 1981-2010, or if not, why..."
I'm not sticking up for the Met Office, because I don't know why they choose to ignore the WMO recommended anomaly reference period. But to my mind it's fairly clear why this isn't continuously updated; others may disagree.
The reason for using 1961- 1990 is that an anomaly is supposed to give us an idea of 'change over time'.
If we continuously update the anomaly reference period to the end of the latest decade (or latest year, or latest month... why not?) then naturally any longer term change will be, at least partially, obscured.
Then again, that may be exactly what certain vested interests would prefer to see.
Complain about this comment (Comment number 52)
Comment number 53.
At 21:18 7th Jul 2012, QuaesoVeritas wrote:#52. - newdwr54 wrote:
"If we continuously update the anomaly reference period to the end of the latest decade (or latest year, or latest month... why not?) then naturally any longer term change will be, at least partially, obscured."
I tend to agree. I would prefer a more stable reference period, for example the 20th century average, although I appreciate that some data don't go back that far. At the moment the plethora of different reference periods is confusing and if they are continually changing, that makes it worse.
I don't really see why a FOI request is required. I can't see that the MO would be reluctant to explain this and I could probably get an answer from my usual contacts, who tend to be quite helpful.
Complain about this comment (Comment number 53)
Comment number 54.
At 21:24 7th Jul 2012, newdwr54 wrote:48. QuaesoVeritas wrote:
"Do you think that the fall you anticipated has come early, or do you expect the fall to continue until the middle of July?"
Thanks, QV. I don't know. If I were to take a guess, it would be that it's the slump come early. It's a weekly estimate that I use, as you know. According to that (and there's no secret to it; it's just ENSO 3.4 from a few weeks ago) then yes, there should have been a slight rise in the week ending 8th July in AQUA Ch.5. Obviously that's not going to happen!
On the longer term prognosis: it will be surprising to me if Ch. 5 continues to fall much further over the next two weeks; but if my rough estimate is anywhere near right, then it should fall more sharply again during the last week in July.
The beginning of of August corresponds to the rise seen in ENSO 3.4 that began in late May. So it should begin warming strongly in Ch.5 around then. All very rough. Likelihood less than 50% confidence.
Congratulations on your UAH forecast, by the way. Very close again. You neglected to mention though that this was the 3rd warmest June in the UAH global record. Also, if HadCRUT3 is 0.623C then it would be the warmest June in that record. I don't think that's likely, as satellites tend to exaggerate warming/cooling during ENSO changes.
Complain about this comment (Comment number 54)
Comment number 55.
At 21:46 7th Jul 2012, QuaesoVeritas wrote:#54. - newdwr54 wrote:
"Congratulations on your UAH forecast, by the way. Very close again. You neglected to mention though that this was the 3rd warmest June in the UAH global record. Also, if HadCRUT3 is 0.623C then it would be the warmest June in that record. I don't think that's likely, as satellites tend to exaggerate warming/cooling during ENSO changes."
Thanks, I hadn't got around yet to looking at rankings.
I don't expect HadCRUT3 to be anything like 0.623c, that is just the re-basing of UAH to 1961-90, but that is unreliable and UAH has been running higher than it should on that basis for a while.
My actual estimate of the June HadCRUT3, based on AQUA CH5, is actually 0.47c, which is almost identical to the May figure, but it might be up to 0.1c higher.
I like to use HadSST2 as a guide to HadCRUT3, but the MO haven't even published the May figure yet and there seems to be something wrong with the HadSST2 web page.
Complain about this comment (Comment number 55)
Comment number 56.
At 21:51 7th Jul 2012, QuaesoVeritas wrote:An interesting divergence of opinion between Roy Spencer and Tamino of "Open Mind", on recent temperatures in the U.S.
https://www.drroyspencer.com/2012/07/june-2012-u-s-temperatures-not-that-remarkable/
https://tamino.wordpress.com/2012/07/07/whew/
I would pay good money to see them having a head-to-head debate on the subject!
Complain about this comment (Comment number 56)
Comment number 57.
At 21:59 7th Jul 2012, QuaesoVeritas wrote:Of course, if those who believe this weather is due to "climate change", are correct, we are on the brink of climate armaggedon.
And all the "petrol-heads" are concerned about is whether they can get a parking space at Silverstone!
Complain about this comment (Comment number 57)
Comment number 58.
At 11:38 8th Jul 2012, OPatrick wrote:"Of course, if those who believe this weather is due to "climate change", are correct, we are on the brink of climate armaggedon."
Seems a tad alarmist.
What most people believe would, I think, better be characterised as 'this weather is influenced by "climate change"'. I don't think there are many people saying 'that's it, from now on we only get heat waves and droughts or floods'. But heat waves, droughts and floods are likely already more frequent as a result of anthropogenic climate change.
Of course it does depend on what you mean by being on the brink. In geological timescales we are on the teeterin of teetering.
Complain about this comment (Comment number 58)
Comment number 59.
At 12:48 8th Jul 2012, ukpahonta wrote:Surely there is an argument for increased weather variability due to a quietening Suns influence, lesser forcings having a greater influence on small timescales. Could this already be shown in CET Min/Max temperatures?
If you look at the monthly min/max temperatures from https://www.metoffice.gov.uk/hadobs/hadcet/data/download.html there is a noticeable greater range of temperature variance for the winter months minimums and maximums than the summer months.Could this be due to the Suns energy having to pass through more atmosphere in winter than summer? It would be useful to see if the same was apparent in the southern hemisphere.
Complain about this comment (Comment number 59)
Comment number 60.
At 20:33 8th Jul 2012, OPatrick wrote:I couldn't see any evidence of a change in the temperature variance for recent years in that data set, just the rising trend in temperatures.
Complain about this comment (Comment number 60)
Comment number 61.
At 21:00 8th Jul 2012, newdwr54 wrote:55. QuaesoVeritas:
Of course I wasn't suggesting that *you* thought that such a high June figure for HadCRUT3 was likely. The satellite data appear to be exaggerated in some way by ENSO shifts. This is a common feature of satellite vrs ground-based readings.
Maybe it should serve as a caution to those who claim that satellite data are superior to ground based? Also, the recent divergence between RSS and UAH is another reason to be dubious of claims that satellite data are somehow more pristine than surface data.
Complain about this comment (Comment number 61)
Comment number 62.
At 21:03 8th Jul 2012, ukpahonta wrote:Have a look at it all:
https://somethingtododownthepub.com/2012/07/07/40/
Rising linear trend is there, more pronounced in some months than others, what would the cause of that be?
Complain about this comment (Comment number 62)
Comment number 63.
At 00:08 9th Jul 2012, QuaesoVeritas wrote:#61. - newdwr54 wrote:
"Maybe it should serve as a caution to those who claim that satellite data are superior to ground based? Also, the recent divergence between RSS and UAH is another reason to be dubious of claims that satellite data are somehow more pristine than surface data."
I think that may be due to the fact that RSS does not cover the North or South Polar regions.
Complain about this comment (Comment number 63)
Comment number 64.
At 08:49 9th Jul 2012, Tim wrote:As Bing Crosby used to sing " I am dreaming of some global warming", I mean white Christmas. I can't remember the last decent summer in the UK, even 2006 finished prematurely.
Complain about this comment (Comment number 64)
Comment number 65.
At 09:19 9th Jul 2012, OPatrick wrote:#62 - ukpahonta - I would guess the greater variation in winter temperatures as opposed to summer temperatures in the UK has something to do with the jet stream. In winter I think the jet stream is generally somewhere over the UK and a small variation in its position can have a significant impact on the UK weather. In summer it tends to flow North of the UK and it takes an exception 'kink' for it to impact on the temperatures.
#64 - Tim - do you remember the record warmth in the spring? Or maybe you've noticed news of some of the exceptional heatwaves elsewhere in the world. Are you sure it's global warming your dreaming of?
Complain about this comment (Comment number 65)
Comment number 66.
At 09:41 9th Jul 2012, OPatrick wrote:ukpahonta, the above was more of a response to your #59 than #62. As to why some months are rising faster than others looking at a single dataset has just too many variables to draw meaningful conclusions. The answer is again probably partly to do with variations in the position of the jetstream. In general warming from increased greenhouse gas concentrations would be expected to be greater in winter than summer, which is, I think, observed on a global scale. The CET record appears to show greatest warming in spring and autumn.
Complain about this comment (Comment number 66)
Comment number 67.
At 10:09 9th Jul 2012, QuaesoVeritas wrote:#62. - ukpahonta wrote:
"Rising linear trend is there, more pronounced in some months than others, what would the cause of that be?"
I had noticed myself that there is a big difference between the rising trend in the January and February mean CET figures and it is difficult to explain, but the origin of this seems to have happened before 1878. I think it is more useful to look at mean figures, since they go back over 200 years more than min/max figures.
Way back in 1700, the 30 year rolling average mean CET for Jan & Feb were almost identical, at about 2.6c, and by 1739, the Feb. figure had risen to about 4.1c while the Jan. figure had only risen to about 3.6c.
Between 1739 and 1795, the Feb. 30 year mean had fallen slightly to 3.8c, but the Jan. figure had fallen to about 2c.
By 1878, (the start of the min/max figures), the Feb. figure had reached 4.3c, while the Jan. figure had risen rapidly to 3.8c, since when, Feb. figures have generally remained static, while those for Jan. have increased, albeit with a lot of variation. At the moment, the 30 year means are almost identical again, at 4.49c and 4.47c, so I think the real question to ask is, why did Jan. & Feb. CET figures diverge so much during the 18th and 19th centuries, rather than why have Jan. figures increased more quickly than Feb. since 1878. You really have to have a look at a graph of these figures to understand what has been going on since 1659.
As far as the question of why there is greater variability between summer and winter months, I am not entirely convinced of this, because some of the graph scales are different. For example the range in Jan/Feb is only 18 deg., while that in July/Aug. is 26 deg. This may make the variability in summer appear to be smaller. I will do some standard deviation calculations and see if that is confirmed. However, if true, it might be something similar to the fact that N.Pole anomalies are much smaller in summer than in winter.
Complain about this comment (Comment number 67)
Comment number 68.
At 10:27 9th Jul 2012, QuaesoVeritas wrote:#65. - OPatrick wrote:
"Or maybe you've noticed news of some of the exceptional heatwaves elsewhere in the world. Are you sure it's global warming your dreaming of?"
In cities in the U.S.A., where it normally gets warmer in the summer, air conditioning is now use to lower indoor temperatures. On the other hand, these air conditioners produce warmer air, which is emitted back into the outside air. Otherwise, in effect, we are using air conditioners, i.e. consuming fossil fuels, to heat the air in cities, as well as cool the air indoors. The net effect must be positive, since energy is being put into the system. I have no idea what the figures are for the this process, but there can surely be no doubt that this is at least part of the explanation for the UHI effect.
There is also the fact that every three human beings are putting out as much heat as approximately a 1kw electric fire, which again, must be having an effect on temperatures. We consume food and emit heat and the human population has never been higher. The cities themselves act as giant radiators, increasing temperatures in surrounding areas.
Under the circumstances, it therefore doesn't surprise me in the least that record temperatures are seen in and around urban areas.
Complain about this comment (Comment number 68)
Comment number 69.
At 10:46 9th Jul 2012, OPatrick wrote:#67 - I looked at the standard deviations, in 33 year chunks, and the winter months do show greater variance, though I couldn't see any significant change in that variance over time.
#68 - The direct heat has a minute effect on temperatures - I think I remember reading that the direct heat produced by the engines on a jumbo jet during take off makes about the equivalent contribution to global warming as the CO2 emissions from two hairdriers. There is no doubt that the UHI effect exists, but it cannot account for the huge swathe of recent heat records being set across more than one continent. coolwx has a nice graphic showing temeprature records over the past week: https://coolwx.com/record/globemovie.week.php
Complain about this comment (Comment number 69)
Comment number 70.
At 10:52 9th Jul 2012, QuaesoVeritas wrote:Another point regarding the January & February mean CET figures.
It is true that since 1700, the 30 year mean figures have both increased from about 2.6c to about 4.5c, i.e. by 1.9c, or about 0.06c/decade.
However, *most* of this increase occurred between 1700 and 1878, since by then, the Jan. figure had reached 3.8c and the Feb. figure had reached 4.3c.
Otherwise the increases have been approximately:
Jan. 1700 to 1878 = 1.2c (0.067c/decade)
Jan. 1878 to 2012 = 0.7c (0.052c/decade)
Feb. 1700 to 1878 = 1.7c (0.095c/decade)
Feb. 1878 to 2012 = 0.2c (0.015c/decade)
Complain about this comment (Comment number 70)
Comment number 71.
At 11:02 9th Jul 2012, QuaesoVeritas wrote:#69. - OPatrick wrote:
"The direct heat has a minute effect on temperatures - I think I remember reading that the direct heat produced by the engines on a jumbo jet during take off makes about the equivalent contribution to global warming as the CO2 emissions from two hairdriers."
I was talking about air-conditioners, not jumbo jets.
There are a lot more air-conditioners than jumbo jets.
Just remember that it is impossible to cool the atmosphere by the use of fossil fuels.
All human activity increases the atmospheric temperture. Every time we turn on an air-conditioner, or heater, or boil a kettle, or turn on a patio heater, or drive a car, that is adding heat to the atmosphere.
That is quite separate from CO2 emissions, it is the direct addition of heat to the atmosphere. Nothing we do can cool the atmosphere.
Complain about this comment (Comment number 71)
Comment number 72.
At 11:14 9th Jul 2012, Lazarus wrote:Good article in New Scientist looking at weather extremes, how they are outside model forecasts and how they can be caused to changes to and weakening of the jet stream and the rise of blocking patterns.
https://www.newscientist.com/article/mg21528721.800-how-global-warming-is-driving-our-weather-wild.html?full=true
Complain about this comment (Comment number 72)
Comment number 73.
At 11:18 9th Jul 2012, OPatrick wrote:QuaesoVeritas, I fully accept that human activity can add heat directly to the atmosphere and this can even make a measurable, though small, contribution to UHI. However this direct impact pales into insignificance compared to the indirect impact from greenhouse gas emissions.
Complain about this comment (Comment number 73)
Comment number 74.
At 11:51 9th Jul 2012, QuaesoVeritas wrote:#69. - OPatrick wrote:
"I looked at the standard deviations, in 33 year chunks, and the winter months do show greater variance, though I couldn't see any significant change in that variance over time."
You beat me to it!
I compared January and July, minimums and maximums, 10 year and 30 year moving standard deviations.
While winter months do show greater variance in minimum temperatures, the difference is less pronounced in maximum temperatures. That confirms the visual impression from the graphs.
As you say, based on these figures, there seems to be no evidence that variance is any greater now than in the past.
I think that what we have to remember is that what we are talking about, for example, is the varation in minimum temperatures between two January's, 12 months apart and I think from experience one would expect more variability between one winter and the next, than between one summer and the next.
Complain about this comment (Comment number 74)
Comment number 75.
At 12:00 9th Jul 2012, QuaesoVeritas wrote:#73. - OPatrick wrote:
"I fully accept that human activity can add heat directly to the atmosphere and this can even make a measurable, though small, contribution to UHI. However this direct impact pales into insignificance compared to the indirect impact from greenhouse gas emissions."
I take it that there are figures to support that contention?
I admit I don't have any figures but if they exist I would be interested in seeing them.
On the other hand, accordign to Roy Spencer's figures June temperatures in the U.S. were nothing special, after adjustent for population:
https://www.drroyspencer.com/2012/07/june-2012-u-s-temperatures-not-that-remarkable/
Complain about this comment (Comment number 75)
Comment number 76.
At 12:02 9th Jul 2012, Lazarus wrote:QuaesoVeritas,
Regarding warming from direct warming compared to that from increased greenhouse effect you might be interested in this link and the research it references;
https://www.skepticalscience.com/waste-heat-vs-greenhouse-warming.html
Complain about this comment (Comment number 76)
Comment number 77.
At 12:03 9th Jul 2012, QuaesoVeritas wrote:#72. - Lazarus wrote:
"Good article in New Scientist looking at weather extremes, how they are outside model forecasts and how they can be caused to changes to and weakening of the jet stream and the rise of blocking patterns."
Can't access the article without registering.
Complain about this comment (Comment number 77)
Comment number 78.
At 12:42 9th Jul 2012, QuaesoVeritas wrote:#76. - Lazarus wrote:
"Regarding warming from direct warming compared to that from increased greenhouse effect you might be interested in this link and the research it references;
Thanks, that does seem to confirm what OPatrick says, assuming the figures are correct.
Complain about this comment (Comment number 78)
Comment number 79.
At 16:38 9th Jul 2012, OPatrick wrote:QuaesoVeritas, Roy Spencer's 'population adjusted' temperatures seem a bit handwavery. Do you think they're credible?
Complain about this comment (Comment number 79)
Comment number 80.
At 19:03 9th Jul 2012, jkiller56 wrote:Lazarus#72
Yes, read it. Interesting that the observed extremes seem to be greater than those expected by the models. Also that: the warmer - the more variable the extremes.
Jet stream comments v. topical. No mention of new Little Ice age, I see!
Complain about this comment (Comment number 80)
Comment number 81.
At 20:08 9th Jul 2012, QuaesoVeritas wrote:#80. - jkiller56 wrote:
"Yes, read it. Interesting that the observed extremes seem to be greater than those expected by the models. Also that: the warmer - the more variable the extremes. "
A simple question, does that make the models or the weather wrong?
Complain about this comment (Comment number 81)
Comment number 82.
At 20:13 9th Jul 2012, QuaesoVeritas wrote:#79. - OPatrick wrote:
"Roy Spencer's 'population adjusted' temperatures seem a bit handwavery. Do you think they're credible?"
I don't think they're "incredible"!
Complain about this comment (Comment number 82)
Comment number 83.
At 21:13 9th Jul 2012, ukpahonta wrote:#66 OPatrick, Yes the jetstream has a great influence on variability as we are currently witnessing.
#69 OPatrick, I tend to agree that the variance has not been influenced by the modern era.
#74 QV, Just out of interest do you know of any studies that suggest that winter variance should be greater than summer, it's starting to intrigue me now.
Complain about this comment (Comment number 83)
Comment number 84.
At 21:14 9th Jul 2012, OPatrick wrote:I seem to remember someone working out that using Spencer's model the first person moving into a region would have immediately raised the temperature by several thousandths of a degree. There's certainly something 'incredible' about it.
Complain about this comment (Comment number 84)
Comment number 85.
At 21:18 9th Jul 2012, OPatrick wrote:#83 ukpahonta - this is only one data set and of temperatures only. I don't think you can conclude much by looking at it, other than the obvious rising trend of course! I don't know if there is evidence of greater variance in temperatures globally, there is clearly evidence of an increase in extremes, but that's not quite the same thing.
Complain about this comment (Comment number 85)
Comment number 86.
At 22:40 9th Jul 2012, ukpahonta wrote:Move along nothing to see here, except for the obvious rising trend of course!
'I think' we've exhausted that tired old negative concept, don't you.
Complain about this comment (Comment number 86)
Comment number 87.
At 00:38 10th Jul 2012, greensand wrote:81. QuaesoVeritas wrote:
"A simple question, does that make the models or the weather wrong?"
There you go again QV, coming over all logical.
Made my day!
Keeping an eye on Maue and CH5/8, could be interesting
Complain about this comment (Comment number 87)
Comment number 88.
At 09:37 10th Jul 2012, QuaesoVeritas wrote:RSS anomaly figures for June:
Global = 0.338c (+0.106c)
N.H. = 0.536c (-0.016c)
S.H. = 0.132c (+0.234c)
After adjustment to 1961-90, the above are equivalent to 0.485c, 0.697c and 0.269c respectively.
An increase in the global figure, almost entirely due to the S.H., where the anomaly has returned to about the level it was before the large fall last month, which was not reflected in the other series.
This makes me slightly suspicious of the May S.H. figure, especially since the coverage in the RSS data only goes to -70 degrees and therefore excludes most of Antarctica.
Taken together, the UAH and RSS anomalies suggest a small rise in HadCRUT3 to around 0.5c.
Normally I would use the monthly HadSST2 figure to verify this, but for some reason this hasn't been updated since April on the MO website and March on the CRU site.
Unless my browser isn't downloading the latest file for some reason, but it does seem to be refreshing the file when it downloads.
Can anyone see a May figure here:
https://www.metoffice.gov.uk/hadobs/hadsst2/diagnostics/global/nh+sh/monthly
Complain about this comment (Comment number 88)
Comment number 89.
At 11:06 10th Jul 2012, greensand wrote:"Can anyone see a May figure here"
No!
Not sure what is happening with ENSO, latest (Jul 9th) BOM Sub Sea starting to look a little indecisive.
https://www.bom.gov.au/cgi-bin/oceanography/wrap_ocean_analysis.pl?id=IDYOC007&year=2012&month=07
Complain about this comment (Comment number 89)
Comment number 90.
At 11:14 10th Jul 2012, Lazarus wrote:QuaesoVeritas wrote:
"Can't access the article without registering."
It is free to register. But there is also another Article in the Guardian that touches on similar ideas about the jet stream and blocking causing the weather patterns we have been getting in the last few years;
https://www.guardian.co.uk/uk/2012/jul/08/summer-unending-rain
Complain about this comment (Comment number 90)
Comment number 91.
At 17:49 10th Jul 2012, QuaesoVeritas wrote:#58. - OPatrick wrote:
"Seems a tad alarmist. "
Not really, only reflecting what is being said.
See the following carefully edited propaganda:
https://tamino.wordpress.com/2012/07/10/welcome-to-the-rest-of-our-lives/
I wonder whether those who rail against the CEO of Exxon own a petrol driven car?
Complain about this comment (Comment number 91)
Comment number 92.
At 19:27 10th Jul 2012, OPatrick wrote:#91 - I don't think you can just characterise any warnings of increases in extreme events as being predictions of 'climate armageddon'.
"Whatever prediction it is [?] not only does it get warmer but we see more extreme events - welcome to the rest of our lives" - which bit of that would you disagree with? Is that the same as climate armageddon?
I'm also not sure of your point about those who rail against Rex Tillerson. We live in a society which is geared towards things like the motor car and it's difficult to function in it without consuming more than an equitably sustainable amount. This leaves a choice between opting out of society but losing any significant influence over the course that society takes or remaining an active participant, attempting to change it from within and risking accusations of hypocrisy.
Complain about this comment (Comment number 92)
Comment number 93.
At 20:24 10th Jul 2012, jkiller56 wrote:QV#81 asks:
"A simple question...... does it make the models wrong?"
Are questions of "right" or "wrong" ever simple?
I would have thought that it implies on the face of it, that the models are "conservative" rather than "alarmist".
Surely you are not suggesting that if predictive models are not exactly right from the outset, then the entire precept on which they are based is invalidated if improved knowledge requires that some modifications need to be made?
Refinement and modification does not imply weakness. Quite the reverse - it implies strength and flexibility as well as openness on the part of those doing the research. I would have thought that the basis of good rather than bad science.
Complain about this comment (Comment number 93)
Comment number 94.
At 23:38 10th Jul 2012, greensand wrote:Right, wrong, maybe, could be?
Would there be any alarm without a model that says we should be alarmed?
Did alarm from observations promote the need for models?
Or
Did the ability to produce models promote alarm?
Does alarm promoted by the models demand further refinement of the models?
Do the refined models produce further alarm?
Then
Do we not have a self professing prophecy?
Complain about this comment (Comment number 94)
Comment number 95.
At 08:12 11th Jul 2012, QuaesoVeritas wrote:#93. - jkiller56 wrote:
"I would have thought that it implies on the face of it, that the models are "conservative" rather than "alarmist".
Surely you are not suggesting that if predictive models are not exactly right from the outset, then the entire precept on which they are based is invalidated if improved knowledge requires that some modifications need to be made?"
What I think it suggests is that weather extremes are "normal" and that if the models fail to predict them then it is the models which are wrong.
Complain about this comment (Comment number 95)
Comment number 96.
At 08:27 11th Jul 2012, Tim wrote:It looks like the ideal time for the people who believe in global warming to spin, however there is winter to come and if we get the same weather patterns as summer, we could be in for an awful lot of snow and cold weather. I back Piers 100%, as I have been saying since 2006, after leaving a Carbon Management company.
Complain about this comment (Comment number 96)
Comment number 97.
At 08:29 11th Jul 2012, QuaesoVeritas wrote:#92. - OPatrick wrote:
"Whatever prediction it is [?] not only does it get warmer but we see more extreme events - welcome to the rest of our lives" - which bit of that would you disagree with? Is that the same as climate armageddon?
I don't disagree with it, I a quite sure that the "predictions" do say that as the weather get's warmer we see more extreme events. That is because that is what the models are designed to predict.
"This leaves a choice between opting out of society but losing any significant influence over the course that society takes or remaining an active participant, attempting to change it from within and risking accusations of hypocrisy."
So you see not owning a car as "opting out of society", and those who own cars, particularly large 4 wheel drive SUVs, which consume more than the average amount of fuel, are trying to change things from within?
I don't think so. The complaint of most motorists is that fuel is too expensive when in reality it needs to be *more* expensive for private motorists and *less* expensive for public transport.
Complain about this comment (Comment number 97)
Comment number 98.
At 09:01 11th Jul 2012, Tim wrote:Tax on petrol is 70% of the cost, which is 230% tax, this is scandalous and used to pay for the welfare state and NHS. I am driving on the worst roads I have used in 30 years of driving, on top of this the annual tax on roads is increasing. Tax on fuel should be no more than 30% of the purchase price and the welfare and NHS spending should be culled. The government had enough revenue and time to develop clean greener fuels from the North sea oil revenue, but abused their position.
Complain about this comment (Comment number 98)
Comment number 99.
At 10:52 11th Jul 2012, QuaesoVeritas wrote:#83. - ukpahonta wrote:
"Just out of interest do you know of any studies that suggest that winter variance should be greater than summer, it's starting to intrigue me now."
I am afraid that I don't, but I have now looked at the 10 year and 30 year standard deviations in the mean CET series, which starts in 1659, i.e. about 230 years before the max./min. series. Before I go on, I should point out that there is a strong correlation (r^2 = 0.97), between the minimum and mean temperatures for the period 1878 to 2012, with means tending to be about 2.5c higher than mins. on average.
The difference between Jan. and July SDs also seems to be present in the mean CET series, with the mean January SD being about 1.9 and the mean July SD being about 1.1. As well as being higher, the Jan. SD figures are themselves more variable than those for July, which is also the case for minimum CET figures.
However, while I said that there was little evidence for a change in the level of variance in the minimum CET figures, that does not seem to be the case for mean CET figures.
In general the January 10 year SD figures show a linear trend of -0.015c/decade, while those in the 30 year SD figures show a trend of -0.012c/decade.
On the other hand, the trend in both the 10 year and 30 year SD figures for July, show a linear trend of +0.006c/decade. Otherwise, based on mean CET, the variability in January temperatures appears to be declining, while those in July temperatures appear to be increasing very slightly.
On the other hand, a more detailed calculation of the trends in the min. CET SD figures produce a slight declining trend in the July 10 and 30 year SD figures and the January 10 year SD figures, but an increasing trend in the January 30 year SD figures. This may be due to short-term variability in the figures.
What is also apparent from the longer-term figures is that there appears to be a cyclical pattern in the 10 year January SD figures, with a period of roughly 30 years, although I haven't looked at this in detail. We currently seem to be in an intermediate stage between a low point and a high point in this cyclical pattern, which would mean that we might expect greater variability in January mean CET figures over the next decade.
Clearly the above only applies to January & July figures and more analysis of individual monthly and seasonal patterns is probably required.
Complain about this comment (Comment number 99)
Comment number 100.
At 13:45 11th Jul 2012, ukpahonta wrote:What would be extremely interesting is if the summer months variability increased from 2005, will have to check back in 2015 to see how the 10 year SD stacks up.
There was a clip on R4 the other day of a man from DECC who said that the jet stream started to become 'more meandering' from 2005, be nice to find some figures to back that up! A few articles have tweaked my attention regarding Sol around 2005 with an 8 year lag on effect, maybe it's just me.
Complain about this comment (Comment number 100)
Page 1 of 2