
'Flaming' June washout set to continue
The very unsettled weather which has plagued June so far looks set to continue.
Rainfall totals at the weekend were again in excess of an inch (25mm) across parts of North Yorkshire; this followed a very wet and cool Jubilee weekend.
With another area of low pressure set to spoil things this coming weekend, that's three poor weekends in succession.
June is rapidly turning into a month to forget and is likely to end up the wettest since the infamous June of 2007, which caused serious flooding across Yorkshire and Lincolnshire, although there's no indication that rainfall totals this month will reach June 2007's record breaking levels.
An active weather front will bring heavy rain to many areas through Thursday night and into Friday, with its associated area of low pressure becoming slow moving across the UK over the weekend.
The chart shown below is for Saturday.
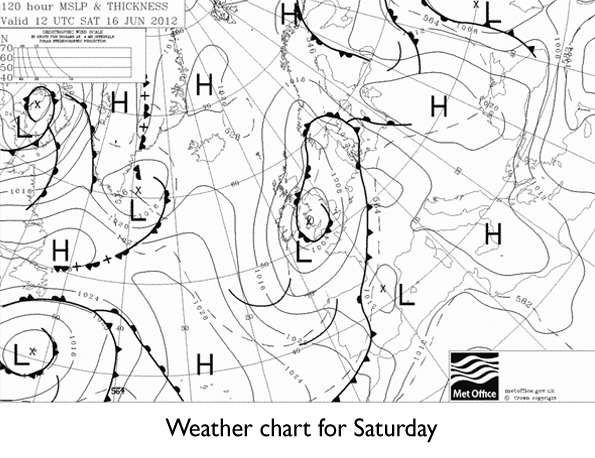
At this time of the year it's an indication that heavy, thundery showers are almost inevitable which could lead to some localised flooding.
Last weekend a number of events, including the Bradford Mela and the Honley Show, were cancelled due to waterlogged ground.
The worry must be that events planned this coming weekend could fall foul of the inclement weather too.
There are some indications that pressure may start to recover next week, leading to something of an improvement in our weather hopefully in time for the Olympic torch arriving in Yorkshire.
But there's certainly no indication of anything that could be remotely described as prolonged, warm & settled on the way in Yorkshire and Lincolnshire anytime soon.
UK summers are often a case of grab any fine weather while it lasts, and this may well be good advice through the rest of 'flaming' June, and into early July.
Follow me on twitter @Hudsonweather
 Hello, I’m Paul Hudson, weather presenter and climate correspondent for BBC Look North in Yorkshire and Lincolnshire. I've been interested in the weather and climate for as long as I can remember, and worked as a forecaster with the Met Office for more than ten years locally and at the international unit before joining the BBC in October 2007. Here I divide my time between forecasting and reporting on stories about climate change and its implications for people's everyday lives.
Page 1 of 2
Comment number 1.
At 18:57 12th Jun 2012, openside50 wrote:I cant take much more of this global warming - the drought means I get a £1000 fine if I turn on my back garden hose - taxes going through the roof because of the catastrophic and accelerating warming the world has seen since 1998
Where will it all end?
Complain about this comment (Comment number 1)
Comment number 2.
At 19:23 12th Jun 2012, QuaesoVeritas wrote:The UKMO forecast at the end of March, which predicted that the drought would continue during April to June, is looking ever more incompetent!
Complain about this comment (Comment number 2)
Comment number 3.
At 19:51 12th Jun 2012, mjmwhite wrote:"Weatherman Bill Giles believes that global warming will give us a Mediterranean climate within 20 years. Whether he's right or wrong, the gardens of Britain are already metamorphosing, Anna Pavord discovers"
Friday 23 August 1996
https://www.independent.co.uk/life-style/bring-on-the-olives-and-bananas-1310987.html
Only 4 years to go.
Complain about this comment (Comment number 3)
Comment number 4.
At 20:09 12th Jun 2012, openside50 wrote:Cant believe those low lying pacific islands - that were about to be submerged by catastrophic and accelerating sea levels rises caused by global warming - are still alive and kicking also
And years after they were supposed to have gone too - predictions made circa 95 too
Complain about this comment (Comment number 4)
Comment number 5.
At 20:46 12th Jun 2012, E Gouthwaite wrote:So when can we get your In-Laws caravan out next :)
Complain about this comment (Comment number 5)
Comment number 6.
At 23:17 12th Jun 2012, QuaesoVeritas wrote:The extended NCEP/CFSR GFS forecast, on the Ryan Maue website is showing mostly below normal temperatures for the UK until at least June 28th.
I haven't added the numbers up, but the global anomalies seem to also decline from about the 22nd. Of course, that's a long way off, and it could all change.
https://policlimate.com/weather/current/ext_raw_temp_c.html
Complain about this comment (Comment number 6)
Comment number 7.
At 01:42 13th Jun 2012, quake wrote:Looks like the arctic has our summer if those highs on the map are anything to go on. Would explain the sharp drop in sea ice in the past week.
Complain about this comment (Comment number 7)
Comment number 8.
At 08:15 13th Jun 2012, john_cogger wrote:Looks like the sea ice is currently lowest or second lowest on the record. Global temps set to be within the top 10 without the forecast El Nino. Yup nothing to see here... move along... head in sand....
Love how Maue's models are often used by those saying modeals are all rubbish... (not you QV it has to be said).
Complain about this comment (Comment number 8)
Comment number 9.
At 09:00 13th Jun 2012, QuaesoVeritas wrote:#8. - john_cogger wrote:
"Love how Maue's models are often used by those saying modeals are all rubbish... (not you QV it has to be said)."
In order to evaluate a model, it is necessary to look at it's output and evaluate it.
I have been known to criticise models in the past and generally speaking, I am "sceptical" about them. I know that they are not the real world, but representations of the real world by humans, who may not be neutral.
Specifically in the case of the one on the Ryan Maue website, I don't automatically assume it is correct, and I have attempted to find out in the past how it works, i.e. are the anomalies for individual locations and specific times, relative to the climatology for that specific location and time, or to some other area or time period, but I haven't been able to find that out.
There used to be a diurnal pattern to the anomalies, i.e. the global anomaly seemed to be at it's highest at hour 00. Ryan Maue admitted that to me, but I don't know if that has been fixed or if it makes a difference to the overall anomaly. Looking at the model, the global anomaly always seems to be highest at hour 00, but there may be valid reasons for that, e.g. it could be something to do with the distribution of land on the planet in relation to the position of the sun.
Complain about this comment (Comment number 9)
Comment number 10.
At 12:37 13th Jun 2012, Lazarus wrote:While it must be impossible to say how much any weather is directly affected by current warming, droughts and floods are typical of what to expect in a warming world.
Just finished Mann's Book on the politically motivated attacks he and other climate scientists have had to endure. Interesting to see that Paul gets a mention in it too.
Complain about this comment (Comment number 10)
Comment number 11.
At 13:04 13th Jun 2012, QuaesoVeritas wrote:#10. - Lazarus wrote:
"While it must be impossible to say how much any weather is directly affected by current warming, droughts and floods are typical of what to expect in a warming world."
They are also what could be expected in a non-warming world.
Unless your suggesting that droughts and floods have only started recently?
I seem to recall one or two of them in the Bible.
Complain about this comment (Comment number 11)
Comment number 12.
At 13:16 13th Jun 2012, Lazarus wrote:Perhaps you miss the point. Such things have always existed but a warming world will mean more weather extremes at the warming end - droughts due to additional heat evaporating moisture from the ground, and floods due to warmer air, that holds more moisture, dumping it when precipitation does occur.
We know the world is warming and there is increasing evidence of heat related weather extremes and records being broken. This should not happen if temps remain stable and actually reduce if they cooled.
Complain about this comment (Comment number 12)
Comment number 13.
At 13:35 13th Jun 2012, lateintheday wrote:Last time I read a forecast like this was about a week before that really nice spell of weather in mid-late May. Get the sun cream out folks! This time next week we'll all be sunbathing by the sound of it.
Complain about this comment (Comment number 13)
Comment number 14.
At 14:00 13th Jun 2012, John Marshall wrote:Anyone who thinks that temperatures should remain stable has not looked at history but must rely on output from realclimate.com.
There is a report today on Anthony Watts web site about the Law Dome, Antarctica, data set which is the highest resolution ice core data yet available. 18/16O isotope measurements show clearly that the MWP was much warmer than today and that we are still in a cool period today. Looking at this data and one realizes that today's weather is not too bad and about what you would expect.
Sorry but there is no such thing as a normal/average temperature or rainfall. We get what we get and so must adapt. Flood mitigation should include French, open, flood drainage channels which are far more efficient than our enclosed, install and forget, ones and ensure that potential floodwater is removed to the sea asap.
Complain about this comment (Comment number 14)
Comment number 15.
At 14:13 13th Jun 2012, John Marshall wrote:There is a nice little, 7 pages, report on the SPPI web site which is about storm frequency in the UK and the conclusions are that severe storms occurred more during the LIA when it was colder than today.
Just thought I would throw that into the discussion.
Complain about this comment (Comment number 15)
Comment number 16.
At 14:53 13th Jun 2012, john_cogger wrote:@14 John Marshall
"18/16O isotope measurements show clearly that the MWP was much warmer than today and that we are still in a cool period today."
No that 1 graph doesn't show that.
Complain about this comment (Comment number 16)
Comment number 17.
At 15:56 13th Jun 2012, saga106 wrote:Hi, This month is turning out very good for me. OK we could do with the rain but these temperatures is just the kind of temperature I like. If the sun out then I could do with a few degrees lower than what it is now. I only love the boiling hot weather when I am in Cornwall. I really hate the hot weather with the sun out in South Yorkshire. I prefer this weather too as you don't see anybody when I am out and about. So when it is a boiling hot day and it gets up to 30 degrees and the sun is out not everybody is in a good mood.
Complain about this comment (Comment number 17)
Comment number 18.
At 17:08 13th Jun 2012, quake wrote:A goldmine of falsifiable weather predictions from another non-mainstream weather forecaster (never heard of him before though).
https://www.mirror.co.uk/news/uk-news/uk-weather-sun-could-be-on-the-way-880441
Here are the relevant predictions:
"The respected amateur meteorologist, who uses phases of the moon and his observations of nature to make his predictions, said: “Unfortunately, this wet wea-ther and cold easterly wind is going to stay with us until the end of June.
“But the heat will arrive in the first week of July and last right through to the 15th. Temperatures might even get to 30C by the middle of the month.
“The second week of the Olympics in particular will be a scorcher. London will cook so much the Olympic Park will be covered in smog – just like in Beijing.”
He reckons Wimbledon will also bake during the second week of the tournament from July 2 – but only after rain has washed out the first week of tennis."
"Despite the heavy rain, Mr King said the hot, dry weather predicted for July and August could mean the drought in the South East continues into next year.
He believes by the end of the summer the water shortage would be worse than that of 1976, when some households could not even use their taps.
And according to Mr King, whose forecasts focus on London and the South East, there won’t be a repeat of last year’s glorious autumn. He said the first two weeks of September will be pretty good but then rain storms will come in."
Complain about this comment (Comment number 18)
Comment number 19.
At 17:50 13th Jun 2012, QuaesoVeritas wrote:#12. - Lazarus wrote:
"Perhaps you miss the point."
No, I know precisely what point you are making, that "in theory", a warmer world would result in more droughts and more flooding.
The only problem is that there is no evidence to support the "theory" that we are experiencing more droughts or floods than in the distant past.
In England & Wales, average annual rainfall was much lower in the 1780's, early 1800's, 1850's and 1890's than it is now. Also, annual rainfall and the frequency of days with over 10mm of rain, has increased over the last 30 years, but that simply reflects a return to a similar situation to that which existed in the 1960's. Annual rainfall and probably heavy rain days, were at their highest in the 1880's.
In any case, we haven't had a drought, we have had below average rainfall and any water shortage is probably due to increased consumption and wastage.
There appear to be more floods but that is probably due to the fact that there are more houses built on flood plains than in the past.
Also, it was predicted that "climate change" would cause WETTER winters and DRYER summers, but the recent "drought" was supposedly due DRIER winters and the current flooding is apparently due to WETTER summer weather, so they can't be due to "climate change".
The UKMO forecast a drier than average weather in May-June, no doubt in line with "climate change" theory, but we actually got wetter than average weather.
Oh, but I forgot, "climate change" means that weather is less predictable, so the MO forecast wasn't wrong because the MO models were wrong, but because "climate change" makes it more difficult to forecast.
Complain about this comment (Comment number 19)
Comment number 20.
At 18:03 13th Jun 2012, QuaesoVeritas wrote:#18. - quake wrote:
"A goldmine of falsifiable weather predictions from another non-mainstream weather forecaster (never heard of him before though)."
I would prefer the term "verifiable", rather than "falsifiable", but it will be interesting to watch how these predictions turn out.
I would love to know how he uses phases of the Moon to predict the weather.
It's amazing how these newspapers turn such people, now that the MO doesn't publish long range forecasts.
Complain about this comment (Comment number 20)
Comment number 21.
At 19:18 13th Jun 2012, RobWansbeck wrote:@10, Lazarus wrote:
“ Just finished Mann's Book on the politically motivated attacks he and other climate scientists have had to endure. Interesting to see that Paul gets a mention in it too. “
Little wonder you're confused if you believe that book to be an accurate description of events.
Complain about this comment (Comment number 21)
Comment number 22.
At 22:40 13th Jun 2012, newdwr54 wrote:A great deal of the above comments focus attention on the UK. That's understandable. But the impact of 'global warming' is of course 'global'.
The climate system only emerged from a prolonged natural 'La Nina' cooling episode in mid April 2012.
Despite this, April and May 2012 were both recorded as being inside the top five warmest months, respectively, recorded by UAH satellite data analysis.
You can say that UAH only runs from 1979; but UAH observations re April 2012 are supported by the surface temperature data providers, all of which run for over 130 years (May is not yet published in these sources).
Consider also that the folks who process UAH data are not especially noted for their 'conformist' views re AGW.
Complain about this comment (Comment number 22)
Comment number 23.
At 22:46 13th Jun 2012, QuaesoVeritas wrote:A little late this month, but the May RSS anomaly figures have now been issued:
Global = 0.233c, compared to 0.333c for April.
N.H. = 0.553c, compared to 0.534c for April.
S.H. = -0.102c, compared to +0.122c for April.
The global figure is very close to my estimate of 0.225c based on AQUA CH5.
The rise in the RSS N.H. anomaly was similar to that in UAH, but the fall in the S.H. is much greater than for UAH.
After adjustment to the 1961-90 baseline, the RSS global anomaly is equivalent to 0.38c, whereas UAH was equivalent to 0.543c.
It seems very odd that the unadjusted UAH anomaly, relative to 1981-2010, is higher than the RSS anomaly, relative to 1979-98.
Complain about this comment (Comment number 23)
Comment number 24.
At 23:40 13th Jun 2012, jkiller56 wrote:"Flaming June" so often seems to turn out flaming awful rather than flaming hot - am I right in thinking it's the only month that has shown no warming trend over the last few years?
It was not far off freezing point in some places under clear skies last night.
Notice the persistent Greenland high of late - once again the pattern of bad weather summer or winter. Reading world weather temps recently I notice exceptional low temps in eastern US aswell. Places like Washington DC, New York, Chicago - with max temps below 20 - Phenomenally cold I would have thought.
Yet another bizarre month - but don't worry I'm sure it can't be climate change - its all perfectly normal. After all, ages ago "they" did say it would get warmer and drier in summer - so that refutes all possibility that it could be happening doesn't it?
Complain about this comment (Comment number 24)
Comment number 25.
At 23:56 13th Jun 2012, greensand wrote:@22. newdwr54 wrote:
“You can say that UAH only runs from 1979; but UAH observations re April 2012 are supported by the surface temperature data providers, all of which run for over 130 years (May is not yet published in these sources).
Consider also that the folks who process UAH data are not especially noted for their 'conformist' views re AGW.”
----------------------------------------------
“You can say that UAH only runs from 1979” No need to say it that is exactly what it does!
“but UAH observations re April 2012 are supported by the surface temperature data providers, all of which run for over 130 years (May is not yet published in these sources).”
What has 130 years got to do with it? LIA was between 1350 to about 1850? Last I heard it had been getting warmer ever since? Hasn't it?
“Consider also that the folks who process UAH data are not especially noted for their 'conformist' views re AGW.””
What is the reason for this statement? Are you inferring that the “data” can be influenced by the “views” held by those processing it? If so you have a lot of questioning to do!
Complain about this comment (Comment number 25)
Comment number 26.
At 09:16 14th Jun 2012, QuaesoVeritas wrote:#22. - newdwr54 wrote:
"Despite this, April and May 2012 were both recorded as being inside the top five warmest months, respectively, recorded by UAH satellite data analysis.
You can say that UAH only runs from 1979; but UAH observations re April 2012 are supported by the surface temperature data providers, all of which run for over 130 years (May is not yet published in these sources).
Consider also that the folks who process UAH data are not especially noted for their 'conformist' views re AGW."
Actually, after adjustment to the same base period, the global UAH anomaly has been above the other series for the last two months and looks like doing so in May as well. It is also the series showing the highest trend over 10 years.
Do I take it from this that your "preferred" temperature series is now UAH, or at least until it starts to show greater negative trends than the others?
Complain about this comment (Comment number 26)
Comment number 27.
At 12:15 14th Jun 2012, Lazarus wrote:QuaesoVeritas wrote:
"recent "drought" was supposedly due DRIER winters and the current flooding is apparently due to WETTER summer weather, so they can't be due to "climate change"."
You miss the point that climate change works 'on average' changes. The world is warmer, that will affect the climate in ways that temperatures we have been used to in the past wont. Until some sort of climate equilibrium is reached (meaning natural climate change at the background rate) then climate will be difficult to predict, but with a great deal of certainty, whatever happens will be affected by warming temperatures - ice will melt, seas will rise, areas will dry faster and while there will be more precipitation in others.
RobWansbeck wrote:
"Little wonder you're confused if you believe that book to be an accurate description of events."
Clearly another review by someone who hasn't even opened the cover of the book. Other than personal views the events are all a matter of public record and well referenced within.
Complain about this comment (Comment number 27)
Comment number 28.
At 14:57 14th Jun 2012, Adrian Buckland wrote:Interesting that the author should put the synoptic chart with the thicknesses on.
It illustrates perfectly what I stated in the last blog. The 528 line indicating a mean temperature of 0 degrees c between 1000 mb and 500 mb is virtually gone. This would normally have been the case right at the end of June and early July. The pool of 528 (remnants of deep cold polar air) in mid june should be quite a lot larger. This is the second year in a row this has happened.
Complain about this comment (Comment number 28)
Comment number 29.
At 15:53 14th Jun 2012, Tim wrote:Heavy rain is a sign of global warming, drought is a sound of global warming. Make your minds up! The weather has a mind of it's own, but there is one well known fact, it was warmer in 1000AD than it is now and much colder in the dark ages. The world getting warmer stopped in 1998 according to the theory, from a conscious view point it was 2006. We have had the deluge of water, after all the drought warnings. Now get ready for a period of very cold global temperatures, 30 to 40 years. Too many people make money from this scam, especially governments with taxation, people have a lot to lose by being proofed wrong. Weapons of mass destruction spring to mind. If wind turbines are efficient I am all for them, I love the idea of electric cars as that reduces pollution. I would like to be a Vegan, but that takes time. I believe in a Green society, but not trying to control things out of our control, like the weather.
Complain about this comment (Comment number 29)
Comment number 30.
At 16:19 14th Jun 2012, QuaesoVeritas wrote:#27. - Lazarus wrote:
"You miss the point that climate change works 'on average' changes."
No I don't, I simply disagree on the interpretation of the evidence and on the likely consequences.
In any case, it is all very well to say that "climate change" works on averages, which I agree with, but virtually every example of extreme weather is put forward as an example of "climate change" in action, when there is no specific evidence for that.
Complain about this comment (Comment number 30)
Comment number 31.
At 17:09 14th Jun 2012, QuaesoVeritas wrote:The NCDC/NOAA anomaly figures for May, with changes since last month are:
Global = 0.66c (+0.01c)
N.H. = 0.85c (-0.04c)
S.H. = 0.47c (+0.05c)
The above are equivalent to 0.52c, 0.76c and 0.29c respectively, after adjustment to the 1961-90 base period used by HadCRUT3.
So very little change in the figures since last month, with a small fall in the N.H. anomaly and a small rise in the S.H. anomaly, which changes are in the opposite direction to those in UAH and RSS. I find the differences between the NCDC and RSS S.H. anomalies particularly surprising. It will be interesting to see what the GISS S.H. anomaly does this month, since last month it recorded a large fall when the others increased.
Based on NCDC/NOAA, it looks likely that the HadCRUT3 global anomaly will show a slight rise over last months 0.482c, which would put it well above my estimate of 0.4c based on AQUA CH5.
Complain about this comment (Comment number 31)
Comment number 32.
At 18:44 14th Jun 2012, john_cogger wrote:@29 Tim
"The weather has a mind of it's own, but there is one well known fact, it was warmer in 1000AD than it is now and much colder in the dark ages. "
Fact??
Complain about this comment (Comment number 32)
Comment number 33.
At 20:40 14th Jun 2012, RobWansbeck wrote:@27, Lazarus wrote:
“ Clearly another review by someone who hasn't even opened the cover of the book. Other than personal views the events are all a matter of public record and well referenced within. “
There is no need to open the book. You only need to read the first sentence of the description to realize that the book is inaccurate:
“ The ongoing assault on climate science in the United States has never been more aggressive, more blatant, or more widely publicized than in the case of the Hockey Stick graph -- a clear and compelling visual presentation of scientific data, put together by MichaelE. Mann and his colleagues, demonstrating that global temperatures have risen in conjunction with the increase in industrialization and the use of fossil fuels. “
As we now know, the critics of his 'clear and compelling visual presentation of scientific data' were correct. It may have been a 'clear and compelling visual presentation' but it was a function of flawed methodology rather than a function of 'scientific data'.
Complain about this comment (Comment number 33)
Comment number 34.
At 21:19 14th Jun 2012, ukpahonta wrote:If I were to make a prediction about the future variability of weather then I would have to suggest that we will be heading into a period of extremes.
The reason though is not down to global warming, CO2 or mankind as a source. If the Sun is going to have an extended minimum then the greatest source of energy will drop which means that smaller forcings of temperature will have a greater effect obviously on smaller timescales.
You only have to look through the annals of previous minimums to see the records of seasonal weather extremes, droughts,floods, freezing winters. It happened before and I have total confidence that it will happen again.
Complain about this comment (Comment number 34)
Comment number 35.
At 21:43 14th Jun 2012, QuaesoVeritas wrote:Oh dear!
https://opinion.financialpost.com/2012/06/13/junk-science-week-climate-models-fail-reality-test/
Complain about this comment (Comment number 35)
Comment number 36.
At 22:38 14th Jun 2012, ukpahonta wrote:"In my work with Jonty and Mat Collins, we try to quantify how similar a collection of simulators are to reality. This is represented by a number we call ‘kappa’, which we estimate by comparing simulations of past climate to reconstructions based on proxies like pollen. If kappa equals one, then reality is essentially indistinguishable from the simulators. If kappa is greater than one, then it means the simulators are more like each other than they are like reality. And our estimates of kappa so far? Are all greater than one. Sometimes substantially."
https://allmodelsarewrong.com/limitless-possibilities/
Complain about this comment (Comment number 36)
Comment number 37.
At 10:17 15th Jun 2012, QuaesoVeritas wrote:The NASA/GISS temperature anomalies for May are as follows:
Global = 0.65c, compared to a revised 0.55c for April
N.H. = 0.88c, compared to 0.95c for April
S.H. = 0.43c, compared to 0.16c for April
After adjustment to 1961-90, the above are equivalent to 0.54c, 0.82c and 0.29c respectively.
A larger rise in the GISS than other series so far, but that only brings it in line with the May UAH and NOAA anomalies.
So far, the satellite N.H. anomalies are up slightly, while the non-satellites are down slightly.
On the other hand, the S.H. anomalies are in the opposite direction, with RSS showing a big fall and GISS showing a big rise.
As I mentioned earlier, last month the GISS S.H. anomaly was very low, and this month's figure has brought it in line with NOAA, while RSS is now roughly where GISS was last month.
Complain about this comment (Comment number 37)
Comment number 38.
At 10:39 15th Jun 2012, newdwr54 wrote:33. RobWansbeck wrote:
"As we now know, the critics of [Mann et al, ] 'clear and compelling visual presentation of scientific data' were correct. It may have been a 'clear and compelling visual presentation' but it was a function of flawed methodology rather than a function of 'scientific data'.
This has by no means been demonstrated, no matter how many times you claim otherwise. Criticisms of the Mann et al 1998 have been repeatedly rebutted, as described here: https://en.wikipedia.org/wiki/Hockey_stick_controversy
So to say that we now "know" the critics of Mann et all were "correct" is unsupportable. At best this is your opinion. It also ignores the host of other global climate reconstructions by different authors that give very similar results to Mann et all 1998.
Complain about this comment (Comment number 38)
Comment number 39.
At 10:55 15th Jun 2012, newdwr54 wrote:37. QuaesoVeritas:
Thanks QV. I think that makes May 2012 the joint warmest in the NASA global record, doesn't it (along with 1998 and 2010)?
It was the second warmest globally in NOAA and the fourth warmest in UAH.
NOAA are also saying that NH land and ocean, and global 'land surface' temps in May 2012 were both the warmest on record.
https://www.ncdc.noaa.gov/sotc/global/2012/5
Complain about this comment (Comment number 39)
Comment number 40.
At 11:51 15th Jun 2012, QuaesoVeritas wrote:#39. - newdwr54 wrote:
"I think that makes May 2012 the joint warmest in the NASA global record, doesn't it (along with 1998 and 2010)?"
I haven't had a chance to do any comparisons (I don't think individual monthly records are significant anyway), but are correct that at 0.65c, May 2012 is the same as May 2011, but the figure for 1998 was 0.66c.
So far the mean for 2012 is 0.484c, compared to 0.480c in 2011 and 0.632c in 1998.
Given that temperatures are supposed to be rising, I would have expected this year to be warmer than 1998, and there seems to be little chance of the 1998 annual figure being broken.
Of course, according to UKMO predictions, that should be happening soon.
I am sure that you are correct about the NOAA figures.
Complain about this comment (Comment number 40)
Comment number 41.
At 12:04 15th Jun 2012, John Marshall wrote:#32 john_cogger
Well the ice core data shows that but then you don't believe them do you.
Complain about this comment (Comment number 41)
Comment number 42.
At 12:51 15th Jun 2012, ukpahonta wrote:Some May detail:
https://www.theregister.co.uk/2012/06/15/noaa_may_2012_report/
For those who don't object to the reg!
Complain about this comment (Comment number 42)
Comment number 43.
At 13:32 15th Jun 2012, newdwr54 wrote:40. QuaesoVeritas wrote:
"So far the mean for 2012 is 0.484c, compared to 0.480c in 2011 and 0.632c in 1998.
Given that temperatures are supposed to be rising, I would have expected this year to be warmer than 1998, and there seems to be little chance of the 1998 annual figure being broken."
Why would you expect temperatures in Jan-May 2012 to be warmer than they were for the same period in 1998 QV?
El Nino conditions were officially declared by NOAA from May 1997 until April 1998. It was one of the warmest on record. Given the lag between SST and surface air temperature, surface conditions coming in to January 1998 would have been heavily influenced by this natural warming phase of the ENSO, and they would have continued to be affected for months afterwards.
By contrast, the ENSO phase was negative from June 2010 until last month. It was officially in cooling La Nina conditions for two separate periods in that time; July 2010-April 2011, and again from September 2011-March 2012. Again, this allowed abundant time for the lag to establish naturally cooler air temperatures coming into 2012. In fact, we should *still* be experiencing the cooling effects of that prolonged double-dip ENSO cooling phase. https://www.cpc.ncep.noaa.gov/products/analysis_monitoring/ensostuff/ensoyears.shtml
These ENSO events alone (not to mention reduced TSI) would certainly account for the temperature difference between Jan-May 1998 vrs Jan-May 2012. Extreme ENSO events can easily mask the underlying AGW rate, estimated to be ~ +0.17C per decade over 30 years (Foster and Rahmstorf, 2011), if taken over a shorter timespan.
I tend to agree that 2012 is unlikely to beat 1998, since we are still officially in ENSO neutral conditions. Even if EL Nino comes late in 2012 there probably won't be sufficient time for it to break any annual records. If El Nino does form, then 2013 is looking likely to be very warm indeed.
Complain about this comment (Comment number 43)
Comment number 44.
At 14:31 15th Jun 2012, ukpahonta wrote:Expect an energy influx this weekend:
https://www.spaceweather.com/
'Here on Earth, the impact is likely to trigger a geomagnetic storm around the poles. High-latitude sky watchers should be alert for auroras on June 16th'
Complain about this comment (Comment number 44)
Comment number 45.
At 18:05 15th Jun 2012, QuaesoVeritas wrote:#43. - newdwr54 wrote:
"Why would you expect temperatures in Jan-May 2012 to be warmer than they were for the same period in 1998 QV? "
What I said was "Given that temperatures are supposed to be rising, I would have expected this year to be warmer than 1998".
What I meant was that if you believe that temperatures are rising in accordance with "global warming" theory, the surprising thing is that this year isn't warmer than 1998.
Given that I don't actually believe that, I personally wouldn't expect this year to be warmer than 1998.
I would be interested to know when you think the 1998 annual figure will be exceeded. From what you say subsequently, I take it that you think that the only reason 1998 was so warm was the 1997/1998 El Nino, and not "global warming", so presumably it will take another record El Nino to beat 1998.
Complain about this comment (Comment number 45)
Comment number 46.
At 20:53 15th Jun 2012, john_cogger wrote:@41 John Marshall
"Well the ice core data shows that but then you don't believe them do you."
The the ice core data doesn't show that. It's a proxy, it's not a direct measure of temperature. It needs analysis. See Mann and his troubles to see how troublesome it is. Or is this proxy a good one cause you think it shows something that you think backs your argument? All proxies bad, apart from ones that appear to back us up? All models bad, apart from the ones that appear to back us up?
"18/16O isotope measurements show clearly that the MWP was much warmer than today and that we are still in a cool period today."
If this proxy data shows the temperature as accurately as you want -
1) It shows the MWP from from approx. 650AD to 1000AD. This is 300 years before the recognised MWP (950AD to 1250AD ish). See various WUWT articles stating the the 950AD to 1250AD period was covered up. So do you agree that this ice core shows that the 950AD t0 1250AD MWP was NOT global?
2) The ice core date doesn't show any significant Little Ice Age 1350AD to 1850AD (in fact it shows this period as average).
3) The Ice core shows that the temperatures in the 20th century are below that of the LIA.
So it moves the MWP by 300yrs, removes the LIA and drops current temps (last 100yrs) into a new ice age.
Perfect proxy.
Complain about this comment (Comment number 46)
Comment number 47.
At 22:08 15th Jun 2012, RobWansbeck wrote:@38, newdwr54, quoting wikipedia and pointing-out that a 'host of other global climate reconstructions' also get things wrong does nothing to help your case.
At least things appear to be improving with the IPCC's latest 'clear and compelling visual presentation' (Gergis et al 2012) being withdrawn after a major error was spotted by blogger Jean S.
It was left to a co-author to correspond rather than the lead author and they played the 'independent discovery' card rather than credit Jean S but still a step in the right direction.
Complain about this comment (Comment number 47)
Comment number 48.
At 04:06 16th Jun 2012, newdwr54 wrote:45. QuaesoVeritas wrote:
"What I meant was that if you believe that temperatures are rising in accordance with "global warming" theory, the surprising thing is that this year isn't warmer than 1998."
Does AGW theory say that warming will rise in lock step with CO2 emissions over periods as short as 15 years?
"I would be interested to know when you think the 1998 annual figure will be exceeded."
If we're still referring to NASA data, then the 1998 annual figure has already been exceeded - twice - 2005 and 2010.
"From what you say subsequently, I take it that you think that the only reason 1998 was so warm was the 1997/1998 El Nino, and not "global warming", so presumably it will take another record El Nino to beat 1998."
I think the La Nina was the *main* reason why 1998 was so warm. However there have been stronger El Ninos on record, and these did not result in such high temperatures, so El Nino can't be the *only* reason why 1998 was so high. And as I point out above, 1998 has already been beaten in all the official surface stn data sets.
Complain about this comment (Comment number 48)
Comment number 49.
At 06:30 16th Jun 2012, newdwr54 wrote:47.RobWansbeck wrote:
".... quoting wikipedia and pointing-out that a 'host of other global climate reconstructions' also get things wrong does nothing to help your case."
Can you point out the parts of the wiki article you disagree with? Your suggestion that the other reconstructions are "wrong" is again your opinion only, and does not represent a scientific consensus view.
"At least things appear to be improving with the IPCC's latest 'clear and compelling visual presentation' (Gergis et al 2012) being withdrawn after a major error was spotted by blogger Jean S."
Gergis et al, 2012 is not an IPCC publication, as far as I know?
Complain about this comment (Comment number 49)
Comment number 50.
At 07:45 16th Jun 2012, Tim wrote:John cogger. The evidence is all around that nature is creating a cooling effect now, not a warming effect. WMD's versus Global warming. Robin Cook blows the lid on WMD's and a few years later the evidence shows they were never true. Nigel Lawson goes on a C4 or C5 documentary about the earth's warming and blows the lid on Margaret Thatchers distortion of Global warming to shut down the coal industry. She pumped money into scientific research to spin a false truth and it all got out of hand, a bit like the EU.
Complain about this comment (Comment number 50)
Comment number 51.
At 08:47 16th Jun 2012, john_cogger wrote:"The evidence is all around that nature is creating a cooling effect now, not a warming effect. "
Really? Go on then, what is this evidence?
Complain about this comment (Comment number 51)
Comment number 52.
At 10:45 16th Jun 2012, QuaesoVeritas wrote:#48. - newdwr54 wrote:
"Does AGW theory say that warming will rise in lock step with CO2 emissions over periods as short as 15 years? "
Yes, as reflected in, for example, the IPCC scenario A2 projections, which shows consistent rises in temperature over 15, 10 and even 5 year year periods.
"If we're still referring to NASA data, then the 1998 annual figure has already been exceeded - twice - 2005 and 2010."
Sorry, I was thinking of HadCRUT3, but we could generalise the question into when do you think a new annual record will be set in any series. For example, will 2013 be a new record in any series?
Another point of course, is that most of the warming is taking place in the N.H.
While based on HadCRUT3, in the N.H. the trend has been negative for about 11 years, in the S.H., that period is 16 years, and while the 30 year trend in the N.H. is +0.219c/decade, in the S.H. it is only 0.087c/decade. So it is questionable whether this can be referred to as "global warming", or "N.H. warming".
Of course, the N.H. includes most of the land, human population and urban development on the planet, so how much of this warming is due to CO2, and how much to the UHI effect?
Complain about this comment (Comment number 52)
Comment number 53.
At 10:57 16th Jun 2012, QuaesoVeritas wrote:I appreciate that this is "off topic", but did anyone see the BBC documentary "Surviving Progress"?
It is clear from the programme that we may have more things to worry about than "climate change" in the future.
The real problem is the growth in human population and the need to keep that population employed by producing more and more consumer goods, which is totally unsustainable.
A treadmill which it is impossible to get off, without resultant economic and social collapse.
You only have to see the chaos caused my the current relatively minor economic problems, to understand what this means for the future.
Complain about this comment (Comment number 53)
Comment number 54.
At 15:37 16th Jun 2012, greensand wrote:49. newdwr54 wrote:
"Gergis et al, 2012 is not an IPCC publication, as far as I know?"
------------------------------------------------------
"Australia’s climate – 1000 years of data"
"The study published today in the Journal of Climate will form the Australasian region’s contribution to the 5th IPCC climate change assessment report chapter on past climate."
https://www.newsucanuse.org/australias-climate-1000-years-of-data/
Complain about this comment (Comment number 54)
Comment number 55.
At 17:10 16th Jun 2012, newdwr54 wrote:52. QuaesoVeritas wrote:
[In response to..] 'Does AGW theory say that warming will rise in lock step with CO2 emissions over periods as short as 15 years?'
"Yes, as reflected in, for example, the IPCC scenario A2 projections, which shows consistent rises in temperature over 15, 10 and even 5 year year periods."
This is true only if you concentrate on the multi-model means QV. This is for illustration purposes only; it does not purport to represent the IPCC's 'best estimate' of future climate projections. When you consider the wide confidence bands that all the IPCC model runs contain, this apparent continuous rise vanishes.
For example, real world temperatures are currently within IPCC A1B confidence bands, even though the warming trend slowed between 1998 and 2011: https://www.realclimate.org/index.php/archives/2012/02/2011-updates-to-model-data-comparisons/
"For example, will 2013 be a new record in any series?"
I certainly wouldn't bet against it. But who knows whether a big volcano will erupt; or whether China will continue to belch out sufficient aerosols to increase albedo? We can't even be sure that ENSO will enter La Nina conditions. But I would say that if it does, and barring volcanic or other aerosol contamination, 2013 is very likely to beat 2010 as the warmest year to date.
Re UHI: has this not been debunked by repeated studies, including the recent BEST one? BEST found that, in N America at least, corrections for UHI have actually had a slight cooling bias on temperature records.
Complain about this comment (Comment number 55)
Comment number 56.
At 17:18 16th Jun 2012, newdwr54 wrote:54. greensand:
Thanks, I hadn't realised that. It will be interesting to see how this one pans out.
However it has no bearing on the validity of the previous temperature reconstructions, which have been repeatedly supported in the scientific literature, despite attacks by McKitterick and co.
You can access the NAS 2006 report on the dispute, which overwhelmingly supported the findings of Mann et al 1999 against most of the criticisms, via this link:
https://www.realclimate.org/index.php/archives/2006/06/national-academies-synthesis-report/
Complain about this comment (Comment number 56)
Comment number 57.
At 18:03 16th Jun 2012, greensand wrote:56. newdwr54 wrote:
"It will be interesting to see how this one pans out."
It sure will
"However it has no bearing on the validity of the previous temperature reconstructions"
Not so sure, the "screening fallacy" issue with Gergis has prompted other questions. We are very early in the Gergis saga and the implications may not be known for quite awhile. Time will tell.
Figure 3. Law Dome versions. red- 2003 version; blue – Mann et al 2008 version ( truncation of 1997 version to 1761-1970).
https://climateaudit.files.wordpress.com/2012/06/ld2_1kyr_compare_m08.png
"It would take a while to calculate the effect of Mann’s use of an obsolete and truncated version of the Law Dome series on his SH reconstruction, but no one should assume that it didn’t and doesn’t “matter”. My guess is that this decision had a material impact. "
https://climateaudit.org/2012/06/04/law-dome-in-mann-et-al-2008/
Complain about this comment (Comment number 57)
Comment number 58.
At 18:31 16th Jun 2012, QuaesoVeritas wrote:#55. - newdwr54 wrote:
"This is true only if you concentrate on the multi-model means QV. This is for illustration purposes only; it does not purport to represent the IPCC's 'best estimate' of future climate projections. When you consider the wide confidence bands that all the IPCC model runs contain, this apparent continuous rise vanishes. "
But the MMM is used by proponents of "global warming", to tell us what temperatures are likely to be in 100 years time, if we do not reduce CO2 emissions, not the individual runs. If the MMM is not "the best estimate of future climate projections", then what is? Which individual model tracks the actual temperature most accurately? The individual models may not show a continuous rise, but the annual variations they show are not accurate. Using the MMM is necessary to smooth out the essentially random annual fluctuations in the models.
"For example, real world temperatures are currently within IPCC A1B confidence bands, even though the warming trend slowed between 1998 and 2011: "
We have discussed this many times before and clearly we are looking at this from a different perspective. It doesn't say the grey area represents the 95% confidence range, it says it encloses 95% of the model runs. So inconsistent are the models that sometimes a model may be at the top of this range and sometimes at the bottom.
Another way of expressing this is to say that in 2011, actual temperatures were lower than all but 1 out of 21 model runs, i.e. below 95% of the model runs.
And that is only because one of the models, cnrm_cm3 was the lowest anomaly of 0.074c in 2011, having been the highest, at 0.758c in 2009.
The same model also showed the lowest anomaly of all the models for 1998, with a figure of -0.103c (v 1981-99), hardly a reliable estimate.
You will no doubt say that individual models cannot be expected to be accurate in individual years, but that is why the MMM is used. If we cannot use the MMM or the individual models, what are we supposed to use?
Incidentally, if the UKMO prediction for the 2012 HadCRUT3 figure is correct, actual temperatures using that measure, will be below 100% of the models in scenario A1B this year.
Complain about this comment (Comment number 58)
Comment number 59.
At 19:07 16th Jun 2012, QuaesoVeritas wrote:As I mentioned in earlier posts, I was puzzled by the fact that the latest RSS temperature figures showed a fall in the S.H. anomaly from +0.122c to -0.102c, while the UAH S.H. anomaly only shows a fall from +0.18c to +0.14c, and both NASA/GISS and NCDC/NOAA show small rises.
One thing I have noticed is that the RSS S.H. region only covers latitudes 0 to -70 degrees, while the N.H. region covers 0 to +82.5 degrees.
I asked RSS why this was the case and they replied that for TLT, they decided that too much of the signal came from the surface, not the atmosphere and that because much of the ice sheet is above 3000 metres, there isn't enough atmosphere left to get a good TLT measurement.
Apparently UAH covers the whole of the S.H. but data for the actual poles is extrapolated, because satellites don't actually measure there.
So, the effective exclusion of the S.Pole from the RSS temperature anomaly series may go some way to explaining the differences in the S.H. anomaly figures.
Complain about this comment (Comment number 59)
Comment number 60.
At 20:20 16th Jun 2012, RobWansbeck wrote:@56, newdwr54 wrote:
“ However it has no bearing on the validity of the previous temperature reconstructions, which have been repeatedly supported in the scientific literature “
Gergis et al 2012 is a high-profile peer-reviewed paper included in the IPCC AR5 Draft. It had therefore been subjected to the full scrutiny of the 'community' yet it was left to a blogger to discover a huge error in the workings. Does that give you confidence in the accuracy of the 'literature'?
The error occurred during a stage to de-trend data. They were de-trending the data in an attempt to reduce the possibility of spurious correlations which almost everyone outside a small group of paleo-climatologists knows make many reconstructions worthless.
Also, as greensand noted, it has brought attention to earlier proxy choices.
If the climate community wish to be treat as trusted professionals then they need to spot and correct their own errors and not leave the job to 'amateurs'.
Of course this would be a very long list and would seriously 'dilute the message' but that's politics not science.
Complain about this comment (Comment number 60)
Comment number 61.
At 01:59 17th Jun 2012, newdwr54 wrote:58. Quaeso Veritas wrote:
“But the MMM is used by proponents of "global warming", to tell us what temperatures are likely to be in 100 years time, if we do not reduce CO2 emissions, not the individual runs.“
In the IPCC charts, the MMMs for each scenario are usually shown with +/- 1 SD. But the entire range of the models by 2100 is also indicated by the grey vertical lines placed outside the graphs – e.g.: https://www.skepticalscience.com/pics/AR4_projections.jpg .
As you acknowledge, many of the individual model runs in each scenario show periods of stasis or even cooling amidst an overall warming trend. This is replicated in the recent temperature record (1970-present), where several decade-long periods of stasis, or even slight cooling, have occurred within an overall warming trend.
Therefore the MMM +/- 1 SD in scenario A1B may yet turn out to be the most accurate projection, but this will *not* be apparent over periods as short as 10 or 15 years. For example, a hypothetical prediction made in 1985 that GISS data would show a strong warming trend over the next 30 years wouldn’t have seemed very likely in Dec 1995. Perhaps this is similar to what you are saying about the A1B MMM in 2011?
https://www.woodfortrees.org/plot/gistemp/from:1970/plot/gistemp/from:1986/to:1995/trend/plot/gistemp/from:1986/trend
Complain about this comment (Comment number 61)
Comment number 62.
At 02:13 17th Jun 2012, newdwr54 wrote:57.greensand and RobWansbeck:
Re Gergis et al 2012:
If it turns out that there is a major flaw in this paper that affects its overall conclusions then it is certainly a blow for the scientists who produced it and passed it in peer review. That has not yet been established, as far as I know?
Even if this is established, it does not impact on Mann et al 2009 and the similar papers that broadly support their conclusions; not unless the same flaw (which is has yet not been shown to be major anyway) can be shown to affect these earlier papers too.
RobWansbeck is again making sweeping statements claiming that Mann et al 2009 has been debunked; just ignoring the numerous reports that supported their conclusions, perhaps most notably the NAS report in 2006, previously cited.
The fact is that the findings illustrated in the 'Hockey Stick Graph' are currently regarded as legitimate by every National Scientific Academy on Earth. Who knows, perhaps that will now change if some major obvious flaw has been discovered that affects the processing or de-trending, etc, but given past performance on that front, I wouldn't hold my breath.
Complain about this comment (Comment number 62)
Comment number 63.
At 03:20 17th Jun 2012, greensand wrote:62. newdwr54 wrote:
“If it turns out that there is a major flaw in this paper that affects its overall conclusions then it is certainly a blow for the scientists who produced it and passed it in peer review. That has not yet been established, as far as I know?”
“That has not yet been established, as far as I know?”
----------------------------------------------------
So just why do you think that the authors have had their AR5 mainstream paper “put on hold”?
They seem to know that there is a problem, why do you not think so?
Do you have access to data that is denied to the authors?
Complain about this comment (Comment number 63)
Comment number 64.
At 08:42 17th Jun 2012, QuaesoVeritas wrote:#61. - newdwr54 wrote:
"As you acknowledge, many of the individual model runs in each scenario show periods of stasis or even cooling amidst an overall warming trend. This is replicated in the recent temperature record (1970-present), where several decade-long periods of stasis, or even slight cooling, have occurred within an overall warming trend."
The individual model runs may show periods of stasis and rising and cooling, but they usually bear no relationship to the actual variations in temperature. If one model did show a close relationship to the actual temperature, then presumably we would use that one in preference to the others.
Complain about this comment (Comment number 64)
Comment number 65.
At 10:02 17th Jun 2012, Tim wrote:John_cogger. Open your door and get out into the countryside. Other than two weeks in March we have had no summer this year and it is nearly the end of June. We have to go back to 2006 to the time we had three months of decent weather. I take academical information with a pinch of salt, it usually lacks common sense. I prefer people who were educated in the University of life, not people who can't see past the end of their own nose. Bill Foggitt must be laughing in his grave at you and your kind. Do you still believe WMD's were true?
Complain about this comment (Comment number 65)
Comment number 66.
At 11:54 17th Jun 2012, QuaesoVeritas wrote:#55. - newdwr54 wrote:
"When you consider the wide confidence bands that all the IPCC model runs contain, this apparent continuous rise vanishes. "
I calculated the net change in temperature anomalies for all of the models in scenario a1b, and compared them with actual changes in temperature anomalies adjusted to 1980-99. The results are as follows:
MODEL/ANOMALY CHANGE
inmcm3_0 0.672
miroc3_2_hires 0.650
ncar_ccsm3_0 0.620
ukmo_hadgem1 0.514
miroc3_2_medres 0.468
ukmo_hadcm3 0.458
cccma_cgcm3_1_t63 0.442
csiro_mk3_0 0.432
giss_model_e_h 0.410
gfdl_cm2_1 0.372
giss_model_e_r 0.362
ipsl_cm4 0.335
giss_aom 0.300
miub_echo_g 0.276
NASA/GISS 0.233
cccma_cgcm3_1 0.232
HADCRUT3 (UKMO) 0.222
UAH 0.217
NCDC/NOAA 0.205
ncar_pcm1 0.196
mpi_echam5 0.184
gfdl_cm2_0 0.144
mri_cgcm2_3_2a 0.129
RSS 0.100
iap_fgoals1_0_g 0.090
cnrm_cm3 0.018
I'm sorry if the formatting is a bit dodgy.
It can be seen from the above that 14 of the 21 models show a rise greater than the highest anomaly rise, i.e. NASA/GISS.
The rise is actually calculated from 1996 and 2011, to include a full 15 years, but in some cases there was a large rise between 1996 and 1997, so it is likely that the situation will look worse at the end of 2012. For example, the increase in HadCRUT3 between 1996 and 1997 was 0.232c, more than the increase between 1996 and 2011.
Note that even the GISS model didn't perform particularly well against the actual GISS anomaly.
I also calculated the coefficient of correlation between the models and NASA/GISS and the results were as follows:
cccma_cgcm3_1_t63 0.585
cccma_cgcm3_1 0.583
ncar_ccsm3_0 0.529
giss_model_e_h 0.518
iap_fgoals1_0_g 0.504
miroc3_2_hires 0.502
miroc3_2_medres 0.494
ukmo_hadgem1 0.484
ipsl_cm4 0.465
giss_model_e_r 0.465
ukmo_hadcm3 0.464
mpi_echam5 0.464
miub_echo_g 0.448
ncar_pcm1 0.429
giss_aom 0.396
csiro_mk3_0 0.294
inmcm3_0 0.193
cnrm_cm3 0.167
gfdl_cm2_1 0.011
gfdl_cm2_0 -0.036
mri_cgcm2_3_2a -0.341
It can be seen that none of the models achieved a statistically significant correlation and some were even negative!
Based on the above, it might be concluded that the cccma_cgcm3_1 model (Canadian Centre for Climate Modelling and Analysis), was the most reliable, but I seem to recall that this model didn't perform very well over the entire period of the model projections.
Complain about this comment (Comment number 66)
Comment number 67.
At 16:22 17th Jun 2012, john_cogger wrote:@65 Tim
Oh we are back on the 'it's cold in my back garden' theory again.
And what have Weapons of Mass Destruction (WMD's) and Robin Cook got to do with the climate? Your whole stand point seems to be that because Robin Cook was correct, that Nigel Lawson must also be correct? One MP being correct doesn't turn the rest into saintly truth tellers.
As for my views on WMD's, I didn't think there was any and said so at the time. So by the Robin Cook theory all I say is correct, so when I say, it's not cooling, you have to beleive me. Robin Cook said so.
Complain about this comment (Comment number 67)
Comment number 68.
At 17:29 17th Jun 2012, newdwr54 wrote:66. QuaesoVeritas:
I have to be honest, I'm not even sure whether the models account for natural oscillations such as ENSO variations over these long term projections. This is because ENSO does not introduce 'new' heat, it just redistributes heat already in the system. The net forcing of ENSO over several decades is therefore neutral, and can be discounted in long term projections.
I'm pretty sure the models account for solar, but obviously there will be a range of projections because of the uncertainties in predicting solar output.
If the models don't take account of the short term effects of ENSO variations, whether warming or cooling, then this makes it difficult to condemn them as flawed, based on time periods as short as 15 years. The multi-model mean is almost bound to be unreliable over such short time scales.
In other words, I don't see that it's valid to argue that AGW theory is definitely flawed just because Jan-May 1998 (strong El Nino warming) was slightly warmer than Jan-May 2012 (strong La Nina cooling), or because the warming trend between those two particular periods slowed.
15 years is not sufficient time for the rather insidious forcing of AGW (~+0.17C/decade) to cancel out the rampant short-term variations forced by ENSO.
Complain about this comment (Comment number 68)
Comment number 69.
At 17:36 17th Jun 2012, newdwr54 wrote:63. greensand wrote:
"So just why do you think that the authors have had their AR5 mainstream paper “put on hold”? They seem to know that there is a problem, why do you not think so?"
They certainly seem to think there is a problem, but is it a "major problem", i.e. one that "affects its overall conclusions" (which is what I said)? We still don't know.
It will be interesting if the problem is acknowledged and the amended paper is reissued with its main conclusions intact. I'm sure that would be very gratifying for Mr McIntyre and co?
Let's just wait and see.
Complain about this comment (Comment number 69)
Comment number 70.
At 18:18 17th Jun 2012, ukpahonta wrote:"The net forcing of ENSO over several decades is therefore neutral, and can be discounted in long term projections."
Not strictly true:
"Since Global SST anomalies respond to changes in NINO3.4 SST anomalies, this relationship implies that the strengths and frequencies of El Niño and La Niña events over multidecadal periods cause the multidecadal rises and falls in global sea surface temperatures. In other words, its shows that global sea surface temperatures rose from 1910 to the early 1940s and from the mid-1970s to present because El Niño events dominated ENSO during those periods, and it shows that global sea surface temperatures dropped from the early 1940s to the mid 1970s because La Niña events dominated ENSO."
https://bobtisdale.wordpress.com/2010/11/17/multidecadal-changes-in-sea-surface-temperature/
Complain about this comment (Comment number 70)
Comment number 71.
At 20:09 17th Jun 2012, RobWansbeck wrote:@69, newdwr54 wrote:
“ They certainly seem to think there is a problem, but is it a "major problem", i.e. one that "affects its overall conclusions" (which is what I said)? We still don't know. “
Co-author David Karoly wrote 'Although this is an unfortunate data processing issue, it is likely to have implications for the results reported in the study.'
Unfortunately the 'overall conclusions' are non-negotiable. The simplest solution would be to 'realize' that de-trending is not required. No one in the community would care as long as the 'overall conclusions' were 'correct'.
Complain about this comment (Comment number 71)
Comment number 72.
At 23:43 17th Jun 2012, greensand wrote:@71. RobWansbeck
Not sure that the issues raised by Gergis et al 2012 will be constrained to de-trended or not. Also not sure that some of the issues raised will be constrained to Gergis et al 2012. Very early days.
Complain about this comment (Comment number 72)
Comment number 73.
At 09:34 18th Jun 2012, QuaesoVeritas wrote:#68. - newdwr54 wrote:
"I have to be honest, I'm not even sure whether the models account for natural oscillations such as ENSO variations over these long term projections. This is because ENSO does not introduce 'new' heat, it just redistributes heat already in the system. The net forcing of ENSO over several decades is therefore neutral, and can be discounted in long term projections."
Personally, I don't see how ENSO can be responsible for long-term warming, unless there is an independant source of additional heat. Of course, it could be that the oceans are absorbing the heat from the sun and that ENSO is the manifestation of the distribution of that heat in the oceans and ultimately to the atmosphere, but that would mean the source of the heat would be the sun, not the oceans as such.
Another possibility is that there is some sort of geological heat source, which is heating the oceans at certain locations, but I presume that has been ruled out.
"If the models don't take account of the short term effects of ENSO variations, whether warming or cooling, then this makes it difficult to condemn them as flawed, based on time periods as short as 15 years. The multi-model mean is almost bound to be unreliable over such short time scales."
On the contrary, if they don't take ENSO into account, then I do think it makes them flawed.
"In other words, I don't see that it's valid to argue that AGW theory is definitely flawed just because Jan-May 1998 (strong El Nino warming) was slightly warmer than Jan-May 2012 (strong La Nina cooling), or because the warming trend between those two particular periods slowed. "
My temperature change figures were actually between 1996 and 2011, but they still show that 66% of the models were higher than the highest observed changes over the period.
I think it was yourself who first suggested that AGW theory didn't predict temperature rises over a period of 15 years, but all of the models do predict rises, most of which were higher than observed increases.
Unfortunately we currently have less than 15 years of data to compare and the evidence SO FAR is that the vast majority of models are excessive, and are becoming more excessive with time.
Unless there is an above average increase in temperatures over the next 15 years, it is likely that actual temperatures will be well outside the range of all of the models. Of course, by then, the AR4 projections will have been replaced by AR5 projections.
Complain about this comment (Comment number 73)
Comment number 74.
At 10:33 18th Jun 2012, ukpahonta wrote:"On the contrary, if they don't take ENSO into account, then I do think it makes them flawed."
I would tend to agree and suggest that more time and money should be spent deciphering the natural cycles so that their influence will overhaul model accuracy.
I would presume that the MET decadal forecast from June 2005, 2 years left, did not allow for a more negative ENSO period and that the Sept 2011 forecast could only be achieved with some strong positive ENSO periods before 2020, all this with a quiet Sun, put your money where your deliberations take you!
https://www.metoffice.gov.uk/research/climate/seasonal-to-decadal/long-range/decadal-fc
Complain about this comment (Comment number 74)
Comment number 75.
At 10:37 18th Jun 2012, ukpahonta wrote:Almost forgot, a little light entertainment to kick start the week:
https://stevengoddard.wordpress.com/2012/06/16/joe-bastardi-explains-the-warm-us-weather-and-what-to-expect-the-rest-of-the-year/
Complain about this comment (Comment number 75)
Comment number 76.
At 14:01 18th Jun 2012, newdwr54 wrote:73. QuaesoVeritas wrote:
"Unless there is an above average increase in temperatures over the next 15 years, it is likely that actual temperatures will be well outside the range of all of the models. Of course, by then, the AR4 projections will have been replaced by AR5 projections."
The basic tone of the 'consensus' argument I've been putting forward is that the global temperature trend over the past 10-15 years has been weighted artificially low due mostly to La Nina conditions that prevailed in the Pacific since 2005.
In the 89 months since Jan 2005, 58 have had negative SSTs in the ENSO 3.4 region and 33 of these have been in officially declared 'La Nina' conditions. This compares to 16 official 'La Nina' months in the same period. Solar output has also been in decline on average since 1998: https://www.woodfortrees.org/plot/pmod/from:1998/plot/pmod/from:1998/trend
Despite this, as you know, NASA, NOAA and HadCRUT4 all have 2010 as the warmest year in their respective records. (Satellite providers have it as the second warmest.) This suggests there is an underlying driver of temperatures that is independent of ENSO and solar forcing. Greenhouse gas concentrations are widely suspected - though not by too many people on this blog, apparently!
If AGW theory is right, and if natural conditions begin to favour warming again, then we should start to see above average global temperatures arriving fairly rapidly. If this *doesn't* occur, then AR5 really will be an interesting read.
Complain about this comment (Comment number 76)
Comment number 77.
At 14:41 18th Jun 2012, newdwr54 wrote:75.ukpahonta:
Glad Joe's on your side.
Complain about this comment (Comment number 77)
Comment number 78.
At 15:31 18th Jun 2012, Lazarus wrote:RobWansbeck wrote:
"There is no need to open the book. "
Ah... I think we have got to the root of your problem...
Complain about this comment (Comment number 78)
Comment number 79.
At 15:51 18th Jun 2012, ukpahonta wrote:My side?
I think I would be happier saying that we are both in the 'sceptic' camp and I have a great deal of regard for Joe.
"The basic tone of the 'consensus' argument I've been putting forward is that the global temperature trend over the past 10-15 years has been weighted artificially low due mostly to La Nina conditions that prevailed in the Pacific since 2005.
A natural process is artificial? Only in a post modern world, hehe.
Still, this graph from the earlier Bob Tisdale link may assist:
https://i56.tinypic.com/zxmsg8.jpg
"Solar output has also been in decline on average since 1998:"
I would agree that SC23 was probably 70% of SC22 but would argue that the real drop off wasn't until after SC23 peak around 2003/4 and I don't expect SC24 to be any greater than 30% of SC22 with SC25 possibly even lower . How long does that take to transfer into GAT? A trillion dollar question.
With a large El Nino in 2009-2010 I would suggest more than 6 years, lets see when the next substantial El Nino appears!
This year, next year, the Japanese don't seem to think so:
https://www.jamstec.go.jp/frsgc/research/d1/iod/e/seasonal/outlook.html
Select ENSO 2-year forecast from the parameters.
Exciting, being around to witness events like this!
Complain about this comment (Comment number 79)
Comment number 80.
At 16:23 18th Jun 2012, newdwr54 wrote:79. ukpahonta:
Joe Bastardi thinks CO2 can't be the cause of warming in the atmosphere because it is heavier than air and therefore sinks.
I kid ye not.
https://mediamatters.org/blog/201203090017
Complain about this comment (Comment number 80)
Comment number 81.
At 18:47 18th Jun 2012, NeilHamp wrote:David Whitehouse has a review of the global temperature for 2012 so far at the "Observatory" at the Global Warming Policy Foundation https://thegwpf.org/
Complain about this comment (Comment number 81)
Comment number 82.
At 22:47 18th Jun 2012, newdwr54 wrote:81. NeilHamp:
Is this the same David Whitehouse who told us in early December 2010 (before November temperature data were in) that "2010 will be remembered for just two warm months, attributable to the El Nino effect, with the rest of the year being nothing but average, or less than average temperature."?
https://thegwpf.org/the-observatory/1973-2010-an-unexceptional-el-nino-year.html
As it turned out, 2010 was the warmest or tied warmest year on record according to NASA, NOAA and now HadCRUT4.
November 2010 (forecast by Whitehouse as "average or less than average temperature") turned out to be above average in every data set we have, including satellite, and the warmest on record according to NASA.
But past performance is no indicator of future performance, as the saying goes.
Complain about this comment (Comment number 82)
Comment number 83.
At 00:24 19th Jun 2012, QuaesoVeritas wrote:A quote from J.B.'s post on the Real Science blog:
"The same change in energy for 1 degree at 80 will produce more than a 15 degree change around 0."
Is he saying that it takes a bigger change in energy to raise temperature by 1 degree if it is warm than if it is cold. That doesn't sound right to me.
Complain about this comment (Comment number 83)
Comment number 84.
At 01:19 19th Jun 2012, RobWansbeck wrote:@72, greensand wrote:
“ Not sure that the issues raised by Gergis et al 2012 will be constrained to de-trended or not. Also not sure that some of the issues raised will be constrained to Gergis et al 2012. Very early days. “
I agree but these issues never seem to concern the 'community' or their supporters, they're simply 'tricks' used to get the desired result.
Personally I believe that the debates about the 'screening fallacy' triggered by the mess-up with de-trending will be the most productive. They have increased awareness of paleo methods and I have yet to see anyone outside the 'community' consider correlation screening valid.
Complain about this comment (Comment number 84)
Comment number 85.
At 01:27 19th Jun 2012, RobWansbeck wrote:@83, QuaesoVeritas wrote:
“ Is he saying that it takes a bigger change in energy to raise temperature by 1 degree if it is warm than if it is cold. That doesn't sound right to me. “
I haven't seen the post but was he talking about radiated energy and could it have been 1.5C?
As you warm something it loses energy at a higher rate so to increase the temperature you have to add not only the energy to increase the temperature but also to compensate for the increased radiative losses.
Complain about this comment (Comment number 85)
Comment number 86.
At 08:57 19th Jun 2012, lateintheday wrote:QV - this may be of interest to you. (at least I think it was you)
About a month ago you asked if anyone had any ideas why NH anomalies tended to peak in spring, then drop off a bit through summer before picking up again in Autumn before falling away in winter.
There's a post over at 'Watts' by Willis regarding time lags - should be near the top. The post itself is not the interesting bit. Towards the bottom of the comments section, Willis responds to gopal panicker (blue box) and shows some numbers for peak solar insolation at 5 degrees north. These numbers follow the pattern you identified in the anomalies.
He provides a link to NASA where the monthly 'insolation by latitude' numbers came from.
Complain about this comment (Comment number 86)
Comment number 87.
At 09:04 19th Jun 2012, QuaesoVeritas wrote:#85. - RobWansbeck wrote:
"I haven't seen the post but was he talking about radiated energy and could it have been 1.5C?"
Do you mean rather than 15c?
If so, no, the quote was verbatim.
You probably have to read the whole thing in congext.
As usual, his language is a bit convoluted.
Complain about this comment (Comment number 87)
Comment number 88.
At 09:15 19th Jun 2012, lateintheday wrote:newdwr54 @73 said . . .
"The basic tone of the 'consensus' argument I've been putting forward is that the global temperature trend over the past 10-15 years has been weighted artificially low due mostly to La Nina conditions that prevailed in the Pacific since 2005."
Does this mean that you now believe that the predominantly ENSO positive phase from the late 1970s to 2005 was responsible for most of the global warming?
Complain about this comment (Comment number 88)
Comment number 89.
At 09:32 19th Jun 2012, QuaesoVeritas wrote:#81. - NeilHamp wrote:
"David Whitehouse has a review of the global temperature for 2012 so far at the "Observatory" at the Global Warming Policy Foundation https://thegwpf.org/"
Dear me, he starts out by saying that the MO haven't updated the HadCRUT3 figure for April yet, but they have.
He is either using the CRU website, which isn't updated, not the MO one, or he is having problems loading the most recent file, which I sometimes have.
As a result I think he has been a bit premature in criticising the MO.
Complain about this comment (Comment number 89)
Comment number 90.
At 10:57 19th Jun 2012, QuaesoVeritas wrote:#86. - lateintheday wrote:
"QV - this may be of interest to you. (at least I think it was you)"
Thanks, I think it was me, but I can't remember the context.
I will check it out.
Complain about this comment (Comment number 90)
Comment number 91.
At 12:28 19th Jun 2012, lateintheday wrote:context
QV wrote . . .
Global temperature and Arctic ice update
9:18pm on 15 May 2012
Oops, I hadn't noticed this entry when I posted this in the previous blog, and as it is more on topic here, I will post it again:
I have been looking at the mean monthly temperature anomalies for the N.H., using RSS data.
Apart from the N.Polar region, i.e. 60 to 82.5 deg. the mean anomaly peaks in April & September, with the peak in April being higher than that in Sept. and are at their lowest in June and December.
However in the case of the N.Polar region, the peaks are in April and December, with low points in February and July. On average, the December peak is higher than that in April.
After September, the other regions anomalies tend to fall, whereas the N.Pole anomalies tend to rise until December, then fall.
Any ideas why the N.Pole would behave differently to the rest of the N.H.?
Complain about this comment (Comment number 91)
Comment number 92.
At 13:39 19th Jun 2012, newdwr54 wrote:88. lateintheday:
"Does this mean that you now believe that the predominantly ENSO positive phase from the late 1970s to 2005 was responsible for most of the global warming?"
According to the NOAA data I used (available here: https://www.cpc.ncep.noaa.gov/products/analysis_monitoring/ensostuff/ensoyears.shtml%29 the split between warm and cold months in ENSO 3.4 in the 30 years from 1976-2005 was fairly even. I suppose we should expect that from an oscillation over that time span?
I make it 188 months above average and 172 average or below. 95 months were classified as officially El Nino conditions, while 76 were officially La Nina conditions. A ratio of 0.8.
If you consider the period from 2006 to the present, only 22 months have been above average, 15 of which were classified as El Nino. In that time 54 months were average or below, with 31 classified as La Nina. That's a ratio of 2.1; i.e. there were more than *twice* as many La Nina months than there were El Nino months between 2006 and the present. Over such a short time span, that is bound to have a negative influence on temperatures.
On the wider point, yes, it's likely that some of the warming between 1976 and 2005 was caused by ENSO. That was certainly true of 1998, for example. But the warming phase of the ENSO has to be balanced against its cooling phase over time spans as long as 30 years.
Studies such as FR11, that filter ENSO out of the underlying temperature trend, have to filter out the warm years as well as the cold ones. That particular paper did so and found an underlying trend of ~ +0.17C/decade between1979-2010: https://iopscience.iop.org/1748-9326/6/4/044022 Whatever caused that residual warming, it wasn't ENSO.
Complain about this comment (Comment number 92)
Comment number 93.
At 14:28 19th Jun 2012, lateintheday wrote:newdwr - thanks for the response, but unfortunately the link didn't work for me.
While I agree that ENSO is unlikely to be the sole cause of the warming, I think you have unwittingly understated the ENSO case. I suspect that your 'number of months above or below' approach significantly underplays the relative size of each event.
This can be seen here
https://en.wikipedia.org/wiki/File:Soi.svg
Complain about this comment (Comment number 93)
Comment number 94.
At 16:10 19th Jun 2012, newdwr54 wrote:93. lateintheday:
You can access the NOAA data I used by Googling 'climate prediction centre: monitoring and data: ENSO'. It's the first NOAA link that comes up. I don't know why the link doesn't work here. You should get a page with colour-coded data going back to 1950.
I've averaged the monthly ENSO anomaly values between Jan 1976 and Dec 2005 and the result is +0.09C. Global surface warming over that period was +0.55C, according to NOAA. Even if we agree to assume that ENSO contributed all of its excess +0.09C to global surface warming (which it couldn't have done, due to energy loss in the transfer process), then this would still only account for less than 1/6 of the total heat build up observed.
Complain about this comment (Comment number 94)
Comment number 95.
At 16:43 19th Jun 2012, QuaesoVeritas wrote:#94. - newdwr54 wrote:
"You can access the NOAA data I used by Googling 'climate prediction centre: monitoring and data: ENSO'. It's the first NOAA link that comes up. I don't know why the link doesn't work here."
The final bracket get's included in the link, which invalidates it.
All you have to do is remove the bracket.
https://www.cpc.ncep.noaa.gov/products/analysis_monitoring/ensostuff/ensoyears.shtml
Complain about this comment (Comment number 95)
Comment number 96.
At 17:18 19th Jun 2012, lateintheday wrote:newdwr54 . . .
are you not conflating pacific regional ssts with a global surface temp warming? If so, the numbers you quote cannot be directly compared in the way you think.
Complain about this comment (Comment number 96)
Comment number 97.
At 18:10 19th Jun 2012, quake wrote:"I've averaged the monthly ENSO anomaly values between Jan 1976 and Dec 2005 and the result is +0.09C. Global surface warming over that period was +0.55C, according to NOAA."
You need to calculate the ENSO trend over 1976-2005 rather than the average and then "scale" that to estimate how much global warming ENSO has contributed over that period.
For a ballpark estimate using ENSO 3.4, I notice during the 1998 El Nino global temperature jumped by about 0.4C and then came back down again. ENSO ONI jumped about +2C. So that implies global temperature increases about 20% as much as ONI.
So lets say the ENSO ONI trend between 1976 and 2005 is 0.1C/decade (I don't know if it does without calculating it, the number is just an example). That would imply ENSO can explain (using all the assumptions above) about 0.02C/decade of the global warming.
I suspect the ENSO ONI trend from 1976 to 2005 is very close to zero, whereas the trend since 2005 is significantly negative.
Complain about this comment (Comment number 97)
Comment number 98.
At 18:14 19th Jun 2012, quake wrote:I forgot to add, scaling global temperature to the 1998 El Nino really is ballpark. For a better estimate you can try to find the best scaling between global temperature jumps/falls and all El Nino/La Nina events. De-trending global temperature and scaling it to fit ENSO would be good enough. Woodfortrees would be ideal for this but bizarrely it's list of data to plot has never included an ENSO index.
Complain about this comment (Comment number 98)
Comment number 99.
At 18:35 19th Jun 2012, QuaesoVeritas wrote:#91. - lateintheday wrote:
"context"
Thanks, I remembered that after I posted #90.
I subsequently found that by definition, all of the monthly anomalies for 1979-98 were zero, since that was the base period, so any apparent pattern only related to the subsequent period 1999-2011/12, which was probably too short a period to form any conclusions. To get around this, I even tried deducting the monthly anomalies from the annual average, but I got the same result, at which point I gave up.
Anyway, I checked out the bit about the monthly variation in insolation figures, and while they do more or less correspond to the monthly variation in overall NH anomalies, and to an extend, the N.Pole anomalies for 1989-98 and 2009-2012, they don't correspond very well to those for 1999-2008.
There again, while I can understand why monthly ABSOLUTE temperatures might correlate to monthly insolation, I don't really see why monthly ANOMALIES should, since the anomalies are relative to the monthly averages, i.e. they have effectively had any seasonality removed.
On the whole, I think that the reason for the apparent increase in the N.Pole anomalies during November & December over the entire RSS series (which you might not expect from monthly insolation), is due to unusually high anomalies in those months during the period 1999-2008, and possibly over a shorter period within that.
Also, as I say, monthly anomalies probably shouldn't correlate to insolation in any case.
Complain about this comment (Comment number 99)
Comment number 100.
At 18:56 19th Jun 2012, newdwr54 wrote:97. quake wrote:
"You need to calculate the ENSO trend over 1976-2005 rather than the average and then "scale" that to estimate how much global warming ENSO has contributed over that period."
The first part of your comment just occurred to me actually while I was on my daily stroll, which is why I rushed back to the blog...
I'm not sure if I've got this right; perhaps you or QV could be of assistance? Using the NOAA data from the link (the thirty-six months from Jan 1976-Dec 2005), I've calculated the linear trend, which is -0.0003C per month. Multiplying that over the whole series (*360) gives -0.11C. Scaling as you suggests means ENSO actually had a slight *negative* forcing on climate, to the tune of around -0.02C, between 1976 and 2005. Erm??
That's a bit of a surprise to me, if it's right. Looking at the data, it isn't so much the El Nino vrs La Nina episodes, it's all the accumulated small changes over the 'neutral' months that result in the overall linear cooling.
As ever I stand to be corrected on my calculations and methods!
Complain about this comment (Comment number 100)
Page 1 of 2