
Global and regional climate update
Average global temperatures in March rose to +0.108C above the 30 year running mean, from -0.116C in February, based on the UAH satellite measurement shown on the graph below.
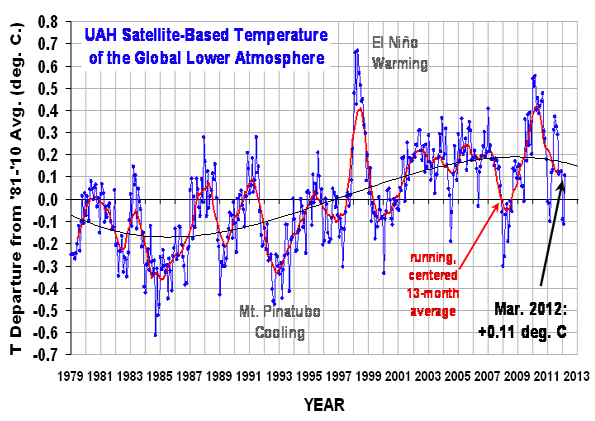
Adjusted to the more standard 1961-1990 mean, global temperatures were approximately +0.361C above normal.
Across the UK, March was the third warmest on record, behind March 1938 and March 1957 respectively. It was the 5th driest on record, and the third sunniest.
More locally across Yorkshire, March was the sunniest since records began at Bradford Lister Park in 1908, and the third warmest. It was also the sunniest on record at Leeming, and although dry with 13.2mm, no records for lack of rainfall were broken.
April has so far been dominated by low pressure. Leeming has recorded 34mm of rain, and in drought hit Lincolnshire, 51mm of rain has fallen already at Coningsby. This is more than their monthly average, with two weeks of the month still to come.
The second half of April looks very unsettled across the UK, with showers or longer spells of locally heavy rain. Most stations look set to record their first month of above average rainfall since last autumn.
Follow me on twitter @Hudsonweather
 Hello, I’m Paul Hudson, weather presenter and climate correspondent for BBC Look North in Yorkshire and Lincolnshire. I've been interested in the weather and climate for as long as I can remember, and worked as a forecaster with the Met Office for more than ten years locally and at the international unit before joining the BBC in October 2007. Here I divide my time between forecasting and reporting on stories about climate change and its implications for people's everyday lives.
Comment number 1.
At 17:16 16th Apr 2012, john_cogger wrote:A double dip la Nina and the 13 month average still didn't go -ve. Interesting months ahead.
Complain about this comment (Comment number 1)
Comment number 2.
At 17:44 16th Apr 2012, Spanglerboy wrote:Paul
you say 'Adjusted to the more standard 1961-1990 mean, global temperatures were approximately +0.361C above normal.'
So the 1961-1990 mean represents what is 'normal'. Amazing what you can learn on a blog.
Complain about this comment (Comment number 2)
Comment number 3.
At 19:22 16th Apr 2012, QuaesoVeritas wrote:#1. - john_cogger wrote:
"A double dip la Nina and the 13 month average still didn't go -ve. Interesting months ahead."
It would have taken a March UAH figure of lower than -1.6c to produce a negative 13 month average.
Hardly likely, even with a double dip La Nina.
Complain about this comment (Comment number 3)
Comment number 4.
At 19:33 16th Apr 2012, QuaesoVeritas wrote:#2. - Spanglerboy wrote:
"So the 1961-1990 mean represents what is 'normal'. Amazing what you can learn on a blog."
That is the definition of "normal" climate used by the World Meteorological Organisation. See under "Global Climate Data Sets":
https://www.wmo.int/pages/themes/climate/climate_data_and_products.php
Complain about this comment (Comment number 4)
Comment number 5.
At 19:57 16th Apr 2012, NeilHamp wrote:I have been waiting for Paul to blog about global temperatures
Here are our forecasts for 2012
Figures in brackets are last year’s forecast
As usual the Met Office heads our "warmist" list
“Warmists”
+0.48 Met Office (+0.44)
+0.45 Newdwr54 (N/A)
+0.43 John Cogger (N/A)
“Neutralists”
+0.42 Mr Bluesky
+0.42 Lazarus
+0.41 quake (+0.36)
+0.40 Paul Briscoe
+0.40 Gagetfriend (+0.30)
+0.40 NeilHamp ( +0.27)
“Coolists”
+0.37 Lateintheday’s Holly Bush
+0.34 QuaesoVeritas (+0.31)
+0.29 millinia (+0.24)
+0.29 LabMunkey (+0.25)
+0.28 ukpahonta (+0.35) (2011 winning entry)
If ukpahonta is right again for 2012 it will certainly put the polar bear amongst the penguins
2012 forecasts have not yet been found for:-
SmokingDeepThroat (+0.39)
Ken Sharples( +0.18)
nibor25( +0.15)
jkiller56
Complain about this comment (Comment number 5)
Comment number 6.
At 20:04 16th Apr 2012, QuaesoVeritas wrote:Since the UAH anomaly figure for March was published, the anomalies for other data series have also been published. These are as follows (with February figures in brackets):
RSS = +0.075 (-0.121c)
NOAA = +0.456c (+0.360c)
GISS = +0.46c (+0.40c)
After adjustment to 1961-90, these are equivalent to +0.222c, +0.318c and +0.350c.
The HadSST2 anomaly has also been published, and the global mean was +0.242c, compared to a February figure of +0.23c and a March 2011 figure of +0.252c. Based on the past 10 years, the March figure is equivalent to a HadCRUT3 figure of about +0.395c, although the fact that this March was lower than in 2011, would suggest a HadCRUT3 of below +0.322c.
Finally, the estimated March HadCRUT3 figure based on AQUA ch5, was +0.41c.
So quite a range of figures for HadCRUT3, based on the data published so far.
Personally I think that the estimate based on last year's SST is likely to be too low, as land temperatures are probably going to be higher this March than last.
On the other hand, I don't think that HadCRUT3 will rise as quickly as the satellite anomalies, as they are usually more volatile.
Overall, I think that the rise in HadCRUT3 will be similar to that in NCDC, producing a HadCRUT3 figure of around +0.3c for March.
Complain about this comment (Comment number 6)
Comment number 7.
At 20:21 16th Apr 2012, QuaesoVeritas wrote:I've just realised that I have contradicted myself in the above, by coming up with a figure below that of March 2011. Confusing myself with too many numbers.
On reflection, a figure of about 0.34c seems more likely.
Complain about this comment (Comment number 7)
Comment number 8.
At 21:37 16th Apr 2012, newdwr54 wrote:This is a useful site for weekly estimations of ENSO 3.4 temperature. ENSO 3.4 is the region of the tropical Pacific used to gauge the ENSO index: https://www.bom.gov.au/climate/enso/indices.shtml (make sure you select region 3.4 from the drop-down list; it doesn't default to there.)
The cooling/warming cycle here is a natural oscillation; i.e. ENSO does not introduce new heat to the climate system. Nevertheless, if AGW theory is correct, then warm episodes should on average become more warm, while cooling episodes should be less cold. This is because now there is presumed to be more heat energy 'in the system' resulting from the external forcing of greenhouse gases.
This week's results will be out tomorrow (usually). Those of you who, like me, are sad enough, can download the digitised data from that site and create your own graphs.
At the minute we are in what they call 'ENSO neutral' conditions (0.0 +/- 0.5C). Since the index went into 'neutral' in early March global surface temperatures have risen. This is especially obvious in the satellite data, which, as QV notes above, seems to react more quickly than surface data to ENSO fluctuations.
Based on the ENSO index, I predict that April will show another significant rise in the UAH and RSS data (but then I'm a 'warmist').
Complain about this comment (Comment number 8)
Comment number 9.
At 09:23 17th Apr 2012, Tim wrote:We are well under the average temperatures for this month and it hasn't stopped raining now its started. I suspect the UAH figure may drop again, it rose so quickly for the reason that we had very high temperatures in March.
Complain about this comment (Comment number 9)
Comment number 10.
At 09:35 17th Apr 2012, QuaesoVeritas wrote:After rising during late March/Early April, the Aqua ch5 temp. fell between April 6 and 12 but has now started to rise again.
I estimate that it is now equivalent to a UAH anomaly of about +0.25c, and RSS of about +0.3c and a HadCrut3 of about 0.45c.
Temperatures seem to be rising at about the average rate for the time of year, and if the current pattern continues, I don't expect the anomaly figures to change much by the end of the month.
Complain about this comment (Comment number 10)
Comment number 11.
At 09:41 17th Apr 2012, QuaesoVeritas wrote:Tim,
Since you mention rainfall, I assume you are referring to the U.K. but if so, I don't think we can draw too many conclusions regarding global temperatures.
Despite the recent showery conditions, more drought areas have been announced.
I heard someone from Lancaster U. on yesterday's "World At One", claim that the drought was "most likely" due to changing rainfall patterns, due to "climate change", which of course is nonsense, particularly since the drought is being blamed on two successive winters with low rainfall, and the predictions were for higher winter precipitation as a result of "climate change".
Complain about this comment (Comment number 11)
Comment number 12.
At 11:05 17th Apr 2012, Tim wrote:QuaesoVeritas :-) I have just seen an article on rising snow levels in the Himalayas mountains. https://www.dailymail.co.uk/sciencetech/article-2130184/Forget-global-warming-Scientists-discover-glaciers-Asia-getting-BIGGER.html. The ice levels are rising 0.1 metres a year and they are trying to blame that on global warming.
Complain about this comment (Comment number 12)
Comment number 13.
At 14:17 17th Apr 2012, newdwr54 wrote:Some may be interested to note that HadCRUT4 data is now available here: https://www.metoffice.gov.uk/hadobs/hadcrut4/data/download.html
I think you need to select the box 'HadCRUT4 time series: ensemble medians and uncertainties' and from that 'Global (NH+SH)/2'. In the 'monthly' data, column 2 is the median of the 100 ensemble member time series, which is the one that I think is directly comparable to the HadCRUT3 monthly data.
The data has only been updated to December 2010. Comparing with the HC3 equivalents, HC4 is slightly warmer over the 10 years to Dec '12, being on average +0.48 C above the 1961-1990 reference period compared to +0.44 C on average in HC3.
Comparison of the 10 year trends to Dec '12 gives +0.02 C/decade (HC4) vrs -0.03 C/decade (HC3). The much discussed 1998-2010 trend in HC4 is +0.08 C/decade vrs +0.02 C/decade in HC3.
Complain about this comment (Comment number 13)
Comment number 14.
At 14:44 17th Apr 2012, newdwr54 wrote:12. Tim:
As the article itself says, most glaciers in the region are in retreat. A few glaciers around the world are growing, since they expand from the top due to snowfall accumulation. As the article also points out, increased winter precipitation (snowfall) is probably connected with increased atmospheric humidity due to warming.
If the annual rate of snow accumulation is greater than the annual amount of melt from the bottom and around the edges, then a glacier will grow in any given year. This is not unexpected and there are several other notable growing glaciers around the world, including in New Zealand and Norway for instance.
However, by far most glaciers and ice sheets are melting much faster than they are gaining snow and as a result they are shrinking.
A 2011 paper studying data from the GRACE satellites found that the Greenland and Antarctic ice sheets suffered a net loss of around 400 billion tonnes of ice per year between 2003 and 2008, and that the rest of the world's glaciers saw a net loss of around 148 billion tonnes of ice per year in the same period: https://www.nature.com/nature/journal/vaop/ncurrent/full/nature10847.html
That's a net loss of over 4 trillion tonnes of ice in eight years. It seems unlikely that any growth over the past 3-4 years in this particular glacier will offset that by much.
Complain about this comment (Comment number 14)
Comment number 15.
At 16:30 17th Apr 2012, QuaesoVeritas wrote:#13. - newdwr54 wrote:
"Comparison of the 10 year trends to Dec '12 gives +0.02 C/decade (HC4) vrs -0.03 C/decade (HC3). The much discussed 1998-2010 trend in HC4 is +0.08 C/decade vrs +0.02 C/decade in HC3."
It will be interesting to see the 2011 figures and I am not really bothering with HC4 until it is brought up to date.
David Whitehouse of the GWPF recently did calculations with estimated figures for 2011, which showed no warming for 15 years but I prefer to wait for the actual figures.
https://thegwpf.org/the-observatory/5360-no-global-warming-for-15-years.html
Complain about this comment (Comment number 15)
Comment number 16.
At 16:42 17th Apr 2012, QuaesoVeritas wrote:#14. - newdwr54 wrote:
"However, by far most glaciers and ice sheets are melting much faster than they are gaining snow and as a result they are shrinking. "
About 20000 years ago, Britain was covered in an ice sheet several miles thick.
Was it a good thing or a bad thing that melted?
As we are at the end of an ice-age, would we not expect the rate of melting to accelerate?
Complain about this comment (Comment number 16)
Comment number 17.
At 17:02 17th Apr 2012, Tim wrote:newdwr54 . It depends who reads the articles and puts their own spin on things. I don't read the article anything like you, but then I believe that "man made global warming is a scam". I don't believe the current measurement of the earth's temperature is that accurate and much of science is subjective, know matter how much people reckon they are objective.
Complain about this comment (Comment number 17)
Comment number 18.
At 17:12 17th Apr 2012, newdwr54 wrote:16. QuaesoVeritas:
"About 20000 years ago, Britain was covered in an ice sheet several miles thick.
Was it a good thing or a bad thing that melted?"
I'd say it was a very good thing as far as human civilisation is concerned. However I'm not so sure about the benefits of further serious melting, since we seem to have reached a fairly stable pattern re climate/civilisation over the past 6,000 years or so. It's the 'don't fix what's not broken' principle for me.
"As we are at the end of an ice-age, would we not expect the rate of melting to accelerate?"
It's a fair point. I think we should expect the rate of thaw in an Ice Age to gradually accelerate due to the accumulating effect of the various feedbacks (ice melt, snow cover reduction, greenhouse gas escape, etc). But even if that's true, we still need an explanation for the various 'fits and starts' observed in the temperature record, such as the MWP, the LIA and the recent warming.
Complain about this comment (Comment number 18)
Comment number 19.
At 17:17 17th Apr 2012, newdwr54 wrote:17. Tim:
We'll agree to disagree then.
Complain about this comment (Comment number 19)
Comment number 20.
At 17:46 17th Apr 2012, QuaesoVeritas wrote:#18. - newdwr54 wrote:
"I'd say it was a very good thing as far as human civilisation is concerned. However I'm not so sure about the benefits of further serious melting, since we seem to have reached a fairly stable pattern re climate/civilisation over the past 6,000 years or so. It's the 'don't fix what's not broken' principle for me."
I am not entirely sure if I agree with that. I think the apparent stability of climate and/or civilisation in the past is due to the lack of data. We have never monitored the climate (or civilisation) in as much detail as now, and that gives the impression that things are changing more. I think that there were as many floods, famines and other natural disasters in the past as there were now, but of course they affected less people, but in the past they were blamed on the gods, rather than "climate change".
Complain about this comment (Comment number 20)
Comment number 21.
At 19:05 17th Apr 2012, mjmwhite wrote:"The coldest or near coldest May for 100 years in Central and East parts with a record run of bitter Northerly winds. Snow at times especially on high ground in NE / East. Spring put in reverse"
https://www.weatheraction.com/displayarticle.asp?a=450&c=5
"Piers Corbyn astrophysicist of Weatheraction.com says "We are making this headline from our 45day ahead Britain & Ireland forecast public because of its importance. It is an economically impactful forecast and more detail of the timing of cold and wintry blasts, East-West splits and drought or not implications are available to subscribers and will also be reviewed for the 30day ahead forecast due at end of April."
"The very cold expectations apply to East parts and near – Europe rather than Ireland and West Britain”
Complain about this comment (Comment number 21)
Comment number 22.
At 20:10 17th Apr 2012, QuaesoVeritas wrote:#21. - mjmwhite wrote:
"The coldest or near coldest May for 100 years in Central and East parts with a record run of bitter Northerly winds. Snow at times especially on high ground in NE / East. Spring put in reverse"
Interesting. I live in the NE of England, so I look forward to this with eager anticipation.
Unfortunately I put about as much faith in his predictions as in Astrology.
I take predictions of "major extreme events" with a pinch of salt, as the net is spread so wide and there are bound to be extreme events somewhere, especially in tornado season.
Complain about this comment (Comment number 22)
Comment number 23.
At 01:15 18th Apr 2012, Lazarus wrote:Tim wrote:
"I don't believe the current measurement of the earth's temperature is that accurate and much of science is subjective"
But you do believe that a satellite can measure ice levels rising 0.1 metres a year.
If you do accept this satellite information then you should also accept it when they show these glaciers are bucking the trend and are not representative of glaciers as a whole and that Global Glaciers, and Ice Caps are Shedding Billions of Tons of Mass Annually.
https://www.sciencedaily.com/releases/2012/02/120208132301.htm
BTW, probably not a good idea to use the Daily Fail as a credible reference.
https://climatecrocks.com/2012/03/28/the-daily-mail-major-fail-scientist-sets-record-straight-on-medieval-warming-research/
Complain about this comment (Comment number 23)
Comment number 24.
At 08:20 18th Apr 2012, LabMunkey wrote:@ Laz#23
from your first link
" Earth's glaciers and ice caps outside of the regions of Greenland and Antarctica are shedding roughly 150 billion tons of ice annually, according to a new study led by the University of Colorado Boulder."
key part:"outside of the regions of Greenland and Antarctica "
So the more pertinent question is: overall is the net effect positive or negative?
Complain about this comment (Comment number 24)
Comment number 25.
At 08:39 18th Apr 2012, Tim wrote:Lazarus. Satellites may be good at showing the coverage of ice on the world, but they don't measure the thickness. I don't believe they give a truly accurate temperature of the earth. When it comes to measuring the temperature on the ground, the stations would have to be very mile on the ground and mile upwards in the air to give a true reflection, in a grid which they aren't. It has been shown that many base stations don't even give a true reflection, because of population density around them. Everybody is clutching at straws. Rather than being concerned about the temperature of the earth, it would be better to focus on creating and using sustainable fuel sources. I can't wait for more electric cars, but that does bring its own hazard, as you can't hear them coming.
Complain about this comment (Comment number 25)
Comment number 26.
At 10:38 18th Apr 2012, quake wrote:21: "The coldest or near coldest May for 100 years in Central and East parts with a record run of bitter Northerly winds. Snow at times especially on high ground in NE / East. Spring put in reverse"
Interesting. Apart from the snow part, that is quite a specific forecast for temperature. If he gets that right I'll have to give him more credit. The Met Office forecast for 2 May 2012 to 16 May 2012 is very different: "Temperatures will generally be close to or slightly above the seasonal average."
Looking at the E and NE of England the most recent coldest Mays are 1996 (4th coldest on record), 1994 (22nd coldest), 2010 (40th coldest).
https://www.metoffice.gov.uk/climate/uk/datasets/Tmean/ranked/England_E_and_NE.txt
Complain about this comment (Comment number 26)
Comment number 27.
At 10:56 18th Apr 2012, Lazarus wrote:LabMunkey wrote:
"So the more pertinent question is: overall is the net effect positive or negative?"
The article does not suggest that the areas of the regions of Greenland and Antarctica are gaining ice overall. It clearly states;
"The measurements are important because the melting of the world's glaciers and ice caps, along with Greenland and Antarctica, pose the greatest threat to sea level increases in the future"
"According to the GRACE data, total sea level rise from all land-based ice on Earth including Greenland and Antarctica was roughly 1.5 millimeters per year annually or about 12 millimeters, or one-half inch, from 2003 to 2010"
So to answer your question, the overall effect is very much negative.
Complain about this comment (Comment number 27)
Comment number 28.
At 11:04 18th Apr 2012, Lazarus wrote:Tim wrote:
"Satellites may be good at showing the coverage of ice on the world, but they don't measure the thickness."
Then why have you said that ice levels are rising 0.1 metres a year for these particular glaciers?
By the way, GRACE does calculate thickness, and other Satellites do measure temperature, free from "population density" and it correlates well with ground measurements.
But even if you still hold to your beliefs and still claim that the measurements for whatever can't be accurate then you must also accept the very real possibility that they are actually understating both ice loss and temperature rise. Otherwise you look like you are just assuming errors in the direction that confirms your particular belief bias.
Complain about this comment (Comment number 28)
Comment number 29.
At 11:44 18th Apr 2012, Tim wrote:Lazarus. The fact is the article and study said the ice levels are rising, I just thought it ironic that they tried to blame that on man made global warming. You and me certainly must live on a different planet to the one we are talking about.
Complain about this comment (Comment number 29)
Comment number 30.
At 13:42 18th Apr 2012, ukpahonta wrote:Tim,
It's all a matter of interpretation:
https://www.theregister.co.uk/2012/02/09/grace_data_himalayas_not_melting/
"The new results were derived by scientists including Professor John Wahr of Colorado uni. According to the new boffinry, glaciers and ice caps in places other than Antarctica and Greenland lost only 148 billion tons of ice each year from 2003 to 2010. This is some 30 per cent lower than had been previously estimated."
is a little less dramatic than:
https://www.sciencedaily.com/releases/2012/02/120208132301.htm
"The Earth is losing an incredible amount of ice to the oceans annually, and these new results will help us answer important questions in terms of both sea rise and how the planet's cold regions are responding to global change."
The data is the same, just the spin differs, but sshh don't let on as there are some that still don't appreciate varying view points from the party line.
Complain about this comment (Comment number 30)
Comment number 31.
At 16:25 18th Apr 2012, Tim wrote:I totally agree with you ukpahonta. I can't wait for all these electric cars, that will reduce the cost of travel and create an healthier environment. But let us change what we can, not worry about things that we have no control over.
Complain about this comment (Comment number 31)
Comment number 32.
At 17:21 18th Apr 2012, QuaesoVeritas wrote:#26. - quake wrote:
"Looking at the E and NE of England the most recent coldest Mays are 1996 (4th coldest on record), 1994 (22nd coldest), 2010 (40th coldest)."
Yes, assuming we use the above dataset, for it to be the coldest May for 100 years, it would have to be colder than the 7.9c recorded in 1923. However, it is debatable what "near coldest" would mean, but I suppose that anything lower than 8.6c could meet that description. Given that as recently as 1996, there has been a figure of 8.1c, that isn't such an unlikely prospect as it might appear at first glance.
In fact, the M.O. forecast of "close to the seasonal average" for the first half of May, isn't quite what it seems, since the 1961-90 mean for May is only about 9.8c, and that figure would produce one of the coldest Mays of the last 15 years. Also, if we take the word "seasonal" literally, i.e. meaning March to May, that would be equivalent to a figure of only about 7c.
Even the April/May 1961-90 average is only 8.1c, so using that interpretation, a figure of 8.6c would meet both the Weatheraction and M.O. forecasts.
Piers Corbyn's forecast can be criticised for being vague, but even the M.O. aren't very specific. I would have hoped for actual temperature figures from them.
Complain about this comment (Comment number 32)
Comment number 33.
At 20:13 18th Apr 2012, jkiller56 wrote:To QV#16/Newdwr54#18
Re. ice age. Yes I suppose it was a good think for humanity that the last glaciation retreated (but who knows?). However there must have been a few nasty shocks on the way. Imagine living in the North Sea basin when the waters broke through - being stranded on the last days of Dogger Bank must have been a nightmare.
Isn't it the case that many of the religious "flood myths" are supposed to derive from folk memories of sudden glacial melt and innundation? Atlantis too perhaps.
Then there's the collapse of the ice age ecology - vast herds of game, like mammoths and reindeer disappearing. All this must have called for quick adaptation A good thing? Perhaps, but not easy and catastrophic for some I would guess.
Anyway - aren't we getting towards the end of the interglacial now? Things should be getting colder (they have already passedtheir peak of about 6000 yrs ago). Whatever the feedbacks the sun has long since passed its strongest point when the tropics were about 24 degrees N/S as opposed to just over 23 now.
Complain about this comment (Comment number 33)
Comment number 34.
At 22:05 18th Apr 2012, newdwr54 wrote:24. LabMunkey wrote:
"key part:"outside of the regions of Greenland and Antarctica "
So the more pertinent question is: overall is the net effect positive or negative?"
___________________________
Re my previous @ 14:
"A 2011 paper studying data from the GRACE satellites found that the Greenland and Antarctic ice sheets suffered a net loss of around 400 billion tonnes of ice per year between 2003 and 2008..."
The evidence from the GRACE satellites is unequivocal. The melt from the Greenland and Antarctic ice sheets is by far the biggest contributor to the overall global ice melt observed between 2003-2008.
Complain about this comment (Comment number 34)
Comment number 35.
At 22:13 18th Apr 2012, newdwr54 wrote:33. jkiller56:
I meant to say that the warming has been good for human *civilisation*. Whether that means 'good' in a general sense; or even 'good' for human beings, is up for debate (but not on a weather/climate blog perhaps?).
I agree that if we consider only natural forcings then earth's surface temperature should have been getting colder, not warmer, over the past century. But it's been getting warmer.
Complain about this comment (Comment number 35)
Comment number 36.
At 01:59 19th Apr 2012, Lazarus wrote:Tim wrote:
"The fact is the article and study said the ice levels are rising,"
Ice levels are not rising. Some glaciers in part of the Himalayas are bucking the ice loss trend with a slight increase. Parts of the Antarctic are also increasing in ice.
This sort of effect has been predicted for decades as a consequence of the onset of global warming;
“Melting of the world’s ice sheets is another possible effect of CO2 warming.
If they melted entirely, sea level would rise ~ 70 m. However, their natural response time is thousands of years, and it is not certain whether CO2 warming will cause the ice sheets to shrink or grow.
For example, if the ocean warms but the air above the ice sheets remains below freezing, the effect could be increased snowfall, net ice sheet growth, and thus lowering of sea level.”
‘Climate Impact of Increasing Atmospheric Carbon Dioxide’, J. Hansen et al, Published in 'Science' over three decades ago.
Complain about this comment (Comment number 36)
Comment number 37.
At 07:51 19th Apr 2012, lateintheday wrote:Tim, it's simple really. If the ice sheets shrink, it's a clear sign of AGW. If the ice sheets grow, it's a clear sign of AGW. The same applies to rainfall, storms, polar bears, penguins or the number of apples on a tree. If it's above or below average - it's a clear sign of AGW.
Complain about this comment (Comment number 37)
Comment number 38.
At 08:03 19th Apr 2012, LabMunkey wrote:@ laz#
Ta- it just seemd very odd wording; i'm used to people trying to 'double imply' with language- hence the query.
@newd #34
curious, i was of the direct impression that the net balance of greenland was positive? Perhaps i'm remembering incorectly.
on a related note:
https://wattsupwiththat.com/2012/04/18/ice-capades-some-himalayan-glaciers-growing-study-suggests-a-negative-sea-level-rise-adjustment/
Complain about this comment (Comment number 38)
Comment number 39.
At 09:00 19th Apr 2012, Tim wrote:Who in their right mind, can still believe that man is causing global warming and not nature. The last decent summer was 6/7 years ago and that finished abruptly. There is too much evidence now coming out to proof it is Fear. False evidence appearing real.
Complain about this comment (Comment number 39)
Comment number 40.
At 11:11 19th Apr 2012, Lazarus wrote:Tim wrote:
"Who in their right mind, can still believe that man is causing global warming and not nature."
Almost all those researching it and the majority of the population. Minorities are not always wrong but more than likely will be.
Complain about this comment (Comment number 40)
Comment number 41.
At 11:46 19th Apr 2012, Tim wrote:Lazarus. The majority of the population came to their senses a long time ago and realised it was a hoax by people looking to make a name for themselves or for government to find an excuse to tax us even more heavily.
Complain about this comment (Comment number 41)
Comment number 42.
At 15:19 19th Apr 2012, Lazarus wrote:The majority do accept the science. I have no idea why you think otherwise.
Complain about this comment (Comment number 42)
Comment number 43.
At 16:30 19th Apr 2012, oldgifford wrote:42.
At 15:19 19th Apr 2012, Lazarus wrote:
The majority do accept the science. I have no idea why you think otherwise.
-------------------------
Everyone said this couldn’t be the case but these two held out against the world.
Note "willingness to challenge prevailing dogmas."
Two Australian scientists have been awarded the Nobel prize for medicine for their discovery that stomach ulcers can be caused by a bacterial infection.
In 1982, when H. pylori was discovered by Dr Marshall and Dr Warren, stress and lifestyle were considered the major causes of stomach and intestinal ulcers.
Dr Marshall and Dr Warren showed patients could only be properly cured when H. pylori was eradicated from the stomach.
Dr Marshall proved that H. pylori caused gastic inflammation by deliberately infecting himself with the bacterium.
The Nobel citation praises the doctors for their tenacity, and willingness to challenge prevailing dogmas.
Complain about this comment (Comment number 43)
Comment number 44.
At 17:24 19th Apr 2012, Tim wrote:Old gifford. I like you metaphor. But I would challenge that and say that stress causes the bacteria to form in the stomach, the mind is a powerful tool and can work for and against you. By using latent healing in the body through positive suggestion and relaxation, the bacteria would probably disappear naturally. For years I said I could help my dad stop his migraines, eventually he let me help him, he had always believed the body created them, but found out it was all in the mind.
Complain about this comment (Comment number 44)
Comment number 45.
At 20:03 19th Apr 2012, QuaesoVeritas wrote:greensand,
I am not sure if you are around at the moment, but if you are, do you know of a link to Reynolds SST v2 monthly data, ideally in text format?
I believe that NASA/GISS uses that data for part of the land/sea anomaly calculation, and I would like to have a look at the actual figures.
For some reason they don't link to the data on the NASA/GISS page I use.
Complain about this comment (Comment number 45)
Comment number 46.
At 21:22 19th Apr 2012, greensand wrote:@45 QuaesoVeritas wrote:
“....link to Reynolds SST v2 monthly data, ideally in text format?”
Hopefully yes, try the following:-
https://nomad1.ncep.noaa.gov/cgi-bin/pdisp_sst.sh
Instructions at top of page
1. Select a control file (dataset) – for Monthly check “monoiv2.ctl Monthly OIv2 SST"
2. Select options – check “include variable definitions and units”. Also check “Plot on separate window”
3. Select plot type – check “time series”
4. Click on "Next Page"
Instructions at top of page
1. Select a variable (previous page has definition option) – choose data or anomaly etc under “Field”
2. Select level, time and other options, lat’ long’ etc
3. Click on "Plot"
When plot opens in separate window at the bottom left of the page there should be a link to the data in text format.
Good luck, once in I am sure you will soon know how to drive it.
I use it to check the weekly numbers, presently showing around the same as this time last year.
Complain about this comment (Comment number 46)
Comment number 47.
At 22:42 19th Apr 2012, newdwr54 wrote:38. LabMunkey wrote:
"curious, i was of the direct impression that the net balance of greenland was positive? Perhaps i'm remembering incorectly."
Maybe you have remembered correctly LabMunkey; perhaps the source of your information was just wrong?
Greenland is losing ice mass at an accelerating rate.
Complain about this comment (Comment number 47)
Comment number 48.
At 22:48 19th Apr 2012, QuaesoVeritas wrote:greensand,
Thanks for the help.
I thought I might be able to calculate the SST component of the GISS anomaly, using the land/ocean figure and the land only figure, but the result is nothing like what I have downloaded from your link.
It doesn't help that the downloaded anomalies are v 1971-2000 while GISS is relative to 1951-80, and the Reynolds data doesn't start until 1981.
Before that, GISS apparently uses HadISST1.
I will sleep on it and have another go tomorrow.
Complain about this comment (Comment number 48)
Comment number 49.
At 22:55 19th Apr 2012, newdwr54 wrote:43. oldgifford:
It doesn't follow that because in some rare instances accepted scientific or medical understanding gets turned on its head that 'all' accepted scientific or medical understanding has an equal likelihood of also being totally wrong.
If there is an alternative explanation for the observed heat accumulation over the past few decades then no doubt it will be uncovered in due course.
In the meantime, my view is that it would be unwise to dismiss the clearly expressed view of every national scientific academy, and of every reputable geophysical institute on earth, regarding the reality of the warming and its most likely cause.
At present they *all* accept that the earth is gaining heat, and that human combustion of fossil fuels, which short-circuits the natural carbon cycle, is the most obvious and well-evidenced cause.
Complain about this comment (Comment number 49)
Comment number 50.
At 01:13 20th Apr 2012, Lazarus wrote:oldgifford wrote:
"Two Australian scientists have been awarded the Nobel prize for medicine for their discovery that stomach ulcers can be caused by a bacterial infection."
Not the ulcers again!
https://reallysciency.blogspot.co.uk/2012/02/first-debate.html
We all know that minority opinions can turn out to be correct. They make headlines because they almost never do.
My point is simply that Tim has made a claim that is untrue. The majority of people do accept climate change science as valid. His other expressed views are also 'fringe' as there is no credible evidence that stress of the mind can create bacteria.
Complain about this comment (Comment number 50)
Comment number 51.
At 07:58 20th Apr 2012, Tim wrote:Lazarus the last survey I saw said that more people didn't believe in global warming by man, than believed in it. It is a bit like WMD's people fall for the fraud, until they realise that the establishment distorted things to get their own way. Robin Cook blew the lid on WMD's, whereas Nigel Lawson did it on man made global warming. Science isn't as objective as people would like to make it out to be, people let their subjective opinion get into it, because they are only human, the concerning thing is how they get to the top of the ladder. We have one survey saying aspirin is good for us, another saying it is dangerous. The same applies with potatoes.
Complain about this comment (Comment number 51)
Comment number 52.
At 08:49 20th Apr 2012, ukpahonta wrote:More newspapers preparing us for the coldest May in 100 years.
https://www.dailymail.co.uk/news/article-2131939/UK-weather-Coldest-May-100-years-forecast-sizzling-summer.html
https://www.telegraph.co.uk/topics/weather/9213226/Coldest-May-in-100-years-forecasters-predict.html
https://www.expressandstar.com/news/2012/04/19/warning-over-coldest-may-in-100-years/
Either Piers has upped his anti or the papers are proving how fickle they are on weather and climate. I would never of expected this much coverage over a cooling event two to three years ago, still as long as the alarmism can be maintained to entice people to read the articles then they will be quite happy.
Good job the blogs maintain a sensible attitude, hrrmmph!
Complain about this comment (Comment number 52)
Comment number 53.
At 12:43 20th Apr 2012, greensand wrote:QV are you keeping tabs on the MO's Decadal Forecast that started in Sept 2011? If so do you agree with the following or have I missed something (again)?
If I have interpreted the "ens_ave" data correctly the forecast for the first year Sept 11 to Aug 12 is +0.345C equivalent to HadCRUT3 (1961-90) of +0.465C.
For the half year Sept 11 to Feb 12 I have a simple average for HadCRUT3 of +0.272C
TIA.
Complain about this comment (Comment number 53)
Comment number 54.
At 14:02 20th Apr 2012, NeilHamp wrote:I am sure I have read comments from some on this board who regards Piers Corbyn's views to be very little better than Astrology. He does not normally put his forecasts out on general issue.
With his "cold May forcast" he seems to have "put his head on the chopping block". He must be very confident to have gone public!
Complain about this comment (Comment number 54)
Comment number 55.
At 15:53 20th Apr 2012, john_cogger wrote:@54 NeilHamp
He does every so often, I think it's when he thinks it's a dead cert. After the Scottish storms he came out saying more were due the next week and in England. It was breezy for a day with storm force winds in the North Sea. Guess if he said he was right or wrong?
Complain about this comment (Comment number 55)
Comment number 56.
At 20:45 20th Apr 2012, QuaesoVeritas wrote:#53.At 12:43 20th Apr 2012, greensand wrote:
"QV are you keeping tabs on the MO's Decadal Forecast that started in Sept 2011? If so do you agree with the following or have I missed something (again)?"
Sorry, I'm not monitoring that, but I agree with your figure of 0.272c.
I will try and have a look at the MO forecast and get back to you on that.
Regarding the Piers Corbyn prediction for May, I notice that for what it's worth, according to the Ryan Maue extended GFS projections, it looks like the U.K. is going to be at or below average for the rest of April, and the early part of May, although there is some red/orange on May 6th.
https://policlimate.com/weather/current/ext_raw_temp_c.html
Complain about this comment (Comment number 56)
Comment number 57.
At 21:41 20th Apr 2012, greensand wrote:@56 QuaesoVeritas wrote:
“I will try and have a look at the MO forecast and get back to you on that.”
No worries QV, the forecast has a long way to go, I just made a note to check it every 6 months.
Re the Ryan Maue extended GFS projections, I have been watching the global numbers for quite a few months. Difficult to relate to actual data but so far this year the predicted trends have transpired, the cool start to the year followed by the warming of late (UAH 5). The last few days appear to show anomalies stabilising at their present level with a possible slight cooling trend towards the end of the month and into May. All very subjective so nothing firm, far too early for any confidence level, just a general overview.
Complain about this comment (Comment number 57)
Comment number 58.
At 22:57 20th Apr 2012, mailmannz wrote:#4 - QV said
#2. - Spanglerboy wrote:
"So the 1961-1990 mean represents what is 'normal'. Amazing what you can learn on a blog."
That is the definition of "normal" climate used by the World Meteorological Organisation. See under "Global Climate Data Sets""
But QV...What if the temperature we are experiencing today is the actual "normal climate"?
Mailman
Complain about this comment (Comment number 58)
Comment number 59.
At 08:43 21st Apr 2012, QuaesoVeritas wrote:#58. - mailmannz wrote:
"But QV...What if the temperature we are experiencing today is the actual "normal climate"?"
Of course, I agree entirely.
All I was talking about was the official WMO definition of normality.
But, even with respect to that, I believe that the next "normal" period will be 1991 to 2020, but clearly even due to normal variability, the climate will be different by then.
Personally I believe that we should use the longest and oldest period of time for which we have reliable data as a definition of "normal", so based on that definition, the "normal" period would probably be something like 1881 to 1980, or since the later part of that is likely to have been most influenced by any "global warming" which might exist, possibly 1881 to 1930.
Of couse, the ideal period would be before the industrial revolution, but of course, we don't have data for that period.
In any case, I have even seen it suggested that the climate had been influenced by the development of agriculture in early civilisations, and since we are allegedly measuring man made "climate change", we would ideally go back to a time before human evolution, but maybe the dinosaurs influenced the climate!
In reality, there is probably no such thing as "normal".
Complain about this comment (Comment number 59)
Comment number 60.
At 09:34 21st Apr 2012, oldgifford wrote:To all reference my post, some years ago I decided I should educate myself about global warming and I read lots and lots of papers, both for and against. The claims for AGW just didn't seem to be reflected in the actual data and many claims seemed to be untrue, for instance the claim that we have never seen such a steep rise in temperatures before. When I looked at the UK CET data it was easy to cherry pick a 30 year period when the temperature rise was just as steep as that in the 70s. You can see the same effect by eyeballing the global temperatures. I still haven’t seen a decent explanation as to why the continual rise in CO2 doesn’t correlate with temperature over time, and the IPCC tropospheric hot spot doesn’t seem to be there, though I notice a recent paper that says it is there and it’s all the fault of the radiosonde balloons.
When I read about the IPCC using propaganda material and claiming it is science and the way it produces its reports, then I am very suspicious of anything it now claims. Donna Laframboise’s book ‘The IPCC Delinquent Teenager’ really make one think that all is not well in the politics that is now global warming, sorry climate change. It has become big business and as such there is an impetus to keep it going and there are plenty of bandwagons to jump on. There are many distinguished academics who are sceptical of the AGW theories and have published papers that suggest CO2 is not the be all and end all. The oft used phrase “the science is settled “ shows just how ignorant those are who utter it. Science is never settled, it a continuing quest to discover the hidden mysteries of nature. All scientists must be sceptics otherwise we would still believe the Earth was flat and the centre of the universe.
Off to cook breakfast now.
Complain about this comment (Comment number 60)
Comment number 61.
At 12:33 21st Apr 2012, jkiller56 wrote:Regarding the prediction of a cold May. There would certainly be nothing unusual about that - folk sayings are packed with references to it, from: "who doffs his coat on a winter day, will gladly put it on in May" - to: "shear your sheep in May and shear them all away".
Whether it will be as bad as Corbyn suggests is another matter. He has, as someone said - "put his head on the chopping block again" - despite having had it cut off many times in the past.
But, of course, he works on the principle that in the unlikely event of being proved right, he will make an enormous publicity stunt out of it. If wrong, as he well knows, people will soon forget - so why not have a go? The public attention itself is the prize.
As Oscar Wilde famously said - "The one thing worse than being talked about, is not being talked about".
We must bear in mind, too, that Mr. average keeps a far less sharp eye on weather events than the average blogger on this site, so is easily deceived. Yet even here on the PH site there are some who appear gullible enough to be taken in by Corbyn and his ilk (repeatedly).
Or more likely, they so desperately want to believe anyone who denies the AGW consensus, that they are prepared to take almost any such predictions and their advocates seriously.
Complain about this comment (Comment number 61)
Comment number 62.
At 14:29 21st Apr 2012, newdwr54 wrote:60. oldgifford:
When you say you took the time to 'educate yourself' about AGW do you mean that you enlisted in a course taught at a registered UK university? If so, could you confirm that the university questioned the validity of AGW theory? I don't know of any properly accredited UK university that officially rejects AGW, but I stand to be corrected as always.
Re the CET: this is a local indicator, and as such is subject to much more 'noise' than the global surface temperature. But consider that the last period during which the rate of temperature rise was similar to the present in the CET (1711-1725), temperatures were ~ 1C cooler than they are today.
We need an explanation for why the sudden rise in temperature in CET noted since the mid 1980s. The familiar answer "recovery from the little ice age" doesn't cut it. We need specifics.
There was a similar rate of rise between 1700-1740, but this is generally attributed to a combination in changes in orbital cycles/tilt, reduced volcanic and increased solar output, coming in the middle of what was up to then a particularly cold period, for the NH at least. We don't have any such solar, volcanic or orbital explanations for the warming trend observed in CET today.
You speak of "many distinguished academics who are sceptical of the AGW theories", but how many of these are specialised in climatology and atmospheric physics; and of those that are, how many are they as a proportion of those who support AGW theory? The numbers are vanishingly small.
The oft used phrase “the science is settled" is only often used by 'sceptics' in an attempt to build a straw man of the mainstream scientific position on AGW. Can you point to a single scientific paper that says AGW theory is above question?
Your comments on the IPCC's use of non-peer reviewed evidence are entirely appropriate. The IPCC has accepted the criticism of the Himalayas glacier debacle and issued a correction. As for the popular book in question: this does not contain any serious discussion of the science involved in AGW and is written by someone with no academic qualifications in atmospheric or earth sciences.
Complain about this comment (Comment number 62)
Comment number 63.
At 17:18 21st Apr 2012, ukpahonta wrote:'Officials of the National Astronomical Observatory of Japan and the Riken research foundation said on April 19 that the activity of sunspots appeared to resemble a 70-year period in the 17th century in which London’s Thames froze over and cherry blossoms bloomed later than usual in Kyoto.'
https://ajw.asahi.com/article/behind_news/social_affairs/AJ201204200075
Complain about this comment (Comment number 63)
Comment number 64.
At 17:24 21st Apr 2012, newdwr54 wrote:According to the Independent, Piers Morgan, when asked to reveal the methods behind his self-described "solar-magnetic-lunar system" for forecasting '45 day-ahead' weather, replied:
"Well why the **** should I? The methodology is owned by the company, right? Why the hell do you drink Coca-Cola when the recipe is secret?" https://www.independent.co.uk/news/uk/home-news/the-weatherman-caught-in-a-media-storm-7665925.html
Possibly because Coca-Cola is of a consistent quality might be one answer? So we're left with yet another apocalyptic cold (always cold with Piers) prediction for May 2012. The prediction is as follows:
"The coldest or near coldest May for 100 years in Central and East parts [of Britain] with a record run of bitter Northerly winds. Snow at times especially on high ground in NE / East. Spring put in reverse.
*Confidence of E / SE England mean temps: Coldest in 100yrs 80%; In 5 coldest in 100yrs 90%"
https://www.weatheraction.com/displayarticle.asp?a=450&c=5
Let's see if the "solar-magnetic-lunar system" method copes better with the spring weather than it did with last winter's, which Piers predicted would be "exceptionally cold across Britain" for several long periods in a video which now appears to have been made "private".
Complain about this comment (Comment number 64)
Comment number 65.
At 20:19 21st Apr 2012, greensand wrote:Eh up DW I think you may benefit from a review of your "Piers"
Complain about this comment (Comment number 65)
Comment number 66.
At 20:53 21st Apr 2012, QuaesoVeritas wrote:#63. - ukpahonta wrote:
"'Officials of the National Astronomical Observatory of Japan and the Riken research foundation said on April 19 that the activity of sunspots appeared to resemble a 70-year period in the 17th century in which London’s Thames froze over and cherry blossoms bloomed later than usual in Kyoto.'"
From what I understand, the sun was almost totally devoid of sunspots during the "Maunder Minimum" of 1645 to 1715, which was actually quite a different situation to the current one.
As far as I can tell, the number of sunspots is quite normal for this point in the cycle, although a bit low. Personally, I think the situation resembles the early 19th century, more than the 17th.
There are plenty of spots on the Sun at the moment, although admittedly, a few days ago there weren't many.
Complain about this comment (Comment number 66)
Comment number 67.
At 20:56 21st Apr 2012, quake wrote:The Met Office forecast for Sunday 6 May 2012 to Sunday 20 May 2012 now reads:
"the Temperatures will largely be close to or just below the seasonal average, and feeling cool in the wind and rain."
There is still ample difference between the Corbyn and Met Office forecast for May, but not as much as there was.
Complain about this comment (Comment number 67)
Comment number 68.
At 21:12 21st Apr 2012, lateintheday wrote:Holly Bush update - from the blog post titled "Met Office global forecasts too warm in 11 out of last 12 yrs" 10:13am on 14 Feb 2012
And a further Holly Bush update. Not only did the cold snap arrive on time - it left on time too!
"Gales continue to batter Britain 2:02pm on 09 Jan 2012
Holly bush update: still showing a few berries.
Interpretation: continued mild UK January temps with a risk of brief cold snap from 30th Jan - 15th Feb. Soaking wet end of Winter/Early spring thereafter.
The Holly Bush has spoken."
Maybe a week late but otherwise, looking pretty darned good! My kids have been off school for three weeks - it's rained just about every day.
Complain about this comment (Comment number 68)
Comment number 69.
At 23:44 21st Apr 2012, ukpahonta wrote:QV
But at what point of the cycle are we, they are not the first to suggest that we are already at max?
This will be extremely interesting:
'If that trend continues, the north pole could complete its flip in May 2012 but create a four-pole magnetic structure in the sun, with two new poles created in the vicinity of the equator of our closest star.'
If they are correct.
Complain about this comment (Comment number 69)
Comment number 70.
At 00:02 22nd Apr 2012, mailmannz wrote:"64. At 17:24 21st Apr 2012, newdwr54 wrote:
According to the Independent, Piers Morgan, when asked to reveal the methods behind his self-described "solar-magnetic-lunar system" for forecasting '45 day-ahead' weather, replied:
"Well why the **** should I? The methodology is owned by the company, right? Why the hell do you drink Coca-Cola when the recipe is secret?" https://www.independent.co.uk/news/uk/home-news/the-weatherman-caught-in-a-media-storm-7665925.html
Possibly because Coca-Cola is of a consistent quality might be one answer? So we're left with yet another apocalyptic cold (always cold with Piers) prediction for May 2012."
And like Coca-cola, Piers is in competition for business from other weather forecasters. They are both selling commercial products to customers, who wouldnt be buying their products if they werent both providing accurate and tasty products.
I also think its a bit rich expecting a commercial company to divulge its trade secrets when we have so called climate scientists who continue to refuse to release the data that they have based their studies on that supposedly prove mann made global warming (tm) is the worst thing since sliced bread.
At the end of the day, it is the customers who continue to buy Piers products who will determine whether the money they pay and the services he provides are good value (ie. worth the money they are paying). If he isnt providing a good service, he goes out of business...unlike climate scientists who just seem to continue to get more and more government money!
Mailman
Complain about this comment (Comment number 70)
Comment number 71.
At 08:23 22nd Apr 2012, ukpahonta wrote:March 22, 2012: A recent flurry of eruptions on the sun did more than spark pretty auroras around the poles. NASA-funded researchers say the solar storms of March 8th through 10th dumped enough energy in Earth’s upper atmosphere to power every residence in New York City for two years.
“This was the biggest dose of heat we’ve received from a solar storm since 2005,” says Martin Mlynczak of NASA Langley Research Center. “It was a big event, and shows how solar activity can directly affect our planet.”
https://science.nasa.gov/science-news/science-at-nasa/2012/22mar_saber/
Complain about this comment (Comment number 71)
Comment number 72.
At 08:39 22nd Apr 2012, Tim wrote:Ukaphonta. That will explain the warm March. But the deniers will miss the point.
Complain about this comment (Comment number 72)
Comment number 73.
At 09:19 22nd Apr 2012, ukpahonta wrote:Tim, the very word itself is inciting and confrontational, not the best way to progress. Better to provide access to knowledge and allow self education to prosper.
Those that find the solar connection interesting can progress with:
'Although irregular, magnetic disturbances exhibit some patterns in their frequency of occurence. The main pattern is the correlation with the 11-year solar cycle and Figure 12 shows the number of magnetic storms per year, from 1868 to present and the corresponding number of sunspots. Another important pattern is the 27-day recurrence of some storms related to the 27-day rotation of the Sun as seen from Earth.'
https://www.geomag.bgs.ac.uk/education/earthmag.html
An interesting take on figure 12 on a blog, that will accept comments:
'What I found surprising was this chart of the sunspot cycle vs geomagnetic storms. While the sunspots mostly cycle, with some ebb and flow, the magnetic storms ramp rather nicely just like CO2 does over the same period.'
https://chiefio.wordpress.com/2012/04/20/co2-causes-solar-storms/
Complain about this comment (Comment number 73)
Comment number 74.
At 11:56 22nd Apr 2012, greensand wrote:@ 73. ukpahonta
Thanks for the links, especially the BGS Geomagnetism page, lots of interesting info.
Also I had forgotten about Cheifio and he is always worth a visit!
Complain about this comment (Comment number 74)
Comment number 75.
At 11:58 22nd Apr 2012, Tim wrote:Ukpahonto. I am sorry, but I haven't time for people who still believe in "man made global warming". It's like believing in father Christmas.
Complain about this comment (Comment number 75)
Comment number 76.
At 14:09 22nd Apr 2012, ukpahonta wrote:Tim,
As you grow older, and more tolerant of others, when you have children and then grand children, you will realise how important Father Christmas is when the match is on the telly on a Sunday afternoon. ;-)
Complain about this comment (Comment number 76)
Comment number 77.
At 14:50 22nd Apr 2012, oldgifford wrote:62.
At 14:29 21st Apr 2012, newdwr54 wrote:
60. oldgifford:
When you say you took the time to 'educate yourself' about AGW do you mean that you enlisted in a course taught at a registered UK university? If so, could you confirm that the university questioned the validity of AGW theory? I don't know of any properly accredited UK university that officially rejects AGW, but I stand to be corrected as always.
Hmm, so the only way to educate oneself is to go to University? Ever heard of reading books and peer reviewed papers? I assumed my MSc had given me the skills to digest data and form conclusions and to engage in further studies.
When I was preparing my modest contribution to the debate I emailed a number of academics who had published peer reviewed papers concerning the magnetic poles, magnetic fields and climate, and cosmic rays. I was most surprised that nearly all of them replied with some very helpful advice. My computer folder containing all the stuff I read prior to publication contains 7,214 files and is over 500 Mbytes in addition to my relevant emails. I never did find a paper that confirmed the massive rise in temperatures was due to a rise in CO2, lots of theory but the correlations were not there. Nor did I find the predicted hot spot.
Yes the CET is only a local measure but I used that to show how the alarmists blame any weather incident on global warming, even if over the last 15 years we haven’t had much. To my knowledge overall, extreme weather events have declined over the last 10 years.
You write “We need an explanation for why the sudden rise in temperature in CET noted since the mid 1980s. The familiar answer "recovery from the little ice age" doesn't cut it. We need specifics.”
I’m not sure why you reject the recovery from the little ice age. Since the Younger Dryas period it is obvious that there was a lot of warming, and as we don’t know for certain what caused the cooling, nor the warm and cold periods since then, it’s reasonable to assume from the temperature reconstructions since the “hide the decline” hockey stick, that we are indeed currently in a warming period. However there are a number of scientists who are concerned about the sunspot activity and there are theories that we may be in for a cooling period. I saw one estimate that it might be as much as one degree C. Can you imagine the problems that is going to give us? Crop failure is a real possibility and I guess one degree of cooling will cause a lot more deaths than one degree of warming.
It seems obvious that some of our warming will be due to mankind, for instance the amount of heat generated in warming ourselves and running all our 4x4s. The question is how much is natural and how much is manmade?
I still haven’t found a paper that proves the majority of the warming is due to CO2 and gives specifics. I don’t mean models but a proven theory with correlated results. Can you direct me to one?
I notice you also have a go at Piers Morgan. I seem to remember he has a prediction success rate of around 80% and the fact that he makes his living from predictions suggests that his success rate is good enough for people to spend their money with him. Compare that to the Met office who can’t even predict a couple of hours ahead – at least around Bristol – and live off us taxpayers. Their forecasts have been abysmal, and I suspect that if they were a private company they would have gone bankrupt years ago. As for the met office criticising Piers for not revealing his method and thereby destroying his business, it shows how naïve and cosseted from the real world they are.
Complain about this comment (Comment number 77)
Comment number 78.
At 17:40 22nd Apr 2012, newdwr54 wrote:77. oldgifford wrote:
"Hmm, so the only way to educate oneself is to go to University?"
I didn't say that. Since you have an MSc you must attach some importance to it though? You say you "emailed a number of academics who had published peer reviewed papers concerning the magnetic poles, magnetic fields and climate, and cosmic rays", but did you email any of the many thousands who have published peer-reviewed papers specialised in mainstream climatology? If not, then one has to wonder why not?
"Yes the CET is only a local measure but I used that to show how the alarmists blame any weather incident on global warming..."
If we get a cold spell, you won't have to wait too long until 'alarmists' in the 'no warming' camp will use it to make a case for themselves; both here on blogs like this, and in the national press. So that accusation is a two-edged sword.
"To my knowledge overall, extreme weather events have declined over the last 10 years."
That is a view that is certainly open to question. It is challenged, for instance, by reports such as this issued by US NOAA: https://www.ncdc.noaa.gov/oa/reports/billionz.html
"I’m not sure why you reject the recovery from the little ice age."
The reason for this is that "recovery" is not a recognised forcing on climate. Something must 'cause' a change to occur in order to overcome the climate's natural inertia. This must either be one of the recognised forcings, such as earth's orbit/tilt, solar output, greenhouse gas concentration, etc; or else it must be some as yet un-described forcing.
To simply attribute changes in climate to 'recovery' suggests there is some idealised natural 'state' of climate from which there are only variations in either direction. To my knowledge this is not considered to be the case.
"I saw one estimate that it might be as much as one degree C. Can you imagine the problems that is going to give us?"
I have seen predictions made by solar theorists such as David Archibald, who suggest in all seriousness that the average surface temperature during solar cycle 24 (which began in January 2009) is going to be, on average, 2.2 C below that seen in solar cycle 23 (which ran from May 1996 - Dec 2008).
There has been a modest cooling in trend since Jan 2009, but this is almost certainly due to La Nina influence. In fact monthly average temperatures since Jan 2009 have been 0.12 C higher on average than they were during solar cycle 23, according to UAH satellite data. It is already clear that Archibald's is a hopeless overestimate, yet he still has his cheerleaders among the popular press, especially among those who really *want* him to be right.
"I still haven’t found a paper that proves the majority of the warming is due to CO2 and gives specifics."
And you never will. You can never prove a causal relationship in nature; only disprove it. The best we can do is consider where the preponderance of the evidence leads. The scientific consensus is overwhelmingly of the view that AGW theory is broadly correct, since it is the best fit for the evidence observed. It also requires the least investment of assumptions.
"I notice you also have a go at Piers Morgan. I seem to remember he has a prediction success rate of around 80% and the fact that he makes his living from predictions suggests that his success rate is good enough for people to spend their money with him."
Sylvia Browne has an equally good (self-proclaimed) success rate; and she also makes a very good living from people who listen most closely to what they want to hear: https://en.wikipedia.org/wiki/Sylvia_Browne
Complain about this comment (Comment number 78)
Comment number 79.
At 19:14 22nd Apr 2012, QuaesoVeritas wrote:#77. - oldgifford wrote:
"I notice you also have a go at Piers Morgan. I seem to remember he has a prediction success rate of around 80% and the fact that he makes his living from predictions suggests that his success rate is good enough for people to spend their money with him. "
I think newdwr54 meant Piers Corbyn, not Piers Morgan.
The latter is a journalist and a t.v. presenter, including a talent show judge.
He has been in the news recently in connection with telephone hacking, which may be why newdwr54 got him confused with Corbyn.
I don't know what his record is on weather predictions.
greensand made a humourus attempt to point this out, which seems to have been missed because it was too subtle, so I am being less so.
Complain about this comment (Comment number 79)
Comment number 80.
At 22:37 22nd Apr 2012, newdwr54 wrote:Thanks QV, with apologies (once again) to Piers Morgan. Yes, I meant Piers Corbyn - the astrologer.
Complain about this comment (Comment number 80)
Comment number 81.
At 08:28 23rd Apr 2012, jackcowper wrote:For those that are interested, Pier Corbyns technique has been proved in peer reviewed literature:
Early Weather Action (Solar Weather Technique) skill was independently verified in a peer-reviewed paper by Dr Dennis Wheeler, University of Sunderland, in the Journal of Atmospheric and Solar-Terrestrial Physics, Vol 63 (2001) p29-34.
Paul Hudson himself has confirmed some Piers Corbyn's predictions as well. What I think would be interesting would be to give Piers the same budget as the Met Office and then compare the two.
Complain about this comment (Comment number 81)
Comment number 82.
At 10:13 23rd Apr 2012, QuaesoVeritas wrote:#81. - jackcowper wrote:
"Early Weather Action (Solar Weather Technique) skill was independently verified in a peer-reviewed paper by Dr Dennis Wheeler, University of Sunderland, in the Journal of Atmospheric and Solar-Terrestrial Physics, Vol 63 (2001) p29-34. "
The article is entitled "A verification of UK gale forecasts by "solar weather technique": October 1995-September 1997", so strictly speaking it only covers gale predictions. Also, the abstract says "The results, whilst differing greatly between the seasons, reveal a degree of success which cannot readily be accounted for by chance".
It appears that the article evaluates the predictions, rather than the actual techniques used.
Without the detailed article I don't think it is possible to say that it verifies the technique, and the article costs $31.50 to buy individually from the journal website.
Complain about this comment (Comment number 82)
Comment number 83.
At 12:39 23rd Apr 2012, oldgifford wrote:78.
At 17:40 22nd Apr 2012, newdwr54 wrote:
77. oldgifford wrote:
"Hmm, so the only way to educate oneself is to go to University?"
I didn't say that. Since you have an MSc you must attach some importance to it though? You say you "emailed a number of academics who had published peer reviewed papers concerning the magnetic poles, magnetic fields and climate, and cosmic rays", but did you email any of the many thousands who have published peer-reviewed papers specialised in mainstream climatology? If not, then one has to wonder why not?
The reason I contacted those people was because I had established a correlation between the drift of the magnetic poles and global temperatures. I wanted to know if any of them could shed light on a possible cause. I considered cosmic rays and the solar wind the most likely because the drifting poles influence the position of the magnetosphere. There was also a suggestion from one paper that the pole position also influenced UV radiation. That led me to study the effects of UV radiation on vegetation that could affect the CO2 balance. Phytoplankton might have been effected and these little plants probably breathe more CO2 than all the other vegetation on land.
If you want to read the paper https://tinyurl.com/c9o7q9
You also write;
“I still haven’t found a paper that proves the majority of the warming is due to CO2 and gives specifics."
And you never will. You can never prove a causal relationship in nature; only disprove it. The best we can do is consider where the preponderance of the evidence leads.”
I disagree somewhat. If there is a theory that produces a corresponding correlation/result then most scientists would accept a proof, until some awkward scientists, perhaps sceptical [ dare I use that word ] overturns it with his theory that seems more plausible and gives the same correlation/result.
The problem I have with AGW/CO2 is that in all my studies I couldn’t see the correlations.
You are correct when you say “The reason for this is that "recovery" is not a recognised forcing on climate. Something must 'cause' a change to occur in order to overcome the climate's natural inertia. This must either be one of the recognised forcings, such as earth's orbit/tilt, solar output, greenhouse gas concentration, etc; or else it must be some as yet un-described forcing.”
From what I can see we haven’t got a good handle on such a complex system as the environment or the sun and we are learning more and more each day. As to the “majority of scientists” I see a lot jumping on the bandwagon which worries me, blaming every problem in the world on climate change, they refuse to call it global warming any more because as per climate gate the warming has stopped and it’s a travesty. I see the Royal Society has retreated from the science is settled argument. This is the learned society that erased Prof. Eric Laithwaite’s demonstration of gyroscopes from their history because they refused to believe their own eyes.
Apologies to Piers Corbyn.
Keep the debate going but please a debate, not a slanging match.
Complain about this comment (Comment number 83)
Comment number 84.
At 14:27 23rd Apr 2012, ukpahonta wrote:@74 Greensand
Always a pleasure.
Just caught a comment over at BH's from Richard :
Any important questions for me, please do add them to the "Questions for the UKMO discussion thread, which I will try to look at as soon as this particular deadline is past…!)
Complain about this comment (Comment number 84)
Comment number 85.
At 21:11 23rd Apr 2012, mailmannz wrote:Do you work in the climate science circus ukp?
Regards
Mailman
Complain about this comment (Comment number 85)
Comment number 86.
At 00:16 24th Apr 2012, newdwr54 wrote:81. jackcowper wrote:
"For those that are interested, Pier Corbyns technique has been proved in peer reviewed literature"
Then at least something is 'proved'.
We shall see what May brings.
Complain about this comment (Comment number 86)
Comment number 87.
At 00:43 24th Apr 2012, newdwr54 wrote:83. oldgifford wrote:
"... I had established a correlation between the drift of the magnetic poles and global temperatures. I wanted to know if any of them could shed light on a possible cause. I considered cosmic rays and the solar wind the most likely because the drifting poles influence the position of the magnetosphere."
It's the motivation that I wonder about, oldgifford.
Why are we staring into the abyss of space, trying to attribute earth's surface warming to something exotic, and poorly understood, when we already have to hand an explanation that's relatively straightforward?
We have been pumping literally billions of tonnes of a warming gas into the atmosphere every year for decades, and the surface is gaining heat. This was predicted decades ago. It has come to pass. No one should even be surprised.
"The problem I have with AGW/CO2 is that in all my studies I couldn’t see the correlations."
Then I think you are in a small minority of scientists; and you're view is certainly in the minority of scientists working in climatology, as far as I can see.
I certainly don't want to stifle debate; I enjoy it in fact, as anyone contributing to a blog such as this surely must. I agree that we should avoid 'slagging matches' at all cost.
We can all agree to disagree in a civilised manner. But disagreement is the spice of conversation and long may she flourish!
Complain about this comment (Comment number 87)