
2011 - 9th warmest globally on satellite record
The Global temperature in December, according to the UAH satellite measure, showed little change from the previous month with an anomaly of +0.127C above the running 30 year mean, shown on the graph below.
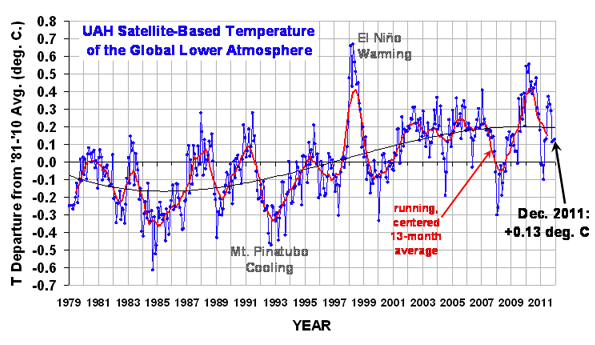
Adjusted to the more standard time period, the anomaly is approximately +0.380C above the 1961-1990 time period used by the Met Office and WMO.
For 2011 as a whole, the UAH global temperature was 0.149C above the 30 year running mean (or approximately 0.402C above the standard 1961-1990 mean).
This is considerably cooler than 2010's near record anomaly of 0.414C above the 30 year running mean - but it's still the 9th warmest on satellite record.
And that's despite the fact that global temperatures have been depressed by colder water in equatorial regions of the Pacific associated with la Nina, both during the early stages of the year, and again in the last few months.
Met Office figures released later this month are expected to show that 2011 was the 11th warmest globally in 150 years of temperature records.
 Hello, I’m Paul Hudson, weather presenter and climate correspondent for BBC Look North in Yorkshire and Lincolnshire. I've been interested in the weather and climate for as long as I can remember, and worked as a forecaster with the Met Office for more than ten years locally and at the international unit before joining the BBC in October 2007. Here I divide my time between forecasting and reporting on stories about climate change and its implications for people's everyday lives.
Page 1 of 2
Comment number 1.
At 17:02 9th Jan 2012, john_cogger wrote:So it looks Like 2011 will be about the 9th to 11th warmest (depending on which measure you use). Not bad for a year with the end of a strong La Nina at the start and a mild to neutral one at the end.
Have any La Nina's not gone -Ve in the UAH before?
Complain about this comment (Comment number 1)
Comment number 2.
At 20:15 9th Jan 2012, NeilHamp wrote:Paul has posted his normal monthly comment for January
The Met.Office have posted their 2011 gobal temperature provisional result
I have shown your 2011 forcasts in brackets
Quake is our 2011 winner
The Met.office forcast for 2012 is +0.48
I will start keeping records of your forcasts for 2012
I suspect the spread this might be considerably reduced
Met Office (+0.44) +0.48
SmokingDeepThroat (+0.39)
quake - 2011 winner(+0.36)
ukpahonta (+0.35)
QuaesoVeritas (+0.31) (original estimate)
Gadgetfriend (+0.30)
NeilHamp (+0.27) +0.42
LabMunkey (+0.25) (revised)
millinia (+0.24)
Joe Bastardi (+0.2)
Ken Sharples (+0.18)
nibor25 (+0.15)
Complain about this comment (Comment number 2)
Comment number 3.
At 20:46 9th Jan 2012, QuaesoVeritas wrote:#1. - john_cogger wrote:
"So it looks Like 2011 will be about the 9th to 11th warmest (depending on which measure you use). "
I make it 12th according to RSS, although that is my own calculation of the average of monthly figures.
I don't know if they issue an official annual figure.
Complain about this comment (Comment number 3)
Comment number 4.
At 20:54 9th Jan 2012, QuaesoVeritas wrote:#2. - NeilHamp wrote:
"Paul has posted his normal monthly comment for January
The Met.Office have posted their 2011 gobal temperature provisional result"
The MO provisional figure of 0.36c, was based on the November anomaly, although the actual MO data file shows 0.353c and I still think that the final figure could be lower than 0.36c.
Complain about this comment (Comment number 4)
Comment number 5.
At 20:57 9th Jan 2012, QuaesoVeritas wrote:I forgot, has anyone seen a 2012 prediction from Joe Bastardi yet?
I have been searching, but haven't been able to find anything.
Complain about this comment (Comment number 5)
Comment number 6.
At 23:08 9th Jan 2012, NeilHamp wrote:Thanks for the correction QV
We should regard quake as a "provisional" winner
ukpahonta still has a chance
Complain about this comment (Comment number 6)
Comment number 7.
At 07:59 10th Jan 2012, ukpahonta wrote:Being within 0.05 is really close enough for me whoever takes the prize. Put me down for 0.28 for 2012 I've a nagging suspicion that we won't see any highs for the first third of the year.
Complain about this comment (Comment number 7)
Comment number 8.
At 08:49 10th Jan 2012, lateintheday wrote:well done to all of those who got within a tenth!
Unfortunately, my Holly Bush doesn't do global forecasts so I shall not participate in the competition. I do find it interesting that ukpahonta is looking at a lower number this year and if memory serves, QV was hinting at a lower end prediction also.
Clearly, the la nina at the start of the year suppressed temps for a short while but again, from memory, this effect lessened rapidly in spring. Temp anomalies rose very quickly thereafter and there seemed to be be very little lag effect from the la nina.
This year should see the approach of the solar max (estimated 2012/2013) so it will be very interesting to see if either the atmospheric temps or the OHC show any response.
The ENSO ensemble forecasts have now been gradually rising for a few months in a row and it's starting to look like this second la nina may be a prolonged, but very shallow affair in which case I doubt if either side will have anything much to shout about come December.
Complain about this comment (Comment number 8)
Comment number 9.
At 10:23 10th Jan 2012, QuaesoVeritas wrote:#6. - NeilHamp wrote:
"Thanks for the correction QV"
Sorry, I didn't intend it as a correction, just a "gut" feeling,
but I am probably wrong.
Complain about this comment (Comment number 9)
Comment number 10.
At 10:35 10th Jan 2012, QuaesoVeritas wrote:#8. - lateintheday wrote:
"Clearly, the la nina at the start of the year suppressed temps for a short while but again, from memory, this effect lessened rapidly in spring. Temp anomalies rose very quickly thereafter and there seemed to be be very little lag effect from the la nina."
Actually, after a steady fall in 2010, 2011 started low, with a mean of all the series of 0.257c (adj. to 1961-90), in January, then increased during Spring and early Summer, reaching a peak in July of 0.509c, then fell again, to 0.309c by November.
I'm waiting to see the December figures before making my guess for 2012, if that's not cheating!
Complain about this comment (Comment number 10)
Comment number 11.
At 10:42 10th Jan 2012, QuaesoVeritas wrote:Sorry, the figure for November should have been 0.312c.
I also should clarify that those are monthly figures, not cumulative.
Complain about this comment (Comment number 11)
Comment number 12.
At 12:35 10th Jan 2012, Sheffield_city wrote:It is funny how the snow in the Alps came late, but once it did, there were record falls. Some people live in a clinical world, when they are trying to control the weather, it isn't predictable and has always been unpredictable. Haven't the Tornadoes in North America dropped these last few years.
Complain about this comment (Comment number 12)
Comment number 13.
At 12:37 10th Jan 2012, lateintheday wrote:QV - that's more or less what I thought, perhaps I expressed it poorly. I remember expecting the la nina to have a longer 'lag' effect than actually occurred. It's often noted that ENSO events can take a few months to show up in (or disappear from) the atmospheric temps. I think Newdwr54 also commented upon how quickly the anomalies bounced back up in late spring - almost contemporaneously with the fading la nina despite the fact that the index stayed slightly negative throughout the period. I thought it unusual at the time, and perhaps indicative that an ENSO neutral year may have led to a relatively high anomaly. Of course, I'm something of a bystander when it comes to the numbers and so rely more on memory of events rather than hard stats. As many here have pointed out in the past, ones memory can't always be trusted since it is largely a subjective construct.
Complain about this comment (Comment number 13)
Comment number 14.
At 12:39 10th Jan 2012, ukpahonta wrote:#8. - lateintheday wrote:
To expand a little on my thinking, if you are interested, and this is just my un-educated personal opinion.
The Oceans are our major energy store, the Sun is our major energy source. The Earth, Solar relation tends towards stable states with ENSO acting as a natural PID control mechanism. Positive ENSO releasing stored energy through the atmosphere, increasing surface temps as a by product, and eventually into space, Negative ENSO moving cold water into the source of energy to top up the 'store' sucking energy out of the atmosphere.
I have a feeling that we are now in a lower solar energy level than the late 20th century to which the Earth is settling and we will see more shallow to deeper negative ENSO than positive, giving a gradual but sustained decrease in global average temperatures in the next decade at least. The theory being that the lower the output of the Sun, TSI I think is missing a component, then the longer period that ENSO needs to be negative to absorb energy. Of course there are many other variables that contribute in differing amounts to the system but I think we are entering into a period, previously unscrutinised in human history that will provide interesting times ahead. Of course the proof is in the empirical pudding.
Complain about this comment (Comment number 14)
Comment number 15.
At 13:21 10th Jan 2012, Sheffield_city wrote:We need to find other cleaner technology and reduce our reliance on fossil fuels, not because of so called man made global warming, but because of cost, scarcity and the middle east. Tata's new compressed air driven car is the start, which will reduce pollution that we humans suffer with, living in towns and cities. I am sure that many cases of asthma will disappear.
Complain about this comment (Comment number 15)
Comment number 16.
At 14:09 10th Jan 2012, lateintheday wrote:thanks ukpahonta and by the way, I suspect your 'uneducated' personal opinion is rather more educated than mine. You may have felt a need to explain your ideas in a simplified manner with the phrase 'sucking energy out of the atmosphere' - or is that how you see it?
The reason I ask is simply that I've been trying to grasp the fundamentals of heat transfer between water and air and as usual, things are never that straightforward.
Here's a simple thought experiment which I've come across a number of times. Two identical bathrooms warmed say to 18 degrees. You fill one bathtub full of warm water, the other bathtub with cold water.
You would naturally expect the warm water to cool down as it releases heat into the air, raising the ambient temp of the room. You might also expect this to happen quite rapidly, say within an hour or two. What happens in the other bathroom? Well my guess would be that the air temp might drop slightly but that there would be hardly any rise in the water temp. Timescale?
Now I understand that this has much to do with the difference in heat capacity of liquid and gas. I believe the difference is in the order of 2 or 3 magnitudes. That being the case, it seems to me very unlikely that the 20thC increase in OHC could be caused by a warming atmosphere, transferring heat energy into the oceans. The increase in OHC is more likely driven by solar variation and last time I looked, OHC had not risen (has flattened) since 2003.
Paul Briscoe and newdwr54 have on occasion argued (very well I might add) that if atmospheric temps were driven by the oceans, then we would expect to see a drop in OHC at the times of increasing atmospheric temp. I'm not sure that this argument is valid due to the massive difference in heat capacity of the two mediums. I understand that it may well be possible for the oceans to transfer a significant amount of heat to the atmosphere, without showing any obvious signs of cooling as long as the OHC driver is turned up so to speak.
The problem is, this level of physics/maths is way beyond me. I keep reading.
Complain about this comment (Comment number 16)
Comment number 17.
At 15:41 10th Jan 2012, Paul Briscoe wrote:lateintheday @ #16
"Paul Briscoe and newdwr54 have on occasion argued (very well I might add) that if atmospheric temps were driven by the oceans, then we would expect to see a drop in OHC at the times of increasing atmospheric temp. I'm not sure that this argument is valid due to the massive difference in heat capacity of the two mediums. I understand that it may well be possible for the oceans to transfer a significant amount of heat to the atmosphere, without showing any obvious signs of cooling as long as the OHC driver is turned up so to speak."
I'm sure you're correct to say that the oceans can transfer a lot of heat to the atmosphere without showing obvious signs of cooling. The point is that it is physically impossible for the oceans to be responsible for a LONG-TERM warming trend in atmospheric temperatures without a gradual (and eventually measurable) fall in OHC. In practice, though, the rise in surface temperatures has been accompanied by an INCREASE in OHC. Significantly, this has happened at a time of static or falling solar intensity.
Paul
Complain about this comment (Comment number 17)
Comment number 18.
At 16:18 10th Jan 2012, ukpahonta wrote:lateintheday
Completely agree, perhaps the phrase I should of used was 'depriving' the atmosphere of energy rather than 'sucking' energy out of the atmosphere.
I also agree that it is very complex but basically since the mid 1970's the oceans have been absorbing more energy from a highly active sun, modulating the amount stored where a positive ENSO has been more dominant, releasing the stored energy into the atmosphere and eventually into space. The bath water is hotter than the bathroom, humidity rises, surface temperatures rise.
Since the turn of the century, SC23 peak and 1998 EL Nino, the amount of energy coming into the system has gone through its minimum. The atmosphere contributes a lag time for the energy leaving the system which allows the next solar peak to come along to add energy into the oceans thus providing a buffer period, the energy balance being adjusted by ENSO.
The next expected Solar peak, in 2013, is forecast to be a lot lower than peaks late C20 and the cycle longer which means that if the Earth system requires more energy stored in the oceans then negative ENSO possibly will dominate for longer periods during this solar cycle, soaking up the Solar energy more than going into positive ENSO and releasing it. Will this affect diurnal temp, faster cooling at night?
Funny what you get excited by after a certain age!
We obviously don't have to forget that there is a regular energy exchange between the oceans and atmosphere, for example an arid dry desert retains less energy in the atmosphere above it overnight than a swamp or rain forest, it cools faster and deeper. Seasonally also the source of energy is focused more on one hemisphere than the other, mainly land mass in the North mainly Ocean in the South so the entire system is extremely complex and is way above my full understanding.
Large ENSO events are noticeable within the 'global average temperature' even if not fully understood and I don't for one instance think that we won't see another positive event in the near future but 2013 will be interesting as solar max is achieved as to the periodicity and strength of positive ENSO events in relation to the late C20 and the effect that this has on climate.
Complain about this comment (Comment number 18)
Comment number 19.
At 16:53 10th Jan 2012, lateintheday wrote:Paul B, there is an interesting post at WUWT titled "No new strange attractors: strong evidence against both positive feedback and catastrophe" which attempts to describe the underlying complexity behind chaotic systems.
What I found particularly interesting is how Dr Brown explains that the size of a forcing can be less important than the timing of the forcing. Whilst I'm sure that this is not news to you, it is relevant to the static/falling solar activity point you make above. Essentially, one might argue that the increasing solar intensity/activity of the 20thC led to a reduction in albedo (or other effects) which in turn increases insolation without an increase in solar activity. Fixed solar output therefore, can be more, or less effective (at melting ice for example) depending on the state of the object receiving the energy. This, in no way, does justice to what he's trying to say.
His conclusions on the probable outcomes for planet earth, (if AGW is real) is worth reading - even if you disagree with them.
Complain about this comment (Comment number 19)
Comment number 20.
At 17:23 10th Jan 2012, openside50 wrote:Well well well
thats the global warming panic over then - because the theory that said warming would continue accelerate even as CO2 emissions continued to climb has now been shown to be complete bunkum
14th year without any increase in warming while emissions climb ever higher
Complain about this comment (Comment number 20)
Comment number 21.
At 18:02 10th Jan 2012, john_cogger wrote:@20 Openside50
I think the theory has more to in than that...
More along the lines of -warming would continue as CO2 climbs and all other things remain equal.
The other things in the climate still happen. CO2 warming sits on top. We have just gone though a period of low sun activity, yet didn't cool as some predicted. Strong La Nina but temps stayed higher than some predicted.
No other theories yet to emerge on whats going on. Nobel price on offer if you turn the greenhouse effect on it's head. Global cooling is predicted at every La Nina and yet again it hasn't happened. Every Drop in the UAH is welcomed as the sign, yet it keeps going back up. Arctic ice keeps on failing to recover as Mr Bastradi et al predicted.
Complain about this comment (Comment number 21)
Comment number 22.
At 18:28 10th Jan 2012, Paul Briscoe wrote:lateintheday @ #18
I have serious concerns about what Robert Brown is saying and for me the alarm bells ring the moment I see someone spouting off in such detail without providing references to back up their claims. Specifically, I fear that he is attempting to extrapolate from chaotic elements, such as ENSO (which have little long term effect on climate) to draw conclusions about response of climate to a forcing, which is definitely NOT chaotic.
I'm no expert on this, but I would draw your attention to this article over at Skeptical Science:
https://www.skepticalscience.com/chaos-theory-global-warming-can-climate-be-predicted-intermediate.htm
The point is that climate is effectively "on a leash". Averaged out over time, the response of climate to a forcing IS predictable.
"What I found particularly interesting is how Dr Brown explains that the size of a forcing can be less important than the timing of the forcing."
I haven't seen any convincing evidence that this is correct. The point is that the forcing from CO2 is increasing all the time. The solar forcing effectively ended in the mid-20th century. You only need to look at the plot of sunspot number versus global temperature to see that the sudden increase in global temperature post 1970 doesn't match the Earth's previous response to solar forcing.
In any case, the fact that CO2 traps more heat in the atmosphere is established physics and the only REAL doubt is over feedbacks. So if the recent temperature rise were really a delayed response to a past solar forcing, you would still need to account for where all the extra heat being trapped by CO2 is going! You would also need to bear in mind that the same feedbacks would apply to a solar forcing as apply to a CO2 forcing, so if the small solar forcing from the first half of the 20th century has really caused the recent warming, that indicates that feedbacks are strongly positive, NOT negative as Dr Brown suggests - so many inconsistencies!
Until Dr. Brown (whose qualifications and expertise are unclear) can put together a peer-reviewed paper to back up his claims I'm not inclined to take him very seriously, I'm afraid.
Paul
Complain about this comment (Comment number 22)
Comment number 23.
At 18:38 10th Jan 2012, Paul Briscoe wrote:openside50 @ #20
As has been pointed out MANY times in recent threads, when you superimpose a gradual warming trend on top of a temperature series with a large amount of noise due to natural variation, you would actually EXPECT to get extended periods where there is no apparent increase in temperature. Recent studies suggest that such periods of little warming could extend to as much as 17 years without suggesting any reduction in the underlying upwards trend in global temperatures.
The truth is that it is simply NOT POSSIBLE to draw firm conclusions about whether the rate of warming has really slowed, stopped, reversed, or even speeded up based on such a short period.
Paul
Complain about this comment (Comment number 23)
Comment number 24.
At 19:46 10th Jan 2012, Pkthinks wrote:Paul Briscoe#23 wrote
'you would actually EXPECT to get extended periods where there is no apparent increase in temperature'
But not for too long. I take it by 'firm conclusions' You mean statistical significance' for the trends and the rate of warming over a given period are easy to see
https://www.climate4you.com/GlobalTemperatures.htm temperature trends
it is interesting that OHC short term trend has flatlined rather on cue (ie as one would expect in a coupled system)
https://www1.ncdc.noaa.gov/pub/data/cmb/images/indicators/ocean-heat-content.gif
so how soon will OHC trend and surface temps trend be significant if there is not a sudden increase?
I would like to see your prediction for the next five years.
There has been much discussion of the MOs decadal prediction and they have commited themselves to predicting quite a warm spell for the next decade (I think we will still be on the .1/decade for the first twenty years of the twentyfirst century)
Just out of interest do you consider only warming in excess of the very long term trend 0.7 degrees or any warming trend as significant?
Complain about this comment (Comment number 24)
Comment number 25.
At 20:59 10th Jan 2012, Paul Briscoe wrote:Pkthinks @ #24
"But not for too long."
Scientists who have studied this (eg Santer et al 2011) have concluded that a period of at least 17 years is required to discriminate between internal climate noise and the signal of AGW (let alone establish a warming rate!). Meanwhile, Dr Richard Muller pointed out that there is an equally flat trend between 1980 and 1995 in the midst of a spell that even sceptics acknowledge substantial warming took place.
When people use the arguments you appear to be doing here, I tend to draw their attention to the foillowing video:
https://www.youtube.com/watch?v=23iGJbkbzzE
This shows just how foolhardy it is to attempt to draw ANY conclusions about temperature trends based on a short period...... and when that period includes the spike caused by the exceptional 1998 El Nino close to its start it is especially questionable to draw conclusions.
"so how soon will OHC trend and surface temps trend be significant if there is not a sudden increase?
I would like to see your prediction for the next five years."
I really have no idea and personally I see little point in speculating. It's the long term trends that count. As for the Met Office's projection, if I understand it correctly, they are basing it on how the models project global temperature responding to the CO2 in the atmosphere. Actual temperatures are currently below where the models suggest they should be, but given that this could simply be due to noise (which the models don't predict) it is entirely possible that temperatures will start to rise quite quickly in the next few years. The scientific community are clearly pretty confident that this is what will happen and the MO projection reflects this.
"Just out of interest do you consider only warming in excess of the very long term trend 0.7 degrees or any warming trend as significant?"
No! Even a "very long term warming trend" has to have a proper scientific explanation and the only credible one in recent decades is AGW.
Paul
Complain about this comment (Comment number 25)
Comment number 26.
At 21:51 10th Jan 2012, lateintheday wrote:PB asks who is Dr Brown . . .
B.S. from Duke University, 1977
Magna Cum Laude, four years on the Dean's list with class honors. Majors were Physics and Philosophy, with a minor interest (eight course credits, four at the graduate level) in Mathematics.
PhD. from Duke University, 1982
General area: theoretical and mathematical condensed matter physics. Ph.D. dissertation: ``The position space Green's function and its application to a non--muffin--tin band theory'' available from Duke University Library.
Physicist
During the interval from 1982-present, research accomplishments include: the first correct derivation of a formally exact, non-muffin-tin multiple scattering theory (which effectively eliminates both the muffin-tin approximation and the need for "near field" corrections from stationary multiple scattering theory in most solid state and quantum chemistry calculations); the one of the first applications of microscopic simulation techniques to problems in nonlinear quantum optics; the first correct Monte Carlo evaluation of the dynamic critical exponents and properties of the classical Heisenberg (O(3)) model; a careful examination of the role of the Central Limit Theorem in obtaining unbiased error estimates from importance sampling Monte Carlo driven by a variety of Markov processes; and most recently, the most precise evaluation of the static critical exponents of the classical Heisenberg model ever done.
Complain about this comment (Comment number 26)
Comment number 27.
At 21:55 10th Jan 2012, Pkthinks wrote:#25 Paul Briscoe wrote:
Re the global climate for the next 5yrs
'I really have no idea and personally I see little point in speculating'
Well thats a surprise because there are lots of simple forecasts based on the IPCC models to draw upon, particularly the oft quoted sres a1b emissions scenario and the warming associated with that, you would be only part of the great consensus by predicting similar warming to the MO and IPCC
I am only highlighting where the trends are going and that the warming would be quite dramatic to put them back on the ensemble mean
I agree even a very long term record has to have a scientific explanation but that is not the same as saying it has to be anthropogenic , do you realise the conclusion first IPCC report (as recently as 1990) was that the anthropogenic signal was not significant yet?
So I think the idea increasingly promoted that anthropogenic warming began as many decades in the past,as suits your statisics is obviously seriously flawed.
I fully expect the very long term warming trend to continue but am very sceptical about the exponential warming predicted for the 21st century
Complain about this comment (Comment number 27)
Comment number 28.
At 23:06 10th Jan 2012, Paul Briscoe wrote:lateintheday @ #26
Thanks. There are quite a few Robert Browns!!!
I'm still pretty sure most scientists who study climate wwould disagree with him. It also still begs the question "why hasn't he produced a peer-reviewed paper to back up his claims"?!
Paul
Complain about this comment (Comment number 28)
Comment number 29.
At 23:27 10th Jan 2012, lateintheday wrote:I think these are just his (educated) opinions Paul - nothing more. All stemmed from a comment he made on a blog somewhere. I doubt if he would be funded to produce anything in this field since he's not a climate scientist.
I found it interesting though - as was your link to SkS on this occasion.
Complain about this comment (Comment number 29)
Comment number 30.
At 23:34 10th Jan 2012, Paul Briscoe wrote:Pkthinks @ #27
"Well thats a surprise because there are lots of simple forecasts based on the IPCC models to draw upon, particularly the oft quoted sres a1b emissions scenario and the warming associated with that, you would be only part of the great consensus by predicting similar warming to the MO and IPCC"
You miss the point. I am a scientist from a completely different field. I therefore know that it is experts in climate science who are best placed to make such judgements. So why would I presume to make predictions of my own?!
"I am only highlighting where the trends are going and that the warming would be quite dramatic to put them back on the ensemble mean"
Well no! All it would take would be a couple of reasonably strong El Nino's. As pointed out by John Cogger above, we've had a prevalence of La Nina (cooling) conditions and lower than predicted solar activity in recent years. There has also been a substantial increase in aerosols from Far Eastern coal burning. The most recent IPCC projections, which were based on scenarios from more than a decade ago, could never have accounted for these.
"I agree even a very long term record has to have a scientific explanation but that is not the same as saying it has to be anthropogenic , do you realise the conclusion first IPCC report (as recently as 1990) was that the anthropogenic signal was not significant yet? "
You seem to have forgotten that science progresses! Back in 1990, the period of recent warming, which could not be explained by solar forcings, was only around 15 years old........ and, as discussed above, this is not long enough to draw firm conclusions about warming trends.
"So I think the idea increasingly promoted that anthropogenic warming began as many decades in the past,as suits your statisics is obviously seriously flawed."
Statistically significant warming occured long before the most recent warming trend, but much of this can be explained by a gradual increase in solar intensity. However, the most recent period cannot. You seriously underestimate the competence and level of understanding of the scientific community.
"I fully expect the very long term warming trend to continue but am very sceptical about the exponential warming predicted for the 21st century"
Fair enough, but forgive me if I prefer to trust the judgement of people who have spent their entire working lives studying the science in detail.
Paul
Complain about this comment (Comment number 30)
Comment number 31.
At 01:37 11th Jan 2012, RobWansbeck wrote:@30, Paul Briscoe wrote:
“ There has also been a substantial increase in aerosols from Far Eastern coal burning. “
Tamino & Rahmstorf, 2011, shows that Far Eastern coal burning has no significant effect on the 'correct' trend. Surely you are not suggesting that Tamino could have over-fitted some other parameter to get the 'correct' result?
Complain about this comment (Comment number 31)
Comment number 32.
At 08:20 11th Jan 2012, Paul Briscoe wrote:RobWansbeck @ #30
"Tamino & Rahmstorf, 2011, shows that Far Eastern coal burning has no significant effect on the 'correct' trend."
I haven't seen anything to suggest that Rob. My understanding is that they looked specifically at the effects of volcanic activity and that the method used did not detect the sulphate aerosols specific to coal burning.
If you look at the graph of "AOD" index that they used to allow for volcanic activity, it appears to be specific to volcanoes and doesn't even detect the recent rise in anthropogenic sulphate aerosols.
Paul
Complain about this comment (Comment number 32)
Comment number 33.
At 08:22 11th Jan 2012, LabMunkey wrote:@ Paul #30
" I am a scientist from a completely different field. I therefore know that it is experts in climate science who are best placed to make such judgements"
That is utter utter shi..... rubbish. Any scientist can make informed decisions on the fields of other scientists with sufficient information.
"Statistically significant warming occured long before the most recent warming trend, but much of this can be explained by a gradual increase in solar intensity. However, the most recent period cannot. You seriously underestimate the competence and level of understanding of the scientific community"
The only problem with this statment Paul is that it includes the tacit assumption that all the forcings are known. We simply do not know this. IN fact, as the exceptionally young field matures, we're finding more and more factors that can directly affect climate.
Your certainty in the opinion of these experts is.... quaint, but your unwillingness to question their position i think, may come back to haunt you.
As for the significance of the recent hiatus. I was under the inpression that 15 years was the statistical significance point? Or has this goal post been moved again?
the interesting aside to this of course, is that even if the warming resumes, it still doesn't actually support cAGW, especially given historic temperatures.
Given my experience working with tempcontrol software i'd need to see a rapid step change in global temp (with the feedback oscilation afterwards, indicative of a forcing 'push' as it were) to make me think that the trends are anything other than natural.
Finally, doesn't the fact that the recent hiatus shows natural forcings can easily outweigh anthropogenic ones undermine the whole 'we're' doomed scenario?
"
Complain about this comment (Comment number 33)
Comment number 34.
At 08:40 11th Jan 2012, lateintheday wrote:Don't want to add to your workload here Paul but you said . . .
"Well no! All it would take would be a couple of reasonably strong El Nino's. As pointed out by John Cogger above, we've had a prevalence of La Nina (cooling) conditions and lower than predicted solar activity in recent years. There has also been a substantial increase in aerosols from Far Eastern coal burning. The most recent IPCC projections, which were based on scenarios from more than a decade ago, could never have accounted for these."
These were expected by everyone else Paul. The shift to the cold phase of the PDO was due and is characterised by a prevalence of La Nina events.
Some (not Hathaway group) solar experts predicted a lower, flatter cycle including Svalgaard, Landscheidt, Abdussamatov etc. Not only that, but according to climate consensus, this shouldn't make a gnats difference even if it persists for 50 years. So a small lull in activity, which could be described as a slightly lower and longer minimum followed by a slower rise to max (so far) should hardly register.
China's growth was well underway and known to be fuelled by their massive coal reserves. So much so that they were specifically exempted from Kyoto (as a developing nation) with regards to their growing CO2 emissions. That they would soon overtake the USA as the prime contributor to worldwide emissions was a given. In fact, they took the 'title' a couple of years ago.
Complain about this comment (Comment number 34)
Comment number 35.
At 09:20 11th Jan 2012, lateintheday wrote:and also in reply to pkthinks you said. . .
"Statistically significant warming occured long before the most recent warming trend, but much of this can be explained by a gradual increase in solar intensity. However, the most recent period cannot."
Actually, that was the point about the Dr Brown posting which I hope you read, since my garbled attempt to precis it was rather pathetic. Having read the SkS piece which you linked to, there is clearly some misunderstanding based purely on the precise (semantic) mathematical terms. The point is this. The scale of one forcing effects the whole system to such extent that the subsequent forcing's effect cannot be predicted accurately in advance. It may be predictable in general terms only, within the bounds of the system and the known attractors. Solar cycles 20, 21 and 23 were of similar magnitude but they encountered different conditions on Earth. As such, their effects should not be expected to be identical. If for example, cycle 20 melted a significant amount of multi year ice, then the albedo is changed. Natural weather/climate oscillations would amplify or minimize the effect depending on the timing of the event and the specific conditions encountered. The subsequent solar cycle could be smaller but melt more ice, or larger and melt less - again effecting the albedo.
I'd agree with the SkS main article to some extent - Climate isn't as chaotic as weather, but it certainly isn't anywhere near linear either. The upshot is, even if the strength of forcings remain the same, the bounds of natural variation are both increased, and subsequently limited by this mathematical interpretation.
and also . .
"Fair enough, but forgive me if I prefer to trust the judgement of people who have spent their entire working lives studying the science in detail."
It's equally possible that some of these people have spent their entire working lives trying to find evidence of AGW rather than study the science objectively.
Complain about this comment (Comment number 35)
Comment number 36.
At 09:34 11th Jan 2012, Paul Briscoe wrote:LabMunkey @ #33
You certainly know how to rub me up the wroing way! One of my pet hates is people who clearly don't know as much as they think arrogantly presuming that they are experts!!
"Any scientist can make informed decisions on the fields of other scientists with sufficient information."
True, but "sufficient information" is a great deal more than most people posting here (including you and I) have considered to make FULLY informed analysis of the science as a whole. As stated so many times, it is the big picture which counts.
"The only problem with this statment Paul is that it includes the tacit assumption that all the forcings are known. We simply do not know this. IN fact, as the exceptionally young field matures, we're finding more and more factors that can directly affect climate."
Sorry, but this is the type of argument employed by those in denial about science. Claiming that a particular branch of science is not valid because there MIGHT be some as yet unknown factor which could change our understanding is NOT a valid scientific argument. Science HAS to be based on what we know in the here and now. Furthermore, the big picture which I referred to above strongly indicates that anthropogenic CO2 is the main factor causing recent warming. The fact that you question this indicates to me that you are far from as objective as you appear to believe.
"Your certainty in the opinion of these experts is.... quaint, but your unwillingness to question their position i think, may come back to haunt you."
On the contrary, based on a careful personal assessment of the science, I am pretty confident that it is you who will ultimately be forced to eat humble pie!
"As for the significance of the recent hiatus. I was under the inpression that 15 years was the statistical significance point? Or has this goal post been moved again?"
I think 15 years was the period carefully selected by deniers to ensure that the statistical significance test would just fail!
As for the rest of your post, you're just showing your true colours, as you're putting up unrealistic hurdles that climate science will have to clear before you will accept it. This too is a well established tactic of scientific denialism.
Sorry to be so blunt!
Paul
Complain about this comment (Comment number 36)
Comment number 37.
At 09:55 11th Jan 2012, Paul Briscoe wrote:lateintheday @ #34 and #35
"Don't want to add to your workload here....."
You've caught me on a bad day, lateintheday!!
Quickly, my understanding is that the scenarios are not put together by the modellers themselves and they almost certainly don't account for the full range of scientific knowledge. There is also bound to be a certain amount of guesswork involved.
As I understand it, not everyone is so convinced that there are predictable cycles in the PDO. Also, although many scientists predicted that solar activity was likely to fall, nobody was able to say precisely when. Meanwhile China's decision to burn coal without scrubbing out SO2 was an internal policy decision and not something which the scientific community could be expected to predict.
Regarding Robert Brown's points that you referred to, there is too much to cover in detail here. However, as I pointed out above, he is doing what most sceptics do - concentrating on short term influences and in the process ignoring the far bigger picture of the long term trends. In this sense, the solar forcing finished over 50 years ago and slight changes from one solar cycle are far less important than the mean TSI.
"It's equally possible that some of these people have spent their entire working lives trying to find evidence of AGW rather than study the science objectively."
I would agree that it's possible that one or two scientists might be guilty of this, but for the science to be wrong and for peer-review to fail, the entire scientific community would have to be the same. In my experience this is highly unlikely.
Paul
Complain about this comment (Comment number 37)
Comment number 38.
At 11:53 11th Jan 2012, lateintheday wrote:Off topic (and cheeky) I know, but does anyone hold any strong opinions on CIVITAS. They produced a damning report (Ruth Lea) yesterday regarding the 'Folly of Windpower'. I've looked them up on the net (briefly) and they portray themselves as a non-partisan think tank with no political affiliations.
In the interests of full disclosure, I'm involved with a small rural community action group which has been fighting a windfarm application in my area. I would like to refer to the report in a local newsletter, but not if it turns out to be produced by a group of extremists or nutters.
All views welcome.
Complain about this comment (Comment number 38)
Comment number 39.
At 12:26 11th Jan 2012, Lazarus wrote:lateintheday wrote:
"does anyone hold any strong opinions on CIVITAS. They produced a damning report (Ruth Lea) yesterday regarding the 'Folly of Windpower'."
What are CIVITAS's credentials for doing this? There has been some pretty damming reports of CIVITAS's damning report;
https://www.businessgreen.com/bg/news/2135974/renewableuk-slams-civitas-wind-power-report-inaccurate-outdated
https://www.evwind.es/noticias.php?id_not=15747
https://www.guardian.co.uk/environment/blog/2012/jan/09/wind-turbines-increasing-carbon-emissions?INTCMP=SRCH
https://www.oilvoice.com/n/Civitas_wind_power_report_slammed_by_RenewableUK_as_inaccurate_and_outdated/f9b0bc5cecea.aspx
Personally I cant accept CIVITAS as a credible source. They are some sort of social policy think tank with obvious agenda and bias.
Complain about this comment (Comment number 39)
Comment number 40.
At 13:17 11th Jan 2012, lateintheday wrote:Lazarus said . .
"Personally I cant accept CIVITAS as a credible source. They are some sort of social policy think tank with obvious agenda and bias."
mmm.. In my view, the Guardian only just scrapes in as a credible source! I can't accept any of the other links as impartial I'm afraid. Not least because I've personally fought against a windfarm application and have witnessed first hand, the dirty tricks played (and still being played) by the wind industry and it's supporters.
I'm frankly amazed that you thought it proper to link to RenewableUK as a source - talk about obvious agenda and bias!
I tend to agree with Leo Hickman's verdict, which is that finding a truly impartial voice is almost impossible.
Anyway, thanks for your response.
Complain about this comment (Comment number 40)
Comment number 41.
At 13:36 11th Jan 2012, RobWansbeck wrote:@38, lateintheday,
Have you seen this site:
https://www.windbyte.co.uk/index.html
It contains much up to date information and there is also a link to an e-petition that may interest some.
Towards the top right in the menu bar there is a link to a 'dirty tricks' page that shows how energy companies use 'rent-a-mob' supporters.
Complain about this comment (Comment number 41)
Comment number 42.
At 14:39 11th Jan 2012, Spanglerboy wrote:Lateintheday #38
you might try to contact Dr Phillip Bratby who I believe has some experience in fighting windmills and who is a regular commenter on many blogs. You can find him via Facebook
Complain about this comment (Comment number 42)
Comment number 43.
At 15:37 11th Jan 2012, Sheffield_city wrote:Snow came very late in the Alps, but when it came they had record levels. They have just had another massive amount, 6-7ft in four days. In some places it is the highest levels of snow since 1950. The concerning thing in Britain, is that the establishment has put so much of its faith in global warming, that they are leaving the door open for a big disaster. I thought last year may have been a warning to these people. Last year we had massive amounts of snow before Christmas, then quite a mild winter after Christmas. However if this year we have had a mild winter before Christmas and the reverse happens after Christmas, then we could be in for a very nasty shock.
Complain about this comment (Comment number 43)
Comment number 44.
At 15:59 11th Jan 2012, RobWansbeck wrote:@32, Paul Briscoe wrote:
“ If you look at the graph of "AOD" index that they used to allow for volcanic activity, it appears to be specific to volcanoes and doesn't even detect the recent rise in anthropogenic sulphate aerosols. “
I agree yet after applying his adjustments which do not include sulphate aerosols Tamino himself states “None of the data sets shows any evidence that the global warming rate has changed recently.”
Thus, if Tamino is correct, these sulphate aerosols cannot be used to explain the recent lack of warming.
Complain about this comment (Comment number 44)
Comment number 45.
At 16:33 11th Jan 2012, Paul Briscoe wrote:RobWansbeck @ #44
"Thus, if Tamino is correct, these sulphate aerosols cannot be used to explain the recent lack of warming."
That doesn't necessarily follow. What Tamino is saying is that there is no evidence, once volcanoes, ENSO and solar effects have been removed, that the warming rate has changed. This does not exclude the possibility that warming could actually have accelerated without the cooling effect of sulphate aerosols.
Paul
Complain about this comment (Comment number 45)
Comment number 46.
At 16:34 11th Jan 2012, QuaesoVeritas wrote:There have also been heavy snowfalls in Alaska, cutting off Cordova and Nome.
https://www.bbc.co.uk/news/world-us-canada-16495880
It makes me wonder whether Piers Corbyn could have been correct, but he just got the locations wrong.
I wonder how he can be so sure of the location of the snow he predicted.
Complain about this comment (Comment number 46)
Comment number 47.
At 16:52 11th Jan 2012, john_cogger wrote:@46 QuaesoVeritas
Got the locations wrong? If I say it will have very heavy snow in mainland USA, it's very easy for me to be correct if I'm allowed to use the snow in Alaska as proof!
It's like predicting strong storm force winds in the UK, and using strong winds on the Shetlands as the proof. At some point over winter somewhere will have heavy snow, forecasts are useless if you don't get the roughly right area at the roughly right time.
Complain about this comment (Comment number 47)
Comment number 48.
At 17:48 11th Jan 2012, Sheffield_city wrote:Heavy snow in the alps. https://www.dailymail.co.uk/news/article-2084917/European-ski-resorts-lockdown-freak-snowfalls-cut-road-rail-air-links.html
Complain about this comment (Comment number 48)
Comment number 49.
At 17:53 11th Jan 2012, RobWansbeck wrote:@45, Paul Briscoe wrote:
“ This does not exclude the possibility that warming could actually have accelerated without the cooling effect of sulphate aerosols. “
LOL, I had considered asking could this mean that 'it's worse than we thought'. :)
Complain about this comment (Comment number 49)
Comment number 50.
At 18:09 11th Jan 2012, QuaesoVeritas wrote:#47. - john_cogger wrote:
"Got the locations wrong? If I say it will have very heavy snow in mainland USA, it's very easy for me to be correct if I'm allowed to use the snow in Alaska as proof!"
I quite agree.
I wasn't actually putting this forward as an excuse, more a rhetorical question, since I am not aware of how Corbyn works out the locations of his forecasts.
Complain about this comment (Comment number 50)
Comment number 51.
At 18:16 11th Jan 2012, QuaesoVeritas wrote:I have been sent a file by the MO which supposedly contains the numeric forecasts which were used to produce the decadal forecasts published by the MO on December 14th and I am currently attempting to make sense of them.
The file is split into three sequences of dates.
1. dated 2005.5 to 2014.25, which seems to correspond to the previous predictions for that period (white curve on the graph).
2. dated 2011.67 to 2020.42, which seems to correspond to the most recent forecast (thick blue curve).
3. dated 1985.5 to 2004.25, which seem to correspond to the previous predictions for that period (white curve).
I list them in the above order, because that is the order in which they appear in the file.
The figures are arranged into columns, entitled "ens_av", which I assume to be the ensemble average, "ens_sd", which I assume to be the standard deviation, and "ens1" to "ens20", in the case of the most recent forecasts and "ens1" to "ens8" in the case of those for 1985.5 to 2004.25. The following comments are based on "ens_av" figures.
One puzzling thing is that while the forecasted temperatures for 2011.67 to 2020.42 do seem to correspond to those in the graph, and reach about 0.8c, before falling slightly, the mean figure for 2012.08 to 2013.0 is 0.46c, corresponding to a 1961-90 anomaly of 0.58c, compared to the latest MO predicted anomaly for 2012 of 0.48c.
So either I am doing something wrong, or the latest forecast for 2012 is already 0.1c lower than the one in the decadal forecast.
Another puzzle is that the article says that temperatures are expected to rise to between 0.36c and 0.72c during the period 2012-2016, with values most likely to be 0.54c higher. Originally I had interpreted this to mean a rise from 0.36c to 0.72c, but I now think that it means a range of 0.36c to 0.72c by 2016, with a mean of 0.54c. However, the mean "ens_av" for the period 2016.08 to 2017.0 is 0.648c and I can find no individual ensemble value less than 0.492c.
For those who might be interested, the predicted "ens_av" figures for 2011.67 to 2013 are as follows:
2011.67 0.345
2011.75 0.354
2011.83 0.366
2011.92 0.382
2012.00 0.396
2012.08 0.412
2012.17 0.423
2012.25 0.433
2012.33 0.442
2012.42 0.451
2012.50 0.459
2012.58 0.461
2012.67 0.464
2012.75 0.472
2012.83 0.485
2012.92 0.501
2013.00 0.514
Complain about this comment (Comment number 51)
Comment number 52.
At 18:41 11th Jan 2012, john_cogger wrote:@50 QuaesoVeritas
True it can be said there might be something in his methods, in that he got the event right (Very Heavy snow), at the right time (within a day or 2) but the wrong location.
However, how do you factor in the role of chance? I think for some of his monthly forecasts there can be 25+ days covered under a warning eg - 1st-4th = high winds, 6th-10th high winds and snow, 12th to 15th snow, etc Such a forecast covers you for high wind from the 1st to the 10th or snow from the 6th to the 15th, a much wider window than is portrayed.
Also there is the problem in that he says he predicted various CME's months in advance (only he seems to be capable of this, NASA can't) but couldn't predict a non-earth bound solar filament which completed altered his December forecast.
The same can be said for his eathquake predictions, if magnitude 6+ earthquakes happen somewhere every couple of days how hard is it to get some hits? (I don't know to be fair, how many mag 6+ earthqakes there are on average. Anyone?)
Complain about this comment (Comment number 52)
Comment number 53.
At 18:47 11th Jan 2012, greensand wrote:@51. QuaesoVeritas
Thanks QV, whilst all is not not immediately clear at least you have the data.
Will take a long look
Complain about this comment (Comment number 53)
Comment number 54.
At 19:05 11th Jan 2012, greensand wrote:QV, I see what you mean about the differing anomalies, here we go again!
Met Office 2012 annual global temperature forecast
4 January 2012 – “2012 is expected to be around 0.48 °C warmer than the long-term (1961-1990)"
https://www.metoffice.gov.uk/news/releases/archive/2011/2012-global-temperature-forecast
Whilst
Decadal forecast
14 December 2011 "predicted global average annual surface temperature difference relative to 1971-2000.”
https://www.metoffice.gov.uk/research/climate/seasonal-to-decadal/long-range/decadal-fc
PS, what are you taking as being the start and end of 2012?
2012.08 to 2013.00 or 2012.00 to 2012.92?
Complain about this comment (Comment number 54)
Comment number 55.
At 19:16 11th Jan 2012, QuaesoVeritas wrote:#54. - greensand wrote:
"PS, what are you taking as being the start and end of 2012?
2012.08 to 2013.00 or 2012.00 to 2012.92?"
I took 2012.08 to 2013.0, although it doesn't really make a great deal of difference if you use 2012.0 to 2012.92.
Logically, 2013.0 should be midnight on December 31st.
Unless there is a "convention" on decimal dates which I am not aware of.
I am open to suggestions.
Complain about this comment (Comment number 55)
Comment number 56.
At 19:23 11th Jan 2012, john_cogger wrote:In the yearly comp, I think I'll go for 0.43
Complain about this comment (Comment number 56)
Comment number 57.
At 19:27 11th Jan 2012, greensand wrote:@55. QuaesoVeritas
Agree with the logic I have taken 2012.08 - 2013.00, which gives a simple ave of 0.460C, though not sure that it is applicable?
2012.00 to 2012.92 gives 0.450C
Complain about this comment (Comment number 57)
Comment number 58.
At 19:55 11th Jan 2012, Paul Briscoe wrote:RobWansbeck @ #49
"LOL, I had considered asking could this mean that 'it's worse than we thought'"
As far as I can see, the authors have avoided such speculation!!
Paul
Complain about this comment (Comment number 58)
Comment number 59.
At 20:50 11th Jan 2012, QuaesoVeritas wrote:#57. - greensand wrote:
"Agree with the logic I have taken 2012.08 - 2013.00, which gives a simple ave of 0.460C, though not sure that it is applicable?"
Can you clarify what you mean by the last bit?
Do you mean is a simple average applicable?
I haven't tried a weighted average but I don't think it would make a big difference.
I intend to e-mail the MO for a clarification of the difference in the 2012 figures.
Complain about this comment (Comment number 59)
Comment number 60.
At 20:54 11th Jan 2012, openside50 wrote:""I wonder how he can be so sure of the location of the snow he predicted.""
If Hansens outfit can claim they found global warming where nobody else found it by fiddli.....sorry extrapolating temperature data thousand miles out into the Arctic where no temp stations existed - then we can surely allow Corbyn the luxury of being a few thousand miles out in his own prediction
Complain about this comment (Comment number 60)
Comment number 61.
At 21:33 11th Jan 2012, greensand wrote:@59. QuaesoVeritas wrote:
"Can you clarify what you mean by the last bit?"
Not really, I was thinking out loud! I have since tried both a "simple ave" = total/12 and total/366xMth Days. Both the same +0.460C.
So you were right "I don't think it would make a big difference."
I just like to get the basics nailed down first before I really confuse myself!
I will be very interested in the MO answer to your e-mail
Complain about this comment (Comment number 61)
Comment number 62.
At 22:12 11th Jan 2012, Pkthinks wrote:The Met office graph is confusing it would be nice to show the individual projections and explain the basics of how the different forcing assumptions used
I still don't understand why they state 5% rather than 10 above and below for a 90% confidence interval is this not a mistake?
Complain about this comment (Comment number 62)
Comment number 63.
At 01:41 12th Jan 2012, NeilHamp wrote:Thanks john for your forcast
Only 3 takers so far this year
At the moment I am proposing +0.42
Complain about this comment (Comment number 63)
Comment number 64.
At 12:56 12th Jan 2012, lateintheday wrote:Thanks Rob & Spangerlboy for your responses.
We're a few years into this particular fight, but they never give up do they. I may have mentioned it before, but it's this windfarm application that got me interested in the whole climate change thing. They bang on about how we should be 'doing our bit' to save the planet from the curse of CO2, but neglect to mention the paltry CO2 savings this sort of development actually brings. Especially in light of global emissions, Kyoto etc. They are currently trying to 'bribe' the locals with an improved community chest offer. They even have the audacity to refer to it as a community regeneration fund. Considering the amount of damage this application has already caused to the cohesion within our previously close knit village, I find this utterly disgraceful.
And Rob - yes2wind have been active in this area also.
NeilHamp - I'm sure you'll get more than 3 again. Unfortunately, I'm not remotely qualified to offer an estimate (would just be a stab in the dark) but I look forward to seeing the competition progress.
Complain about this comment (Comment number 64)
Comment number 65.
At 13:49 12th Jan 2012, QuaesoVeritas wrote:#64. - lateintheday wrote:
"Unfortunately, I'm not remotely qualified to offer an estimate (would just be a stab in the dark)"
I wouldn't let that worry you!
Complain about this comment (Comment number 65)
Comment number 66.
At 15:07 12th Jan 2012, lateintheday wrote:ha!
Complain about this comment (Comment number 66)
Comment number 67.
At 16:37 12th Jan 2012, ukpahonta wrote:It's all guess work until you get paid for it. Then it's modeled.
Complain about this comment (Comment number 67)
Comment number 68.
At 18:01 12th Jan 2012, Sheffield_city wrote:Can anybody explain why .13 above a thirty year average, says that the planet is warming? It is so insignificant.
Complain about this comment (Comment number 68)
Comment number 69.
At 21:06 12th Jan 2012, QuaesoVeritas wrote:#51. - donna wrote:
"What I have to say has nothing to do with the weather but I've emailed the BBC before and just got back a standard answer, I'd like to ask the question, why is the North below the North East on the bbc tide times map? I use the site regularly and it never fails to irritate me, also on this map Spurn Point is classed as in the North, as anyone from the area knows it is clearly on the east coast and as such is in the East Riding of Yorkshire!!! The site needs updating and obviously by someone who has a clue about the geography of England!!"
Donna, the other topic is now closed, so I am taking the liberty of re-posting what you said on this one.
I am not familiar with the BBC tide times map, but I have had a look at it and as you say, the BBC seem to have classified the lower part of the NE coast as the "North" for some reason. I can only assume that this is for convenience as there isn't sufficient space to include those locations in either the "North East" or the "East" maps.
I can understand your frustration at the lack of communication from the BBC as they rarely respond to complaints or comments sent to them via their website.
When they do respond, you can't reply to their communication and you have to go back into their "contact us" system and start from scratch. They also seem to do everything they can to discourage anyone from sending them messages.
Complain about this comment (Comment number 69)
Comment number 70.
At 22:50 12th Jan 2012, jkiller56 wrote:to John Cogger#52 and others.
Don't be tempted to give credence to Corbyn predictions via chance weather events. Please NO!
I mean, just think of the logic of what you are proposing. He predicts heavy snow in a particular place. You scan the globe for heavy snow and find it! Hey presto, he must be right! Lets forget it was a few thousand miles out.
Would you then believe your horoscope if it said you would travel in April? No but I did go away in September. Goodness , how uncanny!
Allow yourself a bit of intellectual self respect - for goodness sake. The only hope for humanity is that (to quote) "you cannot be serious".
Complain about this comment (Comment number 70)
Comment number 71.
At 23:00 12th Jan 2012, john_cogger wrote:@70 jkiller56
I was hoping my skepticism was shining through! I'll try to increase my levels of sacasm!
I think he is very good at what he does and I don't mean weather forecaster!
Complain about this comment (Comment number 71)
Comment number 72.
At 23:09 12th Jan 2012, jkiller56 wrote:Re Donna and the BBC
I wouldn't attach much if any significance to what is defined as "north" or "northeast" or whatever. These are just catagories of convenience which I am sure you will find, vary depending on who happens to be doing the defining and for what reason.
As far as I am aware there is no legal or scientific definition of "The North".
Presumably, because the east coast is rather long with a large number of ports, it needs to be broken into managable sections for the purposes of tide times. The north east just happens to be farther north than those bits of the north in Yorkshire,( if you follow!) so comes first - in its own section.
The north west coast, by comparison is shorter, and southern Scotland is on the same latitude as Durham and Northumberland (roughly on the North/north east boundary).
Anyway, that's my explanation - for what its worth.
Complain about this comment (Comment number 72)
Comment number 73.
At 23:20 12th Jan 2012, NeilHamp wrote:For the record - 2012 forcasts to date
Met.Office +0.48
John Cogger +0.43
NeilHam +0.42
Ukpahonta +0.28
Complain about this comment (Comment number 73)
Comment number 74.
At 23:31 12th Jan 2012, jkiller56 wrote:To John Cogger#71
I am relieved that you are joking - very relieved.
Yes, you must indeed hone your sarcasm skills. You never know who might be reading. Believe me, we have had people on this blog making similar (but quite serious) arguments to defend Corbyn and co.
Have no doubt, they would eagerly take you at your word!
Complain about this comment (Comment number 74)
Comment number 75.
At 08:17 13th Jan 2012, john_cogger wrote:@74 jkiller56
I do find it all very interesting and it can be fun comparing a 'verified' forecast with what actually happened and what was actually forecast.
Complain about this comment (Comment number 75)
Comment number 76.
At 08:36 13th Jan 2012, LabMunkey wrote:@ Paul#36.
Well on tries mate, one tries ;-)
"True, but "sufficient information" is a great deal more than most people posting here (including you and I) have considered to make FULLY informed analysis of the science as a whole."
Incorrect. You're taking the position that we need to fully understand every aspect of the ensemble, to then be able to critique it. This is clearly and demonstratably false.
For example a lot of the 'c' in cAGW requires large, positive water feedback. Simple deduction on the current state of knowledge re clouds shows any conclusions based on this is impossible (at present- though it doesn not preclude strong amplifications).
That right there, with using only basic scientific thought shows the theory is weak.
"Claiming that a particular branch of science is not valid because there MIGHT be some as yet unknown factor .... and so on"
Again, i call BS. I am not suggesting that we need to know every single facet, i'm suggesting that we don't even know enough to support YOUR theory yet, let alone any other. As such the null, still stands.
"On the contrary, based on a careful personal assessment of the science, I am pretty confident that it is you who will ultimately be forced to eat humble pie!"
And i DO love pie.
Paul if i'm proven wrong, it doesn't bother me. I'm not going to dig my heels in and pout, but i am confident that the evidence put forward so far is incomplete, does not fully support what the experts are saying and further, there are large, very real logic gaps in the whole edifice.
Now, these gaps may yet get filled and then, great, i'll 'switch' sides. But as it is i cannot support a theory that is, at presnet, so fundamentally flawed. Regardless of what you may think of me (made worse no doubt by disagreeing with you over this) i am a very experienced scientist. This level of 'rigour' is required of me in my work, so i expect it of others. That may be unfair, but i certainly have never had any of the issues climate science has had.
"I think 15 years was the period carefully selected by deniers to ensure that the statistical significance test would just fail"
Source? I was under the impression it was 10, then 13 and now 15 years. the posts being moved every time the limit was reached.
"As for the rest of your post, you're just showing your true colours"
no, i'm expecting rigour and honesty of scientists. I thought that was pretty straightforward. Inte
Complain about this comment (Comment number 76)
Comment number 77.
At 08:39 13th Jan 2012, ukpahonta wrote:Not passing comment on the resolution of regional long range forecasts but it seems that the Ski industry has been thrown a life line.
'Shortly after 7am on December 16, the pisteur charged with measuring the snowfall at the permanent weather station just above Courchevel 1850 shook his head in astonishment. Then he crouched down on the edge of the piste to check and recheck the figures.
It couldn’t be true, but it was. In just 10 pre-Christmas days more snow had fallen in the Trois Vallées than during the whole of last season.'
https://www.telegraph.co.uk/travel/snowandski/9006670/Skiing-Is-this-the-best-ski-season-ever.html
Complain about this comment (Comment number 77)
Comment number 78.
At 12:00 13th Jan 2012, Paul Briscoe wrote:LabMunkey @ #76
I'm increasingly coming to agree with jkiller56's recent comments on Paul Hudson's blog.
You may well be a very competent lab based scientist, but it is absolutely apparent from your comments over many threads that you either:
Don't understand how the scientific method works with respect to cutting edge scientific research and are unable to properly evaluate a large body of scientific evidence.
or:
Have suspended normal scientific rigour when considering climate science.
"Incorrect. You're taking the position that we need to fully understand every aspect of the ensemble, to then be able to critique it. This is clearly and demonstratably false."
No LabMunkey. It is only someone who is working in the field full time who is ever going to be aware of all the details and caveats that are necessary to make a proper evaluation of the evidence. For my part, I specialised in biology and chemistry, so although I have a good grasp of basic science, I can't hope to understand all of the complex physics. All scientists specialise in this way and when it comes to science outside our area of expertise, we have to bear in mind that there will be details we don't know which might cause us to draw the wrong conclusions. So, sorry, but it's you who are incorrect!
Every truly objective and sceptical scientist I have ever known has based their conclusions on the FULL BODY OF EVIDENCE. In the case of AGW, this is not only the huge amount of evidence in favour of anthropogenic emissions. It is also based on the fact that no other mechanism that has been proposed is consistent with observations. It is this latter point that is so conspicuously lacking from your arguments.
Yes, there are still some uncertainties in AGW science (although you grossly overstate them). However, in the absence of any other viable explanation, there is no escaping the fact that AGW is far and away the most probable explanation for observations. This is why the consensus is so strong.
Your posts simply highlight and amplify the uncertainties without ever acknowledging the huge amount that IS known and the lack of viable alternative explanations. This is the dead giveaway to your total lack of objectivity and it is why I simply can't take your claimed scientific credentials seriously.
I'm busy now, but I'll try to address the rest of your post later.
Paul
Complain about this comment (Comment number 78)
Comment number 79.
At 13:15 13th Jan 2012, LabMunkey wrote:@ Paul.
Sigh.
Lets try a different tact.
cAGW requires water amplification for c02 to have the effect posited by the IPCC et al.
This requires a net positive feedback from clouds.
The IPCC freely admit they do not understand clouds, how they interact with the climate and even what SIGN their forcing is.
This, is a gaping hole in the theory which is papered over by the models.
You seem unable to grasp just how tenuous the whole thoery actually is- incidentally, and i feel i have to repeat this again and again as your position is clearly blinding you to this. I am NOT anti- cAGW (though i currently oppose the theory), i'm anti sloppy science.
You may call it unreasonably levels of rigour, but i don't. If the entire theory can be undone by one part, which no one can prove, then the theory is 'unsafe'.
Finally, you REALLY have to stop using your consensus point to back you up, it does YOUR qualifications zero credit. Every single person in the world could think and agree on one thing, and still be 100% wrong.
Take the stomach ulcer revelation for a direct example of a consensu being wrong (and further, fudging work and paper reviews to maintain the consensus).
You accuse me of being blinkered, yet you are showing EXACTLY the same symptoms you 'detect' in me.
Perhaps we should just agree to disagree, as frankly- you're giving me a headache.
Complain about this comment (Comment number 79)
Comment number 80.
At 13:29 13th Jan 2012, lateintheday wrote:mmm . . .
what was the TOA energy imbalance in 1950. How about the same for 1900, 1850 or 1750 for that matter. Paul, you are simply arguing that the null hypothesis should be that it's CO2 wot dunnit.
The amazing coincidence often overlooked by some, is that all the pre 1950 (ish) warming can be explained by natural and Solar variation, whereas most warming since then has apparently been caused by CO2 - just as its rise in atmospheric concentration started to become 'significant'. Remarkably, the rate of rise is very similar to the earlier 20thC 'natural/solar' rise.
If the uncertainties in AGW theory were smaller than Labmunkey contends, then one might expect the models to have done a better job. That is, unless you consider climate to have strongly non-linear components which render forecasts/projections useless. Of course, if that is the case, then tracing the precise cause of any warming episode would be near to impossible which doesn't help.
There are large inconsistencies in the AGW case alongside some decidedly unique science/maths/ practices. Why did Santer et al only just recently determine that the '17yrs' period was needed? Was it due to a new and fascinating discovery (bear in mind you can see these flat periods on any graph) or was it simply that AGW needs a bit more time to prove itself. Quite obviously, it's the latter and therefore, the paper's raison d'etre was political rather than scientific.
It doesn't help if you can't accept this Paul because believe me, if we took a poll . . . . .
Complain about this comment (Comment number 80)
Comment number 81.
At 13:36 13th Jan 2012, lateintheday wrote:"Perhaps we should just agree to disagree"
No, no, no!
As Harry Hill would say, who knows most about climate science, Labmunkey or Paul Briscoe. There's only one way to find out . . . Fight!!!
I find your arguments both educational and entertaining. Keep up the good work both of you.
Complain about this comment (Comment number 81)
Comment number 82.
At 13:37 13th Jan 2012, LabMunkey wrote:@ Paul re my number 79.
Paul, please ignore my final statement on my post, i was getting frustrated and it was uncalled for. Apologies.
Complain about this comment (Comment number 82)
Comment number 83.
At 13:50 13th Jan 2012, greensand wrote:@59. QuaesoVeritas
QV, I think the start date of 2011.67 "ens_av" is Sept 2011:-
Notes from “Figure 1” in the “Decadal forecast”
https://www.metoffice.gov.uk/research/climate/seasonal-to-decadal/long-range/decadal-fc
“The most recent forecast (thick blue curve with thin blue curves showing range) starts from September 2011. All data are rolling annual mean values. The gap between the black and blue curves arises because the last observed value represents the period November 2010 to October 2011 whereas the first forecast period is September 2011 to August 2012.”
Not that it makes any great difference, but if it is it means that 2012 calendar starts 2012.00 with a forecast of +0.45c (1971-2000) or +0.57c (1961-1990) versus the “4 January 2012 - 2012 is expected to be around 0.48 °C warmer than the long-term (1961-1990)”
https://www.metoffice.gov.uk/news/releases/archive/2011/2012-global-temperature-forecast
That is if I understand you and the anomaly calcs correctly?
If that is the case then the following is the outcome of the first quarter of a year for the Decadal forecast?
Decadal forecast
(1971-2000) (1961-1990) Actual
Sept +0.345C +0.465C +0.367C
Oct +0.354C +0.474C +0.345C
Nov +0.366C +0.486C +0.263C
Still trying to get this clear would appreciate any comments.
Complain about this comment (Comment number 83)
Comment number 84.
At 15:06 13th Jan 2012, Paul Briscoe wrote:LabMunkey and lateintheday
I'm still in the middle of something important, so I'll have to come back on other points as and when I have time. However, I am beginning to get more insight into where you're going wrong.
Both of you have referred to the null hypothesis. The idea that AGW science can be either proven or disproved based on a null hypothesis is a fallacy and shows just how poorly you understand the way science actually works.
It is actually very rare in science for there to be absolute proof of something. Rather, uncertainties tend to gradually diminish until the point where most scientists accept that a particular hypothesis is the only credible explanation - although you may not like it, this position has already been reached in the case of AGW.
A null hypothesis can only be applied to something which can be measured quantitatively and hence tested statistically. For instance, the hypothesis that the Earth has warmed can be tested and it has been shown that the warming trend is statistically significant.
However, the null hypothesis simply CANNOT be applied to the evaluation of multiple independent lines of evidence. Ultimately it falls to each individual scientist to make a personal assessment of the full body of evidence and decide what is the most likely explanation for observations. This is the principle on which the scientific consensus in favour of AGW is based.
Paul
Complain about this comment (Comment number 84)
Comment number 85.
At 15:25 13th Jan 2012, Paul Briscoe wrote:LabMunkey (continued)
As I have a brief "window", I'll quickly deal with this:
"cAGW requires water amplification for c02 to have the effect posited by the IPCC et al.
This requires a net positive feedback from clouds."
Water amplification does NOT require net positive feedback from clouds. Water vapour feedback is UNQUESTIONABLY positive, as can be deduced from very simple physics.
Anything which causes a warming of the atmosphere will by definition increase the amount of water vapour that the atmosphere can hold. This is a totally separate issue from the condensation of water vapour higher in the atmosphere to form clouds.
Cloud feedback is indeed more difficult to determine. However, most scientists clearly doubt that it is strongly negative This appears to be because it would have been impossible for the small forcings caused by Milankovitch cycles to produce such large shifts in global temperature between glacial/interglacial periods without net feedback being strongly positive. There are also other events further back in the fossil record which indicate the same thing.
Paul
Complain about this comment (Comment number 85)
Comment number 86.
At 16:12 13th Jan 2012, QuaesoVeritas wrote:A few weeks ago, a representative of Oxfam was making the statement that there were "poor" people in the world already suffering the effects of "climate chanage".
I asked for evidence, and I have just received what they consider to be such evidence. I haven't had a a chance to look at much of it yet, but the first link they have provided me with points to a piece of propaganda from their own website, showing a picture of women in South Africa, planting crops that survive in COLD weather. The text includes the statement:
"On our land we have planted beetroot, spinach and cabbage, and those plants are just too small and this is because of the weather, which is very cold."
Well, I haven't looked at all of the "evidence" yet, but I hope it is all as convincing ;-)
OK, before anyone else points it out, I do know the difference between "global warming" and "climate change", but it sounds like these people would benefit from a bit of warming.
Complain about this comment (Comment number 86)
Comment number 87.
At 16:55 13th Jan 2012, QuaesoVeritas wrote:On today's edition of the BBC programme about statistics, it was announced that Dr David Whitehouse had won a bet with Dr James Annan, made 4 years ago, that there would be no new record warming record set by 2011, based on HadCRUT3.
There was also an interestign discussion between Whitehouse and Annan.
https://www.bbc.co.uk/programmes/b0196v3z
The programme will eventually available to listen to on iPlayer.
Complain about this comment (Comment number 87)
Comment number 88.
At 17:40 13th Jan 2012, QuaesoVeritas wrote:greensand,
If, as you say, according to the notes on the decadal forecast graph, the figure for 2011.67 equals the anomaly for September 2011, then your figures are correct.
However, I find this slightly puzzling, since 0.67 of a year corresponds to approximately the end of August, or the beginning of September, and I would have thought that the anomaly figure for the month would have been at the end of the month, which indeed, it must be. On the other hand, it may be a convention when using decimals of a year, to assume that 0.67 = September.
As far as the conversion of the 1971-2000 anomaly to 1961-90 is concerned, I based the figure of 0.12c to be added, on the statement in the decadal forecast which says that the warmest year on record was 1998, with a figure of 0.40c and that 2009 was 0.32c, when the figures from the MO data files v 1961-90 are 0.52c and 0.44c (rounded to 2 decimal places). My own conversion figure would have been lower, at about 0.09c.
It is true that the observed monthly figures for September to November are much lower than those in the decadal forecast and are more like the 1971-2000
anomalies than the 1961-90 anomalies.
Clearly if the decadal forecast started in September, even though it was published in December, it was already out of date, which may account for the apparently lower figure forecasted for 2012. Maybe the MO are confusing themselves by using different time bases. Maybe the decadal forecasts and the latest 2012 forecast are based on different model runs, but if so, references to 90% confidence ranges seems superfluous.
Really the presentation of the forecasting attempts by the MO seem almost amateurish to me. If it was me, I would try to stick to consistent base periods and consistency between one forecast and another, particularly when
they have been issued so close together.
Complain about this comment (Comment number 88)
Comment number 89.
At 17:52 13th Jan 2012, Paul Briscoe wrote:LabMunkey (continued)
".......i am a very experienced scientist."
I don't doubt that you are very good at your job, but, with respect, this does not qualify you to be a self-appointed judge of people working in a completely different environment and with completely different priorities (and who report their findings in a completely different way). Nor does it make you good at assessing multiple lines of complex scientific evidence in a field unrelated to your own.
You have doubled up on some points, so I'll specifically address this one:
"You seem unable to grasp just how tenuous the whole thoery actually is- incidentally, and i feel i have to repeat this again and again as your position is clearly blinding you to this. I am NOT anti- cAGW (though i currently oppose the theory), i'm anti sloppy science."
Clearly, most scientists disagree with you....... and NOT simply climate scientists. The problem here is absolutely clear to me now:
You have MANY misconceptions regarding both the science itself and the way that science is conducted in the very different environment of academic research.
What you see as "sloppy science" is in most cases simply scientists having to make compromises in order to make any progress at all. Your very "black and white" approach to science is simply not appropriate nor applicable to climate science and it is causing you to have unrealistic expectations.
You (and lateintheday) also appear unaware that if you were to apply the same scrutiny to pretty well any field of academic research you would find exactly the same imperfections. What matters is that the scientific method is self-correcting. With this in mind, I would ask you to take a listen to the following comments from Eran Segev, President of "Australian Skeptics", on "How to assess evidence beyond your own expertise". I believe that they are pertinent to many of the points you've made above:
https://vicskeptics.wordpress.com/2010/05/14/how-to-asses-evidence-beyond-your-own-expertise/
To be blunt, I think it's time for you to show a little humility in relation to your own expertise and stop arrogantly presuming that it qualifies you to look down your nose at "mere" research scientists. I for one find your attitude deeply offensive. Having experienced both industrial and academic environments, I can say with certainty that research scientists' problems are very different to yours. They DO know what they're doing and if they are convinced by the evidence for AGW, they are likely to be right. My own assessment of%
Complain about this comment (Comment number 89)
Comment number 90.
At 17:57 13th Jan 2012, Paul Briscoe wrote:LabMunkey (continued)
Having experienced both industrial and academic environments, I can say with certainty that research scientists' problems are very different to yours. They DO know what they're doing and if they are convinced by the evidence for AGW, they are likely to be right. My own assessment of the evidence, coupled with the obvious misconceptions of those attacking the science, only reinforces my confidence in the scientific method.
Paul
Complain about this comment (Comment number 90)
Comment number 91.
At 19:30 13th Jan 2012, greensand wrote:@88. QuaesoVeritas
Thanks QV, the other issue that makes me think 0.67 = Sept is the actual chart. If you draw a date line upwards from just before 2012 it enters the “thick blue curve” at +0.35C and leaves at +0.40C both approx. Can't see where the +0.35C approx start value comes from if it is not the first value in the "ens_av" series?
I think this is the “All data are rolling annual mean values” with Sept 0.67 being the first “print” at +0.345C and the +0.40C representing the Sept to August mean of +0.41C?
Care must be taken as I arrived at this by gridding the chart into an excel worksheet and "guesstimating", but seems to make some sort of sense?
The (1961-1990) or (1971-2000) anomaly “game” is a real pain!
Re your observation:- “It is true that the observed monthly figures for September to November are much lower than those in the decadal forecast and are more like the 1971-2000 anomalies than the 1961-90 anomalies.”
It can’t be possible that MO has got lost in the anomaly “game”, can it?
Complain about this comment (Comment number 91)
Comment number 92.
At 20:05 13th Jan 2012, jackcowper wrote:Paul Hudson
When are you going to tell us all about your book?
https://sc25.com/index.php?id=369
Complain about this comment (Comment number 92)
Comment number 93.
At 21:00 13th Jan 2012, Paul Briscoe wrote:lateintheday @ #80
"what was the TOA energy imbalance in 1950. How about the same for 1900, 1850 or 1750 for that matter."
You are, of course, asking questions that climate scientists, through no fault of their own, will never be able to answer without a time machine! The point is that scientists have a good enough grasp of the science to have a fair idea of the likely answers. They also know that the lack of a definitive answer does not in any way change their understanding of recent observations.
"Paul, you are simply arguing that the null hypothesis should be that it's CO2 wot dunnit."
Incorrect! I draw your attention to my comments in post #84. The scientific consensus is based on evidence, observations and the lack of viable alternative explanations.
"The amazing coincidence often overlooked by some, is that all the pre 1950 (ish) warming can be explained by natural and Solar variation, whereas most warming since then has apparently been caused by CO2 - just as its rise in atmospheric concentration started to become 'significant'. Remarkably, the rate of rise is very similar to the earlier 20thC 'natural/solar' rise."
I think the IPCC attributes a small proportion of warming pre-1950 to CO2. Do you have any evidence to suggest that the similar rate of warming is anything other than a coincidence? I thought not!
"If the uncertainties in AGW theory were smaller than Labmunkey contends, then one might expect the models to have done a better job."
The uncertainties ARE smaller than LabMunkey asserts. Meanwhile, the most recent model projections were, I think from around 11 years ago. As we know, such a short period is not sufficient to draw any conclusions regarding the long term rate of warming. It is therefore, by definition, also too early to draw the conclusion that the model projections are wrong.
Paul
Complain about this comment (Comment number 93)
Comment number 94.
At 21:09 13th Jan 2012, Paul Briscoe wrote:lateintheday (continued)
"There are large inconsistencies in the AGW case alongside some decidedly unique science/maths/ practices."
So bloggers assert! As pointed out above, you would find similar examples in pretty well ANY branch of science. However, the scientific method is self-correcting. None of the "unique practices" you are referring to have in any way undermined the science. On the contrary, more recent research indicates that the scientists in question were almost certainly correct.
"Why did Santer et al only just recently determine that the '17yrs' period was needed?"
In most branches of science, such research would not have been necessary, as no truly objective scientist would be looking at such a short time period anyway. However, in a situation where individuals are attacking the science and are selecting unrealistically short time periods in their attempts to claim warming has stopped, it is understandable that the scientific community are keen to respond!
“It doesn't help if you can't accept this Paul because believe me, if we took a poll . . . . .”
I’ll complete this sentence for you, lateintheday. If we took a poll of ill-informed bloggers and pseudo-scientists who have come on line specifically because they have an axe to grind, we would undoubtedly see a great deal of support for your views. However, given your lack of regard for a consensus amongst people who actually know what they’re talking about, I would be surprised indeed if you were to take solace from such a poll!
It may surprise you to know that my first post on this blog was to express my doubts about the green credentials of wind farms. I still have those doubts and agree that the large amounts of money at stake are likeely to lead to questionable tactics, so you have my sympathy on that score. I just hope that you are not subconsciously allowing this to colour your judgement regarding the science of AGW, which is an entirely different matter.
Paul
Complain about this comment (Comment number 94)
Comment number 95.
At 00:52 14th Jan 2012, lateintheday wrote:never a good idea to respond just before bed but . . . .
PB "My own assessment of the evidence, coupled with the obvious misconceptions of those attacking the science, only reinforces my confidence in the scientific method."
Open minded then. That's good to know.
PB "The point is that scientists have a good enough grasp of the science to have a fair idea of the likely answers."
That's half the problem - they already know the 'likely' answers, even before they have the evidence to back it up.
PB "A null hypothesis can only be applied to something which can be measured quantitatively and hence tested statistically. For instance, the hypothesis that the Earth has warmed can be tested and it has been shown that the warming trend is statistically significant."
What!!! This is a mis-direction worthy of any conjurer. Surely the null hypothesis is that the warming is 'natural' (unexplained) until the evidence proves otherwise. Since our best understanding has enabled us to correctly predict diddly-squat so far - I'm not convinced.
PB "I think the IPCC attributes a small proportion of warming pre-1950 to CO2. Do you have any evidence to suggest that the similar rate of warming is anything other than a coincidence? I thought not!"
Do I need any? You're getting your 'null' the wrong way around again.
PB "I just hope that you are not subconsciously allowing this to colour your judgement regarding the science of AGW, which is an entirely different matter.'
There's no subconscious about it Paul. I'm acutely aware of my prejudices thank you.
Complain about this comment (Comment number 95)
Comment number 96.
At 01:41 14th Jan 2012, RobWansbeck wrote:@93, Paul Briscoe
“ I think the IPCC attributes a small proportion of warming pre-1950 to CO2 “
It was this rise that first alerted me to the fact that all was not well in the land of climate science. Someone produced a graph purporting to show temperatures for the previous thousand years. An obvious problem with the graph was that the predominantly natural rise from around 1910 to 1940 dwarfed anything that had happened in the previous thousand years. It seemed extremely likely that the method used to produce the graph had significantly attenuated historic variation. I expected questions to be asked and the methodology investigated to see if this was indeed the case. Instead the next thing I knew was that this highly questionable graphic had become, without question, the poster child of the IPCC.
Worse still, it was left to people outside the climate science community to show that the methodology did indeed attenuate historic variation.
Unfortunately it just went downhill from there. Today we have people who accepted that an event as notable as the Maunder Minimum had no significant effect on global temperatures now claiming that the Sun is responsible for overriding the huge warming influence of CO2.
Rather than persistently telling everyone how wonderful your knowledge of the scientific method is try going through the maths yourself.
Complain about this comment (Comment number 96)
Comment number 97.
At 09:50 14th Jan 2012, Paul Briscoe wrote:lateintheday @ #95
"Open minded then. That's good to know."
As I've pointed out to others, the scientific method has been proven to work time and time again. It has delivered all the technology you use to type and post your comments here. Why should I dismiss it this time simply because it has delivered a conclusion that many find unpalatable? You are also mischaracterising me. I do think for myself in a way that I fear most posters don't.
"Surely the null hypothesis is that the warming is 'natural' (unexplained) until the evidence proves otherwise. Since our best understanding has enabled us to correctly predict diddly-squat so far - I'm not convinced."
I've seen this assertion made on blogs many times, but it IS a fallacy. It's time to set aside political dogma, prejudices and the like and consider this in the dispassionate way that a scientist has to. Also, for one moment, please try to set aside the fact that CO2 increases are anthropogenic as this should not in any way be allowed to cloud the way the science is considered.
The Earth cannot simply warm "naturally". From a scientific viewpoint, the Earth can only warm over an extended period as a result of a forcing, be it solar, CO2 or whatever. Those proposing "natural" forcings are under exactly the same obligation as those proposing CO2 to provide evidence to back up their claims. The job of scientists is then to decide which forcings are (or were) active at a particular point in time. So no, it is definitely NOT correct to say that the null hypothesis is that warming is natural.
The consensus view has grown up over time as a result of multiple lines of evidence. The evidence for "natural" forcings just isn't there and doesn't fit with observations.
"Do I need any? You're getting your 'null' the wrong way around again."
See my comments above. The fact that the rates of warming are not statistically different is irrelevant if one is caused primarily by a solar forcing but the other is not.
Paul
Complain about this comment (Comment number 97)
Comment number 98.
At 10:09 14th Jan 2012, Paul Briscoe wrote:RobWansbeck @ #96
Your views regarding the "hockey stick" are old news and pretty well every new study which looks at data which can be traced back through time shows the same thing. Even the latest data on sea level points to this.
Ultimately though, it comes down to physics and the more recent instrumental data.
"Today we have people who accepted that an event as notable as the Maunder Minimum had no significant effect on global temperatures now claiming that the Sun is responsible for overriding the huge warming influence of CO2."
This is misprepresentation of the facts. If you check the scientific literature, you will find that the effect of the Maunder Minimum has been quantified and is not insignificant. Also, IN THE SHORT TERM, influences such as ENSO, volcanoes and changes in solar activity can easily overcome the gradual warming caused by CO2....... which is precisely why scientists have to look at long term trends.
"Rather than persistently telling everyone how wonderful your knowledge of the scientific method is try going through the maths yourself."
This too is a mischaracterisation. I merely point out that the scientific method works and is self-correcting. As for the maths, if you apply it correctly (ie. considering the full body of evidence) you get a very different picture to the one you're suggesting.
Paul
Complain about this comment (Comment number 98)
Comment number 99.
At 17:33 14th Jan 2012, Kelvdfv wrote:I added up all the CET December daily maximums for 1900 just to get an index.
I did the same for 2010. The total for 2010 was 90% of that for 1900.
I then did the same for the minimums and 2010 was only 62% of the 1900 total.
It's nice to know that under similar mild Decembers, and despite the much greater CO2 in central England today the difference between the maximums and minimums could be so much greater now.
Complain about this comment (Comment number 99)
Comment number 100.
At 20:16 14th Jan 2012, newdwr54 wrote:99. Kelvdfv:
And what do you think you have achieved by doing this?
I don't know why you picked 1900. You could well have picked 1934, 1974, 1852, 1733, 1710, 1988, 1828, 1843, 1857 or 1898: for those, in order 1-10, are the ten warmest Decembers in the CET record.
If you use only CET and only December as a proxy for global trends then you would conclude, using a 30-year trend (the WMO 'classic period') that the world is cooling at a rate of -6.0 C/century.
The questions are:
i) Does the trend observed in the December CET record accurately reflect the trend observed in the annual global figures?
ii) Does the trend observed in the December CET even reflect the trend observed in the CET annual figures?
Complain about this comment (Comment number 100)
Page 1 of 2