
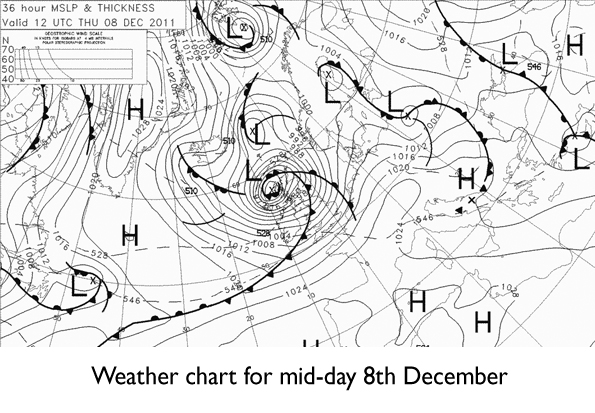
Winter storm set to batter Britain
Much of the UK looks set to be battered by severe gales through tomorrow, as an area of low pressure in the Atlantic undergoes explosive development in the next 24 hours.
At 6am this morning, the central pressure of the area of low pressure heading our way was 1006mb; by tomorrow afternoon it's expected to have deepened to 955mb - a huge drop in central pressure of around 50mb.
The weather chart for tomorrow can be seen below, with the area of low pressure just off the west coast of Scotland.
Off the Yorkshire coast, mean wind speeds are likely to reach Storm force 10 on the Beaufort scale, with violent storm force 11 expected further north - one category below hurricane force 12, giving an indication of the severity of the storm.
In terms of wind speeds over land, here in Yorkshire, gusts around 70mph are likely in a number of more exposed locations tomorrow afternoon & evening, with a broad area roughly from the Midlands northwards into Lincolnshire experiencing potential gusts around 60mph.
Conditions will be even worse further north; into Northeast England, parts of Cumbria together with central and Southern Scotland, gusts could increase to around 80mph.
Once wind speeds reach around 70mph or more, structural damage is possible, along with travel disruption and the commute later tomorrow could be problematical.
Follow me on twitter @Hudsonweather
 Hello, I’m Paul Hudson, weather presenter and climate correspondent for BBC Look North in Yorkshire and Lincolnshire. I've been interested in the weather and climate for as long as I can remember, and worked as a forecaster with the Met Office for more than ten years locally and at the international unit before joining the BBC in October 2007. Here I divide my time between forecasting and reporting on stories about climate change and its implications for people's everyday lives.
Page 1 of 2
Comment number 1.
At 16:46 7th Dec 2011, E Gouthwaite wrote:Better secure those christmas trees and trimmings then before they are blown away
Complain about this comment (Comment number 1)
Comment number 2.
At 19:14 7th Dec 2011, QuaesoVeritas wrote:Paul, if the wind is going to be as strong as you say in Yorkshre and the NE of Engalnd, why does the red warning area not extend into those areas?
The only areas currently covered by red wind warnings are Strathclyde, Central Tayside and Fife and SW Scotland and Lothian Borders.
In fact, the amber warning area only extends to the northern half of Yorkshire and while technically there is an amber warning for Yorkshire & Humber, Humberside is only covered by a yellow warning, although the map is confusing and it is difficult to decide from the map if that relates to wind or snow.
Personally I find the new warning system a bit confusing and the old system made it more clear, which areas were covered by the warnings.
Sometimes the weather warnings and the weather forecasts don't tell the same story.
Complain about this comment (Comment number 2)
Comment number 3.
At 19:57 7th Dec 2011, Kelvdfv wrote:I lived in The Shetland Isles from 1975 for three years at a radio station providing comms to the oil platforms. it was on top of Scousborough hill. I can remember Marconi who were installing the radio equipment had a caravan for an office on the hill. It was well anchored down by ropes.
One night there was a force 11 gale, and when we went up the hill in the morning all that was left of the caravan was small splinters of wood and other debris scattered all over the hillside.
Complain about this comment (Comment number 3)
Comment number 4.
At 20:18 7th Dec 2011, PingoSan wrote:I overlook a famous closed brewery in Leeds city centre which is now being dismantled. They have lots of detritus all over their old car park, huge piles of metal, bricks, wood, etc. If that stuff isn't secured by tomorrow, it'll be flying around Crown Point, Clarence Dock and all of Hunslet by the evening.
Complain about this comment (Comment number 4)
Comment number 5.
At 08:08 8th Dec 2011, LabMunkey wrote:Paul, i'd be curious to know- is this a 'random' occurance- i.e. weather ( :-) ) or do we often see big storms after large periods of blocking? Or do we not know?
Also- about time the bad (or in my case, good) weather turned up! wind and rain, yeah!
Complain about this comment (Comment number 5)
Comment number 6.
At 10:00 8th Dec 2011, QuaesoVeritas wrote:Does anyone know if any of the "alternative" weather forecasters predicted this storm or general stormy conditions?
Complain about this comment (Comment number 6)
Comment number 7.
At 10:41 8th Dec 2011, newdwr54 wrote:6. QuaesoVeritas:
They all seem to predict stormy conditions about a month in advance every month. When the storms don't materialise we hear nothing more. When they do, we hear 'told you so!'.
On 19th October WeatherAction predicted with 80-85% confidence a four week long period of "exceptionally cold" conditions across Britain and Western Europe starting 27th November, with heavy snowfalls particularly 1st-3rd December.
Their latest newsletter blames a "solar filament" for the non-appearance of the cold and snow; also some (unforeseen!) lunar influences. They have now issued a 'revised' forecast for December 2011, which you can buy from their website....https://twitpic.com/7lvmid
In the next paragraph after admitting his 'miss', WeatherAction's founder urges us to "oppose the church of CO2 delusion (CO2 Global warmists) now meeting in South Africa."
Complain about this comment (Comment number 7)
Comment number 8.
At 12:01 8th Dec 2011, openside50 wrote:While over at the activist Met Office they have given up completely trying to make any long range forecasts - after their 'it will be warmer than usual' fall back position was so roundly abused after three of the coldest winters ever
I have no doubt however that given a couple of mild winters they will be back in the game again forecasting 'it will be warmer than usual'
Complain about this comment (Comment number 8)
Comment number 9.
At 12:08 8th Dec 2011, jazznick wrote:7. newdwr54
At least WeatherAction knew why their forecast went wrong and put it right and learned from the experience. They didn't try any 'cover-up' or fudge.
The MO seldom know why their forecasts constantly underestimate the severity of the weather and hardly ever apologize for their inaccuracies even when they are forecasting just one day ahead !
That the warmers in the shape of 'the team' fail to correct their known dodgy science and do everything they can to cover errors and doubts speaks volumes about them and all who support them.
Complain about this comment (Comment number 9)
Comment number 10.
At 12:40 8th Dec 2011, newdwr54 wrote:9. jazznick:
I was no fan of Met Office long range forecasts either - theirs were equally as unreliable as those of the commercial long-term forecasters.
We can't currently predict weather accurately more than a few days in advance at most - certainly not 6 weeks in advance. People who pretend they can predict such long range weather events are closer to fortune-tellers than forecasters in my view.
Complain about this comment (Comment number 10)
Comment number 11.
At 16:11 8th Dec 2011, millennia wrote:Well for those that don't want to pay here is Piers' take on events, you can judge for yourself:
https://www.weatheraction.com/displayarticle.asp?a=401&c=5
Complain about this comment (Comment number 11)
Comment number 12.
At 17:09 8th Dec 2011, newdwr54 wrote:11. millennia:
From the link:
"Our long range forecast has stood up excellently so far". [Piers Corbyn, 8th December 2011]
From Corbyn's long-range winter 'forecast' given in Madrid, 15th October 2011:
"For the period from 27th November to 28th December we are... about 80 to 85% sure... Britain, West Europe, and probably including Spain will be *exceptionally* cold for that long period. There will be fluctuations within in, but it will be *exceptionally* cold...
"There will be *huge* snowfalls at times, especially around December 2nd, probably 1st-2nd, and 14th-15th, around then...this will basically be driven by Arctic or north-easterly flows."
https://www.youtube.com/watch?v=obLq_klpM1w
This is now the 8th December. The present average CET temperature is slightly above the December average at present. There have been no unusually cold conditions in Britain, West Europe or Spain. Temperatures in Madrid have also been slightly above the December average so far and are forecast to remain so for the next few days at least.
As for snow: there has been no unusually heavy snowfall in any of the regions covered by the forecast to date. Although hilly areas of northern Scotland will get some snow tonight, it is expected to clear by morning. North-east Scotland may also experience some blizzards tonight and tomorrow but most concern is about flooding from rain. "Huge snowfalls" are not forecast across the UK, West Europe or Spain.
The specifically forecast "huge snowfalls" of 1-2 December never materialised, even given the two day delay that Piers blamed on a 'solar filament'.
As for the storm systems flowing from the Arctic or north-east: in fact the current system is coming straight off the Atlantic from the west and flowing eastwards across the UK.
This is what Piers Corbyn describes as his long range forecast standing up "excellently so far". He's claiming a 'hit' for that forecast quoted above.
What do you think?
Complain about this comment (Comment number 12)
Comment number 13.
At 22:33 8th Dec 2011, millennia wrote:I think he doesn't help himself when he changes the forecast then picks the bits out of it that fit. I've got the full Dec forecast issued Nov 30th and there is more snow in it than we've had even accounting for Scotland. It reaffirms mid Dec as a particularly bad wintry blast so keep an eye out. I am seeing GFS struggling with the jet stream position and it does seem to be sending these storms near to us, it would only take one to dive south in a pool of cold air and you'll get all the headlines of cars stuck in snow that Piers will tweet for months.
Having said all that seeing a wind turbine shower fire on the ground below was a sight for sore eyes, I wonder who will want to live near one now? There are many reports of brush and forest fires caused by these when they are in remote locations and now we have a picture of one doing it's stuff. They are industrial units and should be treated as such.
165mph is a nasty breeze, only 8mph off the UK record, so it could be a long winter.
Complain about this comment (Comment number 13)
Comment number 14.
At 01:05 9th Dec 2011, jkiller56 wrote:I find it hard to believe, after all the folly of this autumn's failed predictions, that some of you are still taking Independent forecasters seriously!
Extraordinary claims require extraordinary proof
Established Meteorological science considers that weather can be predicted accurately up to about a week ahead. Beyond that, uncertainties multiply until eventually it becomes little better than guesswork.
Corbyn claims not only to be able to predict the weather accurately at least a month ahead, sometimes almost to the day, but also to use methods seemingly unknown to the rest of science which cannot therefore be verified by others.
These are extraordinary claims by any estimation.
Therefore, it is only reasonable to treat such claims and others like it, with extreme scepticism, if only on the grounds of sheer improbability.
But , so often, an "eagerness to believe" comes first, followed by casting about for anything that bolsters the idea. Such debates will never be resolved and are impervious to reason. Perfectly demonstated by this topic.
In many ways this phenomenon is the most intriguing aspect of much of what appears on this blog. A newcomer will learn little about climate but a great deal about human nature.
Complain about this comment (Comment number 14)
Comment number 15.
At 01:53 9th Dec 2011, newdwr54 wrote:To be fair to Piers Corbyn, it is to his credit that he nails his predictions to the mast. He can't be accused of vagueness - only of being wrong.
Maybe in future he will temper his hubris by acknowledging that he often gets it wrong?
Regarding his followers - they already know what they want to believe. Even if Piers does acknowledge his failings, this acknowledgement will be rejected. Too much investment in 'the faith' has already been made for the followers to withdraw now.
Complain about this comment (Comment number 15)
Comment number 16.
At 08:29 9th Dec 2011, Paul Briscoe wrote:The impression I get is that the biggest single obstacle to accurate long-range forecasts is Man's inability to predict how the jet stream is going to behave. This was certainly the problem that lay behind the Met Office's spectacular failures.
I think it's also worth pointing out the contrast between the likes of Piers (aka Morgan!) Corbyn and the approach the Met Office used. The Met Office used to base their long range forecasts on probabilities - this is, of course, the only way they can express things based on models. I'm sure they were right to stop publicising their long-range forecasts. In simple terms, the uncertainties were just too large for them to be worthwhile.
Paul
Complain about this comment (Comment number 16)
Comment number 17.
At 09:54 9th Dec 2011, Hudsonfan wrote:Thank God for wind-turbines is all I can say! Now they catch fire in high winds and we can all warm our hands on them! More proof that they are in fact, a complete and utter waste of time and money. I wonder if they will set up enquiry after enquiry about new wind farms like they do with new nuclear plants.
Complain about this comment (Comment number 17)
Comment number 18.
At 10:40 9th Dec 2011, Gadgetfiend wrote:How Piers Corbyn can claim forecast success is laughable. He said Nov 27th to Dec 28th there would be exceptional cold with huge snowfalls the the UK, with the cold reaching into Spain. Look at his utube forecast and he says the only uncertainty is whether december will be slightly colder or slightly less cold than last December, and he was 80% certain.
He is now saying that his forecast has now been proved to be correct because we have had some snow in December. Anyone in the street could have forecast the risk of some snow in December!
How can anyone possibly take him seriously?
Complain about this comment (Comment number 18)
Comment number 19.
At 12:38 9th Dec 2011, Spanglerboy wrote:"Snowfalls are now just a thing of the past" Charles Onians in the Independent 20 March 2000
"Snowfalls are a thing of the present" Spanglerboy in South Yorkshire 9 December 2011
Complain about this comment (Comment number 19)
Comment number 20.
At 13:28 9th Dec 2011, QuaesoVeritas wrote:There is now an explanation for the late availability of UAH figures on Roy Spencer's web site.
https://www.drroyspencer.com/
Complain about this comment (Comment number 20)
Comment number 21.
At 15:56 9th Dec 2011, john_cogger wrote:@20 QuaesoVeritas
Joe Bastardi suggests the delay is curious...almost as curious as his predictions for arctic ice extent and global temperature!
Complain about this comment (Comment number 21)
Comment number 22.
At 17:09 9th Dec 2011, lateintheday wrote:I'm aware that JB missed the min sea ice by a country mile, but what had he predicted for global temps? I used to enjoy his forecasts at Accuweather but I've not seen much of him since he joined Weatherbell. Does he still do UK winter weather forecasts?
As most people above have posted, predicting anything beyond a few weeks is fraught with danger to ones reputation unless of course, the prediction is so far into the future that we'll all be dead before it comes to pass. I'll remind you though, that JB did call the returning La Nina in or around February this year when others (such as Hansen) were predicting an El Nino.
Complain about this comment (Comment number 22)
Comment number 23.
At 17:44 9th Dec 2011, Spanglerboy wrote:Just read Booker's report on the BBC. Does not paint a very good picture Paul. Looks like you work for a propaganda outfit
the report can be accessed via Bishop Hill's site
https://www.bishop-hill.net/blog/2011/12/8/booker-report.html
it is a 70 page report but well worth the read as it sets out not only the disgraceful part played by the BBC in promoting alarm over AGW but also puts it within the context of what was happening in the world at large and in particular those events that the BBC did not report on
another brick in the wall
Complain about this comment (Comment number 23)
Comment number 24.
At 20:24 9th Dec 2011, Paul Briscoe wrote:Spanglerboy @ #23
I doubt that either Paul Hudson or the BBC will be especially troubled by a report from someone such as Christopher Booker, when the independent review by Professor Steve Jones found exactly the opposite:
https://www.guardian.co.uk/science/2011/jul/20/bbc-climate-change-science-coverage
Paul
Complain about this comment (Comment number 24)
Comment number 25.
At 20:39 9th Dec 2011, nibor25 wrote:Potential for another "monster storm" next week. How accurate is the GFS usually this far out?
Complain about this comment (Comment number 25)
Comment number 26.
At 23:39 9th Dec 2011, john_cogger wrote:@22 lateintheday
At the start of the year (maybe end 2010) JB made a few comments on the Met Offices predictions. He said the temps would be close to 'normal' (i.e. 0.0 anomaly) rather than the Met offices 0.44 above 'normal'.
There is a sweep stake of guesses on this blog somewhere by Neilhamp. 0.44 is the highest and JB's 0.0ish is the lowest I think. Currently we are sitting at about 0.35ish I think.
Complain about this comment (Comment number 26)
Comment number 27.
At 23:57 9th Dec 2011, john_cogger wrote:@23 Spanglerboy
Is that the same guy who says passive smoking and asbestos are perfectly safe?
Complain about this comment (Comment number 27)
Comment number 28.
At 00:50 10th Dec 2011, QuaesoVeritas wrote:#26. - john_cogger wrote:
"At the start of the year (maybe end 2010) JB made a few comments on the Met Offices predictions. He said the temps would be close to 'normal' (i.e. 0.0 anomaly) rather than the Met offices 0.44 above 'normal'."
I believe that there was some confusion over the base period for UAH at the time and in the end, JB's prediction was +0.2c, but NeilHamp is probably in a better position to confirm.
Complain about this comment (Comment number 28)
Comment number 29.
At 08:44 10th Dec 2011, Sheffield_city wrote:Please tell me what happened to the hockey stick. Global warming by man was based on that algorithm. What else was a statistic presented in such a way to claim an un false truth. I wonder if the same people claiming this run our exam boards, I worked temporarily for Ed Excel and am not surprised what has just come out.
Complain about this comment (Comment number 29)
Comment number 30.
At 08:48 10th Dec 2011, Victor wrote:I'm sorry if this may come across as rather terse but I work outdoors all night and get to see each day come to life. After yet another cloudless, freezing night I'm looking at an almost tip to toe blue sky. As usual at around 8am the sky is being criss crossed with high flying jets spraying tons of tiny particles of Aluminium, Barium and Strontium from horizon to horizon. These don't fade away like condensation trails, they stay in the air for hours and sometimes days.
By 10am these lines in the sky will have thinned out and spread to form a tracing paper haze. By lunch these thinned out lines will have joined together and started to form thicker clouds. (For years this has been the daily pattern )
You can see these on radar and satellite but they never get a mention on the weather forecasts. This tells me that the weather presenters are in on this dangerous experiment. If they weren't they would have commented often on the fact that so many of our blue sky mornings were wiped out this summer by these cloud seeding practices.
I'm looking out of my window right now and watching ten jets all leaving these deadly stripes all the way across a clear blue sky.
Don't ask me to send pictures when all you need to do is look out of your window.
When will you tell us the truth that the weather is being played with.
Complain about this comment (Comment number 30)
Comment number 31.
At 09:20 10th Dec 2011, newdwr54 wrote:30. Victor:
Stratus and cumuluous clouds, those that reflect sunlight and can cool the climate, form below 10,000 ft. Commercial airlines fly at around 35,000 ft. I don't see how we can blame commercial airlines for seeding low altitude clouds.
Contrails are a type of cirrus cloud. They are very thin and allow most sunlight through; though it is thought that they are efficient blockers of IR and may contribute a net warming effect on climate.
Complain about this comment (Comment number 31)
Comment number 32.
At 09:27 10th Dec 2011, Spanglerboy wrote:John Cogger 26
strawman/ad hom. nil points
Paul Briscoe 24
obviously cant be arsed to read the report. if you did you would discover something interesting that makes your comment come across as inane. I wonder what that could be? mmmmm 'Professor Steve Jones' and 'independent review' in the same sentence.
For those of you with open minds please do not be put off by the defenders of the faith whose policies will ensure that what is left of the British economy is relocated to China and India, that the cost of energy will rise inexorably leading to more and more of our citizens dying from the cold and Britain becoming a third world country in the lifetime of our children. And of course will have zero impact on the amount of CO2 in the air. If you don't see that as madness then you too are qualified to join the Church of the True Believers in ManMade Global Warming. Read the report and make up your own minds.
Complain about this comment (Comment number 32)
Comment number 33.
At 09:58 10th Dec 2011, newdwr54 wrote:29. Sheffield_city wrote:
"Please tell me what happened to the hockey stick. Global warming by man was based on that algorithm."
The theory of man-made global warming is not based on a graph. It is based on physics.
Complain about this comment (Comment number 33)
Comment number 34.
At 10:24 10th Dec 2011, Spanglerboy wrote:newdwr #33
physics is a science. Science works by taking a hypothesis and trying to DISPROVE it. Man-made global warming works on the basis of assuming CO2 is the cause and trying to PROVE it. Can you see the difference? One is a science the other is pseudo-science. Guess which one you support and why you qualify as a fully paid up member of the Church? And why there is no point trying to engage you. Might as well try to convert the Pope to Islam. Bye
Complain about this comment (Comment number 34)
Comment number 35.
At 10:25 10th Dec 2011, newdwr54 wrote:The BBC is also failing in its coverage of the view that global warming is caused by Leprechaun flatulence. It is failing in three respects:
1. It has betrayed its statutory obligation to be impartial, using the excuse that any dissent from the orthodox view that Leprechauns *don't exist* are insignificant or are made to look ridiculous.
2. It has betrayed the principles of responsible journalism, by allowing its coverage to become so one-sided (all on the side of *no leprechauns*, you'll notice) that it has too often amounted to no more than propaganda!
3. It has betrayed the fundamental principles of science, which relies on unrelenting scepticism towards any theory until it can be shown to provide a comprehensive explanation for the observed evidence. To date, *no one* has shown that Leprechaun flatulence is *not* responsible for global warming. The BBC don't even report this.
Complain about this comment (Comment number 35)
Comment number 36.
At 10:29 10th Dec 2011, Sheffield_city wrote:newdwr54 "The theory of man-made global warming is not based on a graph. It is based on physics." If so they aren't very good physicists, if they believe it is man and not the sun.
Complain about this comment (Comment number 36)
Comment number 37.
At 10:37 10th Dec 2011, newdwr54 wrote:36. Sheffield_city:
Why is it the sun?
Complain about this comment (Comment number 37)
Comment number 38.
At 11:35 10th Dec 2011, Paul Briscoe wrote:Spanglerboy @ #32 & #34
"mmmmm 'Professor Steve Jones' and 'independent review' in the same sentence."
Christopher Booker and the term "unbiased report into climate change" don't exactly go together either, do they?!
Sir Paul Nurse, president of the Royal Society, said:
"The BBC has played a significant part in creating the current surge of interest in science. The way in which it covers science is generally of a very high quality. It is, however, important that the need to separate opinion from evidence in coverage of some topics has been recognised. It is important to have debate, but marginal opinion – prominently expressed but not well based on evidence – can mislead the audience."
Booker's claims presuppose that the views of "sceptics" represent a valid scientific point of view. Yet they are not supported by peer-reviewed literature - ie. they are NOT "well based on evidence".
"Science works by taking a hypothesis and trying to DISPROVE it. Man-made global warming works on the basis of assuming CO2 is the cause and trying to PROVE it. Can you see the difference? One is a science the other is pseudo-science."
No, science is EVIDENCE BASED. You start with a hypothesis and see if the evidence (ie. observations) supports it. In the case of recent warming, AGW is the ONLY explanation available which fits with the observations. Absolute proof is VERY rare in science and your characterisation of the way climate scientists are approaching their work is completely wrong. Why would every major scientific body around the World agree with them if you were correct?
Paul
Complain about this comment (Comment number 38)
Comment number 39.
At 12:27 10th Dec 2011, Spanglerboy wrote:So the Pope's still a catholic. whats new?
Complain about this comment (Comment number 39)
Comment number 40.
At 14:54 10th Dec 2011, Sheffield_city wrote:newdwr54. "Why is it the sun?" The Romans were growing vines over a 1000 years ago in Britain. The during the dark ages, the Thames froze over so they could have fairs on it. After the 2nd world war when manufacturing was at full pelt, we had one of the coldest winters on record. Then in the 1970's when we had one of the warmest summers, they were talking about a mini ice age. The most important thing is to look after the Amazon forest and stop pumping pollutants into the sea, but C02 is natural and nature produces more than we can ever hope to produce. Wrong priorities, a bit like regulation of the banks, too bothered about the detail, rather than the fact that none of the banks had any assets. Global warming by man will come crashing down just like the Euro.
Complain about this comment (Comment number 40)
Comment number 41.
At 17:38 10th Dec 2011, newdwr54 wrote:40. Sheffield_city wrote:
"The Romans were growing vines over a 1000 years ago in Britain."
As far as I know vines have been able to grow in Britain for thousands of years. The grapes (and wine) they produce are pretty disgusting (or have been until recently); but maybe that'll change with the warming climate?
"...C02 is natural and nature produces more than we can ever hope to produce."
That's true. No one is disputing that. What AGW theory says is that the comparatively trifling amount of CO2 produced by humans is just enough to knock nature *over capacity*. Nature can adsorb so much CO2 but no more. In other words, once the sink is full, the water has no option other than to overflow. Our short-circuiting of the natural carbon cycle is effectively the 'hair that broke the camel's back'.
"Global warming by man will come crashing down just like the Euro."
Aren't you conflating abstract economic issues with real world physical impacts?
Complain about this comment (Comment number 41)
Comment number 42.
At 18:08 10th Dec 2011, Spanglerboy wrote:@ Paul Hudson
Paul you will have noticed that the AMO has turned negative. If history is to be repeated this portends a looooonnnngggg cold snap. Better get the thermals out of the closet.
Complain about this comment (Comment number 42)
Comment number 43.
At 18:40 10th Dec 2011, lateintheday wrote:Spanglerboy, yes I see that it has dipped into negative but surely it's too early for the AMO cycle itself to have turned, although it may now be on a general downward trend - (maybe that is what you were saying). We should expect another ten years (or thereabouts) before we feel the effects of the negative phase.
Re 33
Sheffield City
"Please tell me what happened to the hockey stick. Global warming by man was based on that algorithm."
newdwr54
"The theory of man-made global warming is not based on a graph. It is based on physics."
Without the adjective 'abnormal', the warming of the late 20thC would have just been an observation of what was happening naturally to the planet. Something about which we could do very little. The 'abnormal' was presented to the world by the production of the Hockey stick and many people I talk to are still totally oblivious to its shortcomings. I note that the recent Chinese dendro study (Liu) doesn't support the Hockey Stick, but does back up the MWP and the LIA. It also identifies cycles which are (or could be) linked to solar cycle and lunar cycle lengths.
Of course, this study will no doubt be trashed by the consensus, as they continue to publicly support the hockey stick whilst privately, they trash that as well.
Complain about this comment (Comment number 43)
Comment number 44.
At 00:17 11th Dec 2011, jkiller56 wrote:To Spanglerboy and co.
I'm never quite sure why the basically fairly tedious work of climate science and its alarming conclusions has become in any way linked in the minds of certain individuals with desire to destroy economies and sponsor growth in China etc. (All with the aid of the BBC of course - hellbent on destroying free speech and expression. How much better if we were liberated by the likes of Fox News in America and were not reliant on the corrupt standards of the BBC for our information!)
What conceivable motive could there be for doing this?
Whatever the motives of the scientists, I doubt very much that it is to destroy their own societies and make us all pay an awful lot for electricity. Just possibly, they may feel it is their duty to warn the world of potential disaster. They may even feel compassion and concern for the fate of their fellow human beings.
What we choose to do about their warning is entirely another issue. Political action is of no significance to the "truth" of climate science. Railing against green energy, duplicitous political scams or some nebulous concept of "the warmist cause" (what in God's name can that be?) makes no difference to the facts of the issue. These are all human foibles, just as doing nothing at all and perverse denial are too!
Try to rise above the soppy tales of dewy eyed polar bears and confused baby hedgehogs, finger wagging "Friends of the Earth" or ludicrous energy policies. None of this has anything to say about the science - it only represents, rightly or wrongly, reaction to it.
If I might risk a religious analogy:
It is a bit like refusing to believe in God because you don't like the kind of people who go to church!
Scientists may care about the future of mankind. But to be sure, the Earth and its climate is utterly indifferent to it. AGW seems, for all practical purposes to be true. Hurling loud invective toward its messengers may be as futile as throwing pebbles into the ocean to frighten away the tide.
Complain about this comment (Comment number 44)
Comment number 45.
At 03:54 11th Dec 2011, RobWansbeck wrote:When a climate scientist writes “You just shouldn’t grab anything that’s in print and just use it ‘cos it’s there—that just perpetuates rubbish” in private yet endorses this 'rubbish' in public then anyone with an open mind should be asking questions.
Perhaps climate scientists believe that they are perpetuating rubbish for the best of reasons but to people who really are interested in science they are simply, and knowingly, perpetuating rubbish.
Whether or not AGW is an issue is immaterial to the point; scientists should not be perpetuating rubbish.
Until 'consensus' climate science purges itself of this rubbish it is impossible for any objective mind to take them seriously.
Complain about this comment (Comment number 45)
Comment number 46.
At 07:37 11th Dec 2011, Paul Briscoe wrote:RobWansbeck @ #45
As you will have gathered, I don't make a habit of reading private emails that have been STOLEN. This is partly because I'm sure all of us here say things in private that we would never actually act on. Consequently, if you are making veiled accusations against a particular scientist I'm afraid you are going to have to be more specific.
As you will also know from past experience, not all of the emails are being quoted in full or in their true context, leading those who have anything BUT an open mind to completely miss their true meaning!
You also have to remember that scientists, like the rest of us, are human beings and make mistakes and errors of judgement. In other words, even a mistake or a misjudgement is not indicative of impropriety. Nor does it bring into question the entire science of AGW!
Paul
Complain about this comment (Comment number 46)
Comment number 47.
At 09:36 11th Dec 2011, Paul Briscoe wrote:lateintheday @ #43
There are a number of points here.......
First of all, as newdwr54 correctly stated, AGW is about physics rather than the hockey stick:
https://www.youtube.com/watch?v=uHhLcoPT9KM&feature=player_embedded
Second, any number of different paleo-reconstructions by independent research groups have subsequently confirmed the hockey stick shape, fully justifying the IPCC's conclusions in AR4.
Third, even in the absence of the paleo-reconstructions, the fact remains that prior to the 1970's, global temperature tracked changes in solar activity pretty closely............ just as you would expect it to in the absence of other forcings. Since the 1970's global temperatures have risen substantially despite stable or falling solar activity. This, plus all of the "fingerprints" we've discussed in the past, is far more telling than the hockey stick.
Finally, I doubt that scientists will be rushing to "trash" the chinese dendro study you mentioned. Plenty of other paleo-studies have identified substantial regional variations in temperature anomaly over the past millennium, with one or two regions (including parts of China) actually being as warm or warmer in the past. So another study showing the same does not in any way undermine global warming.
Paul
Complain about this comment (Comment number 47)
Comment number 48.
At 09:49 11th Dec 2011, Sheffield_city wrote:newdwr54 "Aren't you conflating abstract economic issues with real world physical impacts?" I am sorry but the same type of academical people get to the top of the pile of economics and science and have no common sense and the rest follow like sheep. Until they take into account the effect of the sun on the planet over 50 years, then all the figures mean nothing. Rather than obsessing over C02, it is time they stopped cutting back the Amazon forest and other such area's. Both the Global warming by man and Euro economics are based on false data. We have seen a FSA regulate banks, but too much attention to detail and no attention to assets of the bank is laughable, then the whole system collapses. The Carbon Management Trust works in the same way as the FSA. I have been inside both organisations and lately in Ex Cedel who mark exams, they are all tarred with the same brush.
Complain about this comment (Comment number 48)
Comment number 49.
At 11:26 11th Dec 2011, newdwr54 wrote:48. Sheffield_city wrote:
"Until they take into account the effect of the sun on the planet over 50 years, then all the figures mean nothing."
You're saying this as though it hadn't occurred to the scientists to check whether changes in solar output might be responsible for the observed warming of the past few decades. The effect of the sun has been fully accounted for.
Just this week yet 'another' peer reviewed paper was published that looked specifically at the contribution of both volcanic and solar forcing on recent climate Huber & Knutti (2011). Among other things they concluded:
"Even for a reconstruction with high variability in total irradiance, solar forcing contributed only about 0.07°C (0.03-0.13°C) to the warming since 1950."
[PDF, but can be accessed via:https://www.skepticalscience.com/huber-and-knutti-quantify-man-made-global-warming.html ]
They concluded overwhelmingly that human greenhouse gas emissions are responsible for most of the warming measured over that period.
Your response to this, I presume, will be to dismiss it as the work of "academical people who have no common sense". Basically, it seems, that anybody who disagrees with your view, such as 97% of scientists working in this field and every national scientific academy on earth, must be flat wrong, because you can't be.
If that's the case then we've reached an impasse.
Complain about this comment (Comment number 49)
Comment number 50.
At 11:44 11th Dec 2011, Sheffield_city wrote:"Basically, it seems, that anybody who disagrees with your view, such as 97% of scientists working in this field and every national scientific academy on earth, must be flat wrong, because you can't be." Where do you get the 97% from, is sounds like spin to me.
It is funny that I left the banking world in 2000 because I thought it was totally dysfunctional, I was classed as mad by some of the management, who wanted to send me off to see a psychologist. It took quite a few years for me to be proofed right and it still isn't then end of that episode. I was shocked but not surprised how many of my ex colleagues had been seriously ill.
5 years ago when I worked in a Carbon Management company, I found out all sorts of very interesting things and stopped believing in Global warming by man any longer. That was the last time we had a decent summer and the temperature of the earth hasn't increased since 1998. Yet I still think the destruction of the rain forests and polluting the world isn't a good thing and should be the No1 priority. Stress is the biggest threat to man and that is unseen.
Finally this last year I have been helping out in the marking of exam papers and couldn't believe some of the things that came to my attention. It appears that Ed Excel make their exam easier than everybody else, so that more people will take their exam. Not very good for employers who are trying to decide who to employ and typical of the type of things that goes off in the world today.
The wrong people get to the top of the pile, those that will say what it takes to get there, not because what they say is necessarily correct.
Complain about this comment (Comment number 50)
Comment number 51.
At 11:59 11th Dec 2011, newdwr54 wrote:42. Spanglerboy wrote:
"...you will have noticed that the AMO has turned negative."
You may have got this information from Watts Up With That? (WUWT) https://wattsupwiththat.com/2011/12/09/the-november-amo-index-goes-negative-first-time-since-1996/.
I see Anthony is at his antics again.
Take a look at the bottom graph. A glance at it shows HadCRUT 3 and AMO index with sharply downward trend lines (Anthony Watts is a bit like Roy Spencer - he only adds linear trend lines to graphs that show cooling). A second glance and you see that the graph actually purports to show these data from "2005 - 2009".
Why did it stop in 2009? First off, it doesn't stop at the end of 2009, it stops in May 2009. Secondly, we have data for both AMO and Hadcrut 3 until November and October 2011 respectively. Watts even links to the current AMO data at the top of the article! So why May 2009??
I suspected a cherry-pick. I downloaded the AMO data and compared it with Hadcrut 3 on a spreadsheet. *Just by coincidence* May 2009 is the point in the 2005-present data at which both the AMO index and Hadcrut 3 data are in their most steeply downward trend.
If you stretch the data out from 2005 to present the lines straighten up considerably. The AMO linear trend is now 6.5 times less steep than it was at May 2009 and Hadcrut 3 is currently 5.4 times less steep. Watts simply stuck a chart up depicting not the latest data, but the data stopped at a point in time at which it appeared to be most negative.
That's just one example of the standard of 'science' you get from "The Best Science Blog 2011".
Complain about this comment (Comment number 51)
Comment number 52.
At 12:34 11th Dec 2011, QuaesoVeritas wrote:There is apparently another spell of very windy weather heading for the UK at the end of next week.
Complain about this comment (Comment number 52)
Comment number 53.
At 12:55 11th Dec 2011, Spanglerboy wrote:Jkiller #44
nicely constructed strawman. I dont care what the intentions of the climate activists is. It is irrelevant. The fact that they are not practicing the scientific method is the key point. And your analogy with religion is very apt. You have to take a leap of faith to believe in the utterings of the CRU cabal. I am not prepared to take that step. If you want to that is fine. But I object strongly to your religion being foisted on the rest of mankind under the guise of science.
Complain about this comment (Comment number 53)
Comment number 54.
At 17:13 11th Dec 2011, Jack Hughes wrote:Meanwhile in Durban they've put the Kool Aid back in the fridge until next year.
They haven't drunk it and they haven't poured it down the sink. Maybe they simply enjoy these conferences?
Complain about this comment (Comment number 54)
Comment number 55.
At 18:40 11th Dec 2011, PingoSan wrote:Wouldn't surprise me at all if Paul started a new topic about the Friday storm possibility. At the moment it's looking like a 1-in-50 year event. Weather enthusiasts are in a quandary with things like this - it excites us, but we also know that there will be danger on life.
Complain about this comment (Comment number 55)
Comment number 56.
At 19:39 11th Dec 2011, RobWansbeck wrote:@50, Sheffield_city wrote:
" Where do you get the 97% from, is sounds like spin to me. “
Me too:
https://fullcomment.nationalpost.com/2010/12/30/lawrence-solomon-75-climate-scientists-think-humans-contribute-to-global-warming/
Complain about this comment (Comment number 56)
Comment number 57.
At 22:06 11th Dec 2011, newdwr54 wrote:50. Sheffield_city wrote:
"Where do you get the 97% from, is sounds like spin to me."
https://en.wikipedia.org/wiki/Scientific_opinion_on_climate_change
Complain about this comment (Comment number 57)
Comment number 58.
At 08:41 12th Dec 2011, lateintheday wrote:newdwr54 at 51
Intentionally or not, that is a total misrepresentation of the WUWT post.
The graph at the the top of the page is from 1950 and the next one below is from 1860. The graph to which you refer is from a quoted Matt Vooro piece. That you should choose to focus on that graph reveals your own own considerable cherry picking skills.
The rest of your snide comment ('antics', old tricks' etc) shows how little attention some people pay to the actual posts at WUWT.
Disappointed.
Complain about this comment (Comment number 58)
Comment number 59.
At 09:32 12th Dec 2011, lateintheday wrote:PB at 47 - thanks for the video link.
The video promotes the idea that AGW is not about the Hockey Stick. Dr Alley explicitly states that it's not about the Hockey Stick - it's about physics. The video ends with a statement along the lines of . . . the Hockey stick has been replicated many times over with different paleo studies, thus supporting the Hockey Stick through the back door.
The message is a garbled piece of propaganda - nothing more. It a verbal sleight of hand which any marketing department would be proud of. That you can't see that is somewhat surprising.
As for the physics - yes, I agree, it should be about the physics. What do the physics say about the role of CO2 ? From what I've read at SoD, the case for CO2 slowing down the rate of energy escape is clear and unambiguous. The actual physical effect, the end result as it were, is not. That's because we still have very little understanding of the true relationship between the various forcings on our climate. As you are aware, these competing forcings cast significant doubt on whether radiative physics alone is capable of describing/determining our future climate.
As I understand it, the primary control knob of annual/decadal atmospheric temps is the oceans. Whilst they continue to remain warm, the atmospheric temps will bounce a little around these (due to other forcings SSTs, Solar, Volcs etc). The case for CO2 controlling the ocean temps by slowing down the rate of oceanic heat escape and thereby promoting a gradual build up of energy is perfectly reasonable. However, since there have been dramatic temp fluctuations in the past which cannot be ascribed to the influence of CO2, the case for a natural cause remains equally viable.
This brings us neatly back to the Hockey stick. Is the late 20thC warming really that abnormal? That depends entirely on whether you agree with the conclusions of the Hockey stick analysis which has largely shaped the science, political and economic arenas since it's publication.
Complain about this comment (Comment number 59)
Comment number 60.
At 09:45 12th Dec 2011, Sheffield_city wrote:RobWansbeck. Thanks for the link https://fullcomment.nationalpost.com/2010/12/30/lawrence-solomon-75-climate-scientists-think-humans-contribute-to-global-warming/ I hope newdwr54 reads.
Complain about this comment (Comment number 60)
Comment number 61.
At 09:50 12th Dec 2011, Paul Briscoe wrote:lateintheday @ #58
I'm afraid that I agree with newdwr54 on this........ and it is indeed, in my experience, part of a pattern. As you say, the original information comes from others rather than Watts himself, but this is often the case and Watts still has a duty to ensure that posts his site carries are not misleading. The final graph is a clear cherry-pick - no self-respecting scientist would try to draw conclusions from such a short period of time....... especially one with an end point that is so clearly not representative of recent trends.
Consider also the first graph and compare it with the actual data at the link. The graph doesn't even begin to describe the detail in the data, including the brief excursion into negative index during the first half of 2009. It is not made clear whether the data has been smoothed or simply plotted incorrectly. Yet the latest SINGLE negative value is shown very clearly as a sharp decline, giving the impression that this is a clear shift, when it could easily be just another brief excursion.
If climate scientists were to draw a graph in such a sloppy and inconsistent manner, WUWT would shoot them down in flames. It is these obvious double standards that I find so disturbing.
Paul
Complain about this comment (Comment number 61)
Comment number 62.
At 10:22 12th Dec 2011, Paul Briscoe wrote:lateintheday @ #59
"The message is a garbled piece of propaganda - nothing more. It a verbal sleight of hand which any marketing department would be proud of. That you can't see that is somewhat surprising."
No! It is a statement of fact. It is those who seek to make the hockey stick the focus who are guilty of propaganda. It wouldn't make any difference even if it were found that medieval times were as warm as today, as we have no definitive data regarding solar and other forcings from back then.
Regarding the rest of your post, you are simply falling back on the usual "spoiling" tactics employed by doubters rather than looking at the full picture in the way that an objective scientist does. Yes, there are indeed uncertainties and these are discussed at length in both IPCC AR4 and in the scientific literature. However, there is also a vast amount of other evidence which, taken together, leads most of the scientific community to one inescapable conclusion. You seem to simply ignore all of this other evidence.
I don't agree with your claims regarding the ability of the oceans to explain recent warming. As explained previously, when it comes to long term trends, physics precludes this possibility and it is also at odds with the observation of a positive energy imbalance at the top of the atmosphere.
Meanwhile, there is plenty of evidence from the fossil record showing that over longer timescales it is solar effects and CO2 which primarily determine global temperature. I note that in a recent post over at WUWT even Christopher Monckton has acknowledged the good correlation between CO2 and temperature over the Phanerozoic.
So scientists are actually pretty certain that the net effect of adding more CO2 to the atmosphere will be a significant rise in global temperature. The precise rate of warming is all that is still in doubt.
Paul
Complain about this comment (Comment number 62)
Comment number 63.
At 11:12 12th Dec 2011, QuaesoVeritas wrote:Returning to the subject of Bias on "climate change" at the BBC, one thing I find particularly annoying is the way in which proponents of "climate change" who may not be scientifically qualified, and BBC staff, are allowed to make unsubstantiated claims, entirely without challenge.
I recently saw the Oxfam "Climate Change Policy Advisor", make the claim that some "poor" people were already suffering the effects of "climate change", when there is absolutely no evidence to support that. If the BBC is unable to challenge such statements, then it should provide a "sceptic" spokesperson to do so.
I also heard a BBC news presenter say that "every year we are getting a little bit warmer", again, totally untrue. It is possible that the news presenter genuinely believed that, because no doubt she had been indoctrinated by BBC policy, but again, someone should be allowed to challenge such statements.
If a news presenter said that economic output was going up every year, it wouldn't be acceptable, so why is it acceptable to make similar claims about temperature?
I suspect it is because the BBC has closed it's ears to any "evidence" which contradicts it's "global warming" policy.
Complain about this comment (Comment number 63)
Comment number 64.
At 11:29 12th Dec 2011, RobWansbeck wrote:Somebody puts up a blog post with clearly marked graphs, notes that the November value of the AMO is negative for the first time since 1996 and then allows readers to comment on the relevance of this.
This is met with ridicule by people who don't appear to have read the post.
A group of prominent climate scientists publish a paper where data has been deliberately deleted and a graph mislabelled.
This is described as a 'typo'.
Double standards?
Complain about this comment (Comment number 64)
Comment number 65.
At 11:59 12th Dec 2011, Sheffield_city wrote:David Bellamy has disappeared off the BBC because he doesn't agree with the Global warming theory. Hopefully he will be reappearing. The BBC have the same biased attitude to the EU.
Complain about this comment (Comment number 65)
Comment number 66.
At 12:20 12th Dec 2011, lateintheday wrote:"No! It is a statement of fact. It is those who seek to make the hockey stick the focus who are guilty of propaganda. It wouldn't make any difference even if it were found that medieval times were as warm as today, as we have no definitive data regarding solar and other forcings from back then."
Paul, I see that we must disagree on this. The whole edifice of AGW is the 'abnormal' part of the warming of the late 20thC. Finding that similar patterns of warming have occurred in the past through entirely natural causes throws the CO2 theory into the 'that's very interesting but not very important' box. Watch your linked video again and you'll see there is actually no science in the presentation other than the radiative properties/wavelengths chart. The fact that they say on the one hand, it's not about the Hockey Stick, and then go on to state that other studies actually support the re-construction shows what a misdirection that particular video is.
You don't agree with the oceans bit? Really? Do you actually think it's possible that the oceans could carry on warming and have no effect on atmospheric temps? Do you think it's possible that if the oceans all cooled by a couple of degrees that this wouldn't affect atmospheric temps? We already see through ENSO just how important the oceans are to annual global temps and to large extent, that's just the SSTs. Clearly, the heat energy of the oceans are a significant driver of atmospheric temps.
How this ocean heat energy has risen over the years is the key question in my mind, and currently the prime candidates are either changes to solar insolation (due to natural cycles or clouds etc) or a reduced cooling capacity due to the so called 'blocking' radiative properties of CO2.
Of course, it could be a bit of both - the reality is that nobody actually knows. What's more, the scientists at the head of the AGW movement have been shown to have more doubts in private than they are prepared to admit in public.
Your inclination to avoid reading/discussing the recent email release does you credit and is a rare (these days) principled standpoint. Unfortunately, it also leaves you open to the criticism that you unfairly weight the arguments of the consensus against those of the skeptics - a re-affirming prejudice of sorts.
Complain about this comment (Comment number 66)
Comment number 67.
At 12:54 12th Dec 2011, lateintheday wrote:"However, there is also a vast amount of other evidence which, taken together, leads most of the scientific community to one inescapable conclusion. You seem to simply ignore all of this other evidence."
I'm not a climate scientist Paul. I've read much more than most lay people have and therefore, now have a slightly better better understanding than I had about three years ago. The world is undoubtedly warmer and there is less sea ice in the Northern Polar region (particularly in summer) than thirty years ago. Many of the studies linked to AGW are consistent with a warming planet but offer no specific CO2 fingerprint.
The closest I've seen to fingerprint evidence is the Harries 2006 (I think) study of changes in measured OLR wavelengths. I've since read that the inherent complexities of that particular study makes any significant conclusions unsupportable. Different instruments, different satellites, different solar conditions and different ENSO conditions etc. Sorry I can't remember the actual title of the study but it is the one often summarised with, "this should effectively end all dispute over the effect of CO2" or similar.
If you've got better evidence than the Harries study then maybe I've just missed it.
Complain about this comment (Comment number 67)
Comment number 68.
At 13:20 12th Dec 2011, newdwr54 wrote:58. lateintheday wrote:
"...that is a total misrepresentation of the WUWT post."
I don't see how that is the case. Watts has responsibility for what he posts on his site.
In a piece highlighting the AMO going negative he starts off with a chart that appears to have been smoothed in some way to give the impression that AMO has not been negative since 1996. It was negative for five full months in 2009. If he smoothed the AMO data in the chart then he should have labelled it accordingly.
Next Watts states "This is the first time the November value has been negative since about 1996". Wrong. Take a look at the NOAA data he links to: https://www.esrl.noaa.gov/psd/data/correlation/amon.us.data. The AMO was negative in November 1999 and again in November 2000.
So Watts starts off with a misleading and badly labelled chart and follows up with a demonstrably false statement. That's before we even get to the end chart I first posted about.
I take your point that the final graph is from a third party, but it still gives a very misleading impression to the casual reader. Watts has already created an impression of collapsing Atlantic ocean temperatures by carefully manipulating data in his first chart then making a false claim about it. He finishes off by inserting a graph that shows plunging AMO and temperature data, even though it is two and a half years out of date!
The AMO trend shown in the graph (Jan 2005-May 2009) is -0.061 per decade; AMO trend from Jan 2005 - present is -0.011 per decade. The temperature trend shown is -0.029 C/decade, compared to the present -0.004 C/decade. If he was even passingly interested in being impartial, Watts should have drawn attention to this in his post.
What I find disappointing is that more people don't seem capable of identifying these blatantly misleading statements and claims. It's not exactly difficult to check up on them, especially when Watts himself provides a link to data that immediately falsifies his own claims.
Complain about this comment (Comment number 68)
Comment number 69.
At 13:37 12th Dec 2011, newdwr54 wrote:60. Sheffield_city:
That National Post article chooses to refer to only one study, Doran and Kendall Zimmerman, 2009. But by the time that article was written the US National Academy of Sciences had already published a much broader study, Anderegg, Prall, Harold, and Schneider, 2010.
This reviewed publication and citation data for 1,372 climate researchers and found that:
"(i) 97–98% of the climate researchers most actively publishing in the field support the tenets of ACC (Anthropogenic Climate Change)...
The National Post article makes no mention of this study.
A more recent study (Farnsworth and Lichter, 2011) found that only 5% of 489 geophysicists and meteorologists disagreed with the idea that human activity is a significant cause of global warming.
Complain about this comment (Comment number 69)
Comment number 70.
At 14:04 12th Dec 2011, newdwr54 wrote:64. RobWansbeck wrote:
"Somebody puts up a blog post with clearly marked graphs, notes that the November value of the AMO is negative for the first time since 1996 and then allows readers to comment on the relevance of this.
This is met with ridicule by people who don't appear to have read the post."
____________________________________
Not only did I read the post, I checked the data it linked to. It's a pity others failed to do so. This is far more than just a 'typo'.
Watts' statement that "This is the first time the November value has been negative since about 1996" is plain *false*. It was negative in both November 2000 and 1999.
The accompanying chart has been 'smoothed' in some way to support the claim about 1996. Far from being 'clearly marked' the graph makes no reference to the fact that it has been altered and indicates that November 1999 and 2000 were *above* zero. Check the data Watts links to (https://www.esrl.noaa.gov/psd/data/correlation/amon.us.data ). AMO for November 1999 was -0.008 and in November 2000 it was -0.015.
Focusing only on November also conceals the fact that the AMO index was negative for 5 continuous months in 2009 (Jan-May), and that far from a "down cycle" starting this preceded one of the top ten warmest continuous 18 month periods on the Hadcrut 3 record (Jul 2009 - Dec 2010).
Complain about this comment (Comment number 70)
Comment number 71.
At 14:28 12th Dec 2011, RobWansbeck wrote:@68, newdwr54 wrote:
“ In a piece highlighting the AMO going negative he starts off with a chart that appears to have been smoothed in some way to give the impression that AMO has not been negative since 1996. It was negative for five full months in 2009. If he smoothed the AMO data in the chart then he should have labelled it accordingly. “
Does the large label 'November AMO STD' not give you a clue?
I must admit that their seems to be some ambiguity over the exact values of the AMO. This may be due to NOAA having changed their methodology or maybe an error caused by the resolution of the graph. If it is really that important to you you can simply ask.
The second graph, again clearly labelled, is just a lift from wiki for background.
I now look forward to your condemnation of the Mann et al (2003) paper purporting to refute Soon & Baliunas.
The Mann et al paper did have a mislabelled graph. It also deleted 40 years of inconvenient data from the graph. In addition it misrepresented S&B's interpretation of climate events and used a data series created from bristlecone pines and de-centred PCA to help make its point.
And then there was the China series etc., etc.
Complain about this comment (Comment number 71)
Comment number 72.
At 14:52 12th Dec 2011, RobWansbeck wrote:@newdwr54,
I have noticed on the WUWT post that some readers have already asked for an explanation of the discrepancy.
I have now also asked; I hope we get an answer ;)
Complain about this comment (Comment number 72)
Comment number 73.
At 16:40 12th Dec 2011, Paul Briscoe wrote:lateintheday (various)
I know you to be thoughtful and it is clear to me that you are reading what you believe to be convincing arguments against AGW. The problem is that most of these arguments are old, long debunked and completely ignore the overall body of scientific evidence.
A key part of a PhD is the literature review. This is undertaken to ensure that the student is familiar with the entire body of scientific evidence relating to the field of study. It is IMPOSSIBLE to draw the correct conclusions regarding a particular set of observations without taking into account ALL of the available evidence. Yet the entire basis of the attack on climate science is cherry-picked individual observations which, taken in isolation, appear to contradict the consensus.
Now regarding ocean warming........ Yes, the oceans can warm the atmosphere IN THE SHORT TERM. The problem is physics. The oceans cannot cause a net warming of the atmosphere without undergoing a net cooling themselves. So for the oceans to be responsible for recent warming, at a time of stable or falling solar activity, the oceans themselves should be observed to cool. Also, warming of the atmosphere by the oceans would lead to a NEGATIVE energy imbalance at the top of the atmosphere. In practice, we have seen atmospheric warming accompanied by warming oceans, indicative of an external forcing, plus a positive energy imbalance.
"The closest I've seen to fingerprint evidence is the Harries 2006 (I think) study of changes in measured OLR wavelengths. I've since read that the inherent complexities of that particular study makes any significant conclusions unsupportable. Different instruments, different satellites, different solar conditions and different ENSO conditions etc. Sorry I can't remember the actual title of the study but it is the one often summarised with, "this should effectively end all dispute over the effect of CO2" or similar."
I believe the paper you are referring to is one by Evans (2006). It and the other papers providing "fingerprint" evidence are linked to in this article:
https://www.skepticalscience.com/10-Indicators-of-a-Human-Fingerprint-on-Climate-Change.html
Obviously, no single paper can provide absolute proof, but when you take all of the above together and then add in the basic physics AND the evidence from the fossil record, it becomes clear that greenhouse warming is consistent with all of the observations. Meanwhile, other proposed mechanisms, including ocean cycles, increasing solar activity and falling cloud cover are inconsistent with many of the above observations. %0
Complain about this comment (Comment number 73)
Comment number 74.
At 16:46 12th Dec 2011, Paul Briscoe wrote:lateintheday (continued)
I should have guessed that my previous post was too long!! It should have finished thus:
Obviously, no single paper can provide absolute proof, but when you take all of the above together and then add in the basic physics AND the evidence from the fossil record, it becomes clear that greenhouse warming is consistent with all of the observations. Meanwhile, other proposed mechanisms, including ocean cycles, increasing solar activity and falling cloud cover are inconsistent with many of the above observations.
The point is that each time you consider a "new" theory or observation, you have to consider it in the light of ALL the above facts rather than in isolation. Once you apply this approach, which is an integral part of real science, it becomes apparent that most of the arguments used against AGW are complete nonsense.
Paul
Complain about this comment (Comment number 74)
Comment number 75.
At 17:06 12th Dec 2011, newdwr54 wrote:71 & 72. RobWansbeck wrote:
My 68 wasn't well put admittedly. Hopefully 70 clarifies things. As you've aknowledged yourself, the November chart shown on WUWT does not reflect the values given in the NOAA data he links to. At least two of the November values have been raised above zero.
Also, by focusing on November Watts avoids drawing attention to the five-month long AMO negative period Jan-May 2009. This did not herald a period of cold AMO temperatures, which is what's being suggested about this single November figure.
My main gripe was actually with the final graph - the one that stops in May 2009, but which is introduced: "The graph below shows the relationship between AMO and GLOBAL [land and marine] TEMPERATURE ANOAMLIES [Hadcrut 3]". The fact that the data in this chart is 2-1/2 years out of date, and that trends in both the AMO and Hadcrut 3 from 2005-present are now virtually level, is not mentioned.
Re Mann et al (2003): as I understand it the final graph has a line showing tree ring data that terminates before the actual period of data for it does. The suggestion is that the authors did this deliberately to 'hide the decline'. Even though the tree ring data was *known* to be wrong (i.e. it did not agree with the instrument record covering the same period), I agree that on the face of it this too is sloppy work and requires an explanation. I'd be interested to look into it more carefully.
Meanwhile, if Anthony Watts explains himself at any point, you'll let us know?
Complain about this comment (Comment number 75)
Comment number 76.
At 17:42 12th Dec 2011, lateintheday wrote:newdwr54 @68
perhaps I owe an apology - you clearly did more than read the main headline.
I'm still not sure why this particular post is of any great interest however since the cycle is known to be some way off going into negative territory. I read the post simply as being a sign that the smoothed AMO peak had passed and that therefore we would expect a downward trend for the next 15 - 20 years or so. This is hardly spectacular news since the negative phase is not expected to begin for 8-10 years.
The previous negative November values you refer to are 0.008 and 0.015 which when rounded are presumably smaller than the instrumental error. So whilst you may be technically correct, I think it perfectly reasonable to refer to 1996. I also strain to see what possible motive he would have for pushing the cool AMO phase. Is the cycle disputed in some way?
Complain about this comment (Comment number 76)
Comment number 77.
At 18:06 12th Dec 2011, Paul Briscoe wrote:newdwr54 @ #75
I think you and I agree on the general "pattern" at WUWT and that in the present article it was the final graph in the WUWT article that was the main concern. My concern regarding the first graph is that it was either plotted wrong or used smoothed data. However, if the latter was the case I would have expected the curve to be smoother and the final single negative value should not have featured anything like so prominently.
Regarding Mann et al (2003) in response to Soon & Baliunas.....
"I agree that on the face of it this too is sloppy work and requires an explanation."
Gavin Schmidt has given what I consider a perfectly reasonable explanation. It appears that the graph Rob is objecting to was also used in a paper by Jones and Mann being prepared at the same time. The emails (0285.txt) clearly show that the data was removed for sound scientific reasons (ie. the divergence problem) and that the intention was to make it very clear in the legend what had been done.
The legend in the Jones and Mann (2004) paper was clear, but it is obvious that the Mann et al (2003) EoS submission was prepared in a rush and that the legend was not corrected. The paper was also submitted to the forums and as such the review process may have been less rigorous, meaning that the mistake was missed.
So, yes, it was sloppy and shouldn't have happened. However, Schmidt utterly rejects the unfortunate assertions that the data was deleted to hide something which might undermine the criticisms of Soon and Baliunas. Indeed, he even made the point that the Briffa data was not important in the context of the paper and could easily have been left out.
Paul
Complain about this comment (Comment number 77)
Comment number 78.
At 18:43 12th Dec 2011, jkiller56 wrote:To Spanglerboy ~53
But Spanglerboy, you have just repeated my point. I agree, it IS irrelevant to the SCIENCE what climate ACTIVISTS do!
Climate "activists" do not speak for climate science, they are only a response ,right or wrong, to it. Therefore their activities should in no way influence your opinion of AGW science.
Thus, I repeat: using economic consequences, misguided energy policy, other environmental issues (can't we be concerned about all of them?) or percieved bias in the media as reasons to reject AGW theory is a pure "red herring". So why do you keep bringing it up?
Complain about this comment (Comment number 78)
Comment number 79.
At 18:52 12th Dec 2011, RobWansbeck wrote:@75, newdwr54 wrote:
“ My main gripe was actually with the final graph - the one that stops in May 2009, but which is introduced: "The graph below shows the relationship between AMO and GLOBAL [land and marine] TEMPERATURE ANOAMLIES [Hadcrut 3]". “
The final graph was taken from a linked article that gives some background information.
I can't understand the problem. In what way do you believe that the article is trying to mislead?
To me it is just pointing-out a vaguely interesting occurrence that gives people the opportunity to discuss the AMO.
Complain about this comment (Comment number 79)
Comment number 80.
At 19:03 12th Dec 2011, jkiller56 wrote:Pingosan#55
Yes, the current storms are indeed spectacular, even exciting.
Interesting that the current violent flow, although westerly, is rather untypically, not very mild (indeed quite cold at times). Such weather often brings unusually warm conditions in winter, but not this time.
An interesting consequence of this is that the west coast of Scotland (usually one of the least snowy parts of the UK) has had some pretty heavy falls of late - according to a relative of mine who lives near Oban. They are normally sheltered from cold snowy north and east winds by the mountains but this year, they have been fully exposed to cold from the north west. We by contrast have been sheltered - a reversal of last year and indeed the usual pattern.
Complain about this comment (Comment number 80)
Comment number 81.
At 21:59 12th Dec 2011, RobWansbeck wrote:@77, Paul Briscoe wrote:
“ The emails (0285.txt) clearly show that the data was removed for sound scientific reasons (ie. the divergence problem) and that the intention was to make it very clear in the legend what had been done. “
It does no such thing. They intended to criticize S&B for considering only the 20th century mean conditions and using climate proxies not capable of resolving 'climate trends of the last few decades'. This gave the team a problem since S&B had noted the 'anomalous modern ring-growth problem' in their paper and as Keith Briffa wrote responding to an early draft:
“ This is, we believe, important because the original phrasing is a large hostage to fortune, given that it seems to criticise (completely rubbish might be a better phrase) all work based on proxies that do not actually resolve the 'climate trends of the last few decades'. As you know, many proxies used by you , us, and others, do not extend over this period of rapid warming ... “
The team edited their response changing 'not capable of resolving climate trends of the last few decades' to 'not capable of resolving decadal-timescale trends' leading to their final version:
“ As it is only the past few decades during which Northern Hemisphere temperatures have exceeded the bounds of natural variability, any analysis (SB03) that considers simply '20th century' mean conditions, or interprets past temperatures using the evidence from proxy indicators not capable of resolving decadal-timescale trends, can provide only very limited insight into whether or not recent warming is anomalous in a long-term and large-scale context. “
This is wrong on several levels. One problem is they state 'As it is only the past few decades during which Northern Hemisphere temperatures have exceeded the bounds of natural variability'.
They have already decided that recent warmth has 'exceeded the bounds of natural variability' which prejudices their analysis. Also they are criticising S&B for not using proxies which the team know do not resolve recent decades due to the 'anomalous modern ring-growth problem'.
They had to 'hide the decline'. This was accomplished by deleting 40 years of data from a series. The 'typo' was to omit relabelling the end date of the data series; it was not to make the viewer aware that 40 years data had been deleted.
S&B had noted the decline in their paper. Hiding the decline would not mislead S&B but it would mislead others.
Complain about this comment (Comment number 81)
Comment number 82.
At 22:07 12th Dec 2011, RobWansbeck wrote:@PB you mention that Gavin stated that they could have left the Briffa paper out. This has puzzled many people and no one seems to know the answer. I have heard grant conditions mentioned but that is only guessing.
Complain about this comment (Comment number 82)
Comment number 83.
At 23:14 12th Dec 2011, Paul Briscoe wrote:RobWansbeck @ #81
You are TOTALLY misrepresenting the reason for the critique of Soon and Baliunas and COMPLETELY ignoring the fact that Briffa et al themselves had OPENLY ACKNOWLEDGED the potential weaknesses in their 1998 paper. You are also misinterpreting the reasons for the changed wording in the final document.
The point was that S&B attempted to claim that recent decades have been cooler than previous periods based on proxy reconstructions which didn't even resolve in recent times.
The problem with the original choice of words was that it appeared to suggest that all proxies which don't resolve in recent decades are unreliable even WRT to earlier times. This is NOT the case and even the USNAS review did not uphold such a view. Consequently, it is ridiculous to suggest that the scientists themselves believed it, let alone that they tried to change the wording simply to hide something they could not possibly have believed anyway.
The change of wording was simply to make it clearer what was actually meant - period!
The key criticism of S&B, as clearly shown in the stolen emails, was that their claim that periods prior to the present were warmer was not supported by the data. This alone was sufficient reason for the paper to have been rejected........ and there is even evidence in the emails that reviewers HAD recommended rejection.
Finally, you fail to mention the actual wording of a key part of email 0285.txt:
"The only exception is Brifffa et al MXD, where the 1856-1940 period is used instead (because it starts to diverge downward about 1940 relative to the NH annual mean record). We also don't show it after 1940. I agree this has to be made very clear in the caption, and Scott should be able to help you guys make sure the caption is accurate.”
You appear to have totally missed the implications of these words - that the data was deleted for sound scientific reasons and that the intention was clearly to be open and honest about it. This makes a complete mockery of your insinuation that this was done for dishonest reasons. Why would Mike Mann have been stressing the importance of highlighting the deletion in the caption if he was trying to hide it?!!
"S&B had noted the decline in their paper. Hiding the decline would not mislead S&B but it would mislead others."
Yet Briffa et al had already highlighted the divergence issue in the original paper AND acknowledged the potential uncertainties.
Your assertions are pure fallacy, Rob!
Paul
Complain about this comment (Comment number 83)
Comment number 84.
At 01:26 13th Dec 2011, RobWansbeck wrote:@83, Paul Briscoe wrote:
“ the data was deleted for sound scientific reasons “
Surely the true scientific way would have been to show all the data and then give the 'sound scientific reasons' for ignoring it.
Problem is there were no 'sound scientific reasons' then and there are still no 'sound scientific reasons' now.
Worse still, S&B were aware of this and wrote:
“ This matter has largely been unresolved, which means that global or Northern Hemisphere-averaged thermometer records of surface temperature cannot be simply attached to reconstructed temperature records of Mann et al, based mainly on tree-ring width, which cannot yet be reliably calibrated, to the latter half of the 20th century. ”
If the team had 'sound scientific reasons' they could have challenged S&B's statement. They didn't.
If you believe that there are 'sound scientific reasons' perhaps you could list them.
(note: in normal science failure to give the desired result is not a 'sound scientific reason' for excluding data.)
You must also be aware that the other team series shown also fail to cover recent decades although they can be improved by mike's nature trick.
You really should take the time to understand the maths behind these reconstructions and the dangers of choosing the worth of a data series by correlation rather than physical characteristics. It really isn't that difficult.
Keith Briffa is aware of the problem and wrote of Mann:
“ He is just as capable of regressing these data again any other “target” series , such as the increasing trend of self-opinionated verbage he has produced over the last few years , and … (better say no more) Keith ”
(though that was referring to the feat of creating a NH reconstruction from some trees in Western US, I'm sure you can guess which ones. They also featured prominently in Mann et al's criticism of S&B)
Complain about this comment (Comment number 84)
Comment number 85.
At 01:58 13th Dec 2011, newdwr54 wrote:77. Paul Briscoe:
Thanks Paul. If Gavin Schmidt is right then it's just sloppy work, which we're all guilty of.
But it's disappointing that these scientists, particularly in a rebuttal, have left themselves open to criticism like this. Why the rush? And I'm still not sure haste is a valid reason to leave out those particular data, to be honest.
Complain about this comment (Comment number 85)
Comment number 86.
At 02:38 13th Dec 2011, newdwr54 wrote:79. RobWansbeck wrote:
"In what way do you believe that the article is trying to mislead?"
For a start, and as you have already accepted (and, as I see, have referred to on WUWT) the first chart is a bizarre interpretation of the NOAA data that are linked to within the text. It simply doesn't show what it 'says on the tin', so to speak. The values depicted on the chart for November 1999 and 2000 are not those published in the NOAA data that are cited as the reference for them.
There may be some valid explanation for this. It might be 'smoothed' in some (unexplained) way. But in any case it allows AW to make the false assertion that November 2011 is the first time since 1996 that the November AMO index has fallen below zero.
That's misleading. It's a distortion of the facts.
The next misleading thing about the article, I would argue, is an omission, rather than a deliberately misleading statement. AW fails to mention the 2009 dip in the AMO index. I know this didn't occur in November, but it lasted for five months (Jan-May). The effect on climate of this lengthy excursion below zero in the AMO was not some runaway cooling. It was a period of intense global warming that lasted for over 18 months.
As for the final chart: I know it comes from a separate article and I have acknowledged this previously. Nevertheless a brief perusal of that chart has the effect of underlining the false view, already planted in the reader's head by the previous distortion, that AMO and temperatures are in some sort of steep decline. That's the interpretation I took, initially. That's why I looked into it in more detail.
You may be right. Perhaps AW is just trying to encourage conversation. Maybe his intention is not to mislead the public on the current state of the AMO and of climate in general. Perhaps I'm reading too much into these distortions and omissions? But they are still distortions and omissions in my view.
Complain about this comment (Comment number 86)
Comment number 87.
At 08:36 13th Dec 2011, LabMunkey wrote:Interesting discussions here.
Quick housekeeping points.
@ Paul # 46.
Firstly, no proof that the emails were stolen.
Secondy, they were not private emails as they were on a work server and fully actionable by FOIA.
Finally, you many say that they were taken out of context, given the second release, which you've just admited that you didn't read, the context makes them even more damning.
You're happy to push a line of argument on the back of WUWT behaviour, but not that of your side. curious.
@ 84Rob.
You're right. If data has been deleted, esecially raw data, it needs to be fully documented- however, this CAN be done in other papers/work- so long as it's referenced.
Complain about this comment (Comment number 87)
Comment number 88.
At 08:39 13th Dec 2011, john_cogger wrote:@65 Sheffield_City
"David Bellamy has disappeared off the BBC because he doesn't agree with the Global warming theory."
David Bellamy disappeared of the TV screens 5-10 years before he aired his views on global warming. Not only are the team (of which the BBC must be a member, along with 97% of climate scientists, The Met Office, all the worlds Met offices, the AGU, NASA, Uncle Tom Cobley,...) part of a marxist communist NWO plot against the land of the free...they are also physic in dropping Mr Bellamy 10 years before he dissented...
Complain about this comment (Comment number 88)
Comment number 89.
At 09:10 13th Dec 2011, lateintheday wrote:newdwr54
as per my comment @76 I still don't see what benefit AW would hope to gain from this. As you point out, dips into negative AMO values which are not contemporaneous with cooler periods actually point to the AMO having little or no effect on global temps. This would in effect, attack a cornerstone of the natural variation lobby.
The only reason I can think of for him trying to mislead, would be to offer some succour to those of us who await the negative phase of the AMO because we expect to see (perhaps mistakenly) another cool internal 'forcing' which, when in sync with the cold PDO phase and a period of lower solar activity, may reveal more clearly the actual values of natural variation.
PB. @73
thanks for the response and link. I'll try to get my head around it.
Complain about this comment (Comment number 89)
Comment number 90.
At 09:10 13th Dec 2011, jazznick wrote:@John Cogger
If you read the wiki entry you have referenced from more fully you will realise that DB made his BBC Blue Peter, anti wind farm, comment in 1996 just 2 years after his last TV series.
Complain about this comment (Comment number 90)
Comment number 91.
At 10:11 13th Dec 2011, john_cogger wrote:@90 jazznick
Thanks for pointing me towards Wiki. It seems he also blames standing against John Major in the 1997 elections as a reason he was abandoned by the BBC. Everyone against him, even Lenny Henry stopped doing impersonations, no doubt due to his views on global warming.
Good to see he supports Homeopathy as well...
Complain about this comment (Comment number 91)
Comment number 92.
At 10:23 13th Dec 2011, john_cogger wrote:@90 jazznick
Also to quote what DB said -
“It was in 1996 that I criticised wind farms while appearing on children's program Blue Peter, and I also had an article published in which I described global warming as poppycock. The truth is, I didn't think wind farms were an effective means of alternative energy, so I said so. Back then, at the BBC you had to toe the line, and I wasn't doing that.
At that point, I was still making loads of TV programs and I was enjoying it greatly.”
He criticised wind farms in 1996, but the poppycock article wasn’t until 2004, 8 years later. His last programs according to the Guardian were in 1994. So his account doesn’t seem to match what he suggests?
Complain about this comment (Comment number 92)
Comment number 93.
At 10:33 13th Dec 2011, Paul Briscoe wrote:newdwr54 @ #85
"And I'm still not sure haste is a valid reason to leave out those particular data, to be honest."
Perhaps you have misunderstood the point I was making. Even in the original paper by Briffa et al (1998), the divergence issue was openly acknowledged and the potential uncertainties discussed. In that original paper, data post 1960 was left out, but this was openly acknowledged in the paper and the reason given (ie. the proxy diverged from temperature for unknown reasons). Others may not LIKE Briffa's judgement on this, but nobody can claim that he was secretive about it, so the suggestions of dishonesty are just plain silly (or worse!).
It appears that during subsequent discussions with other workers, the view was expressed that the divergence actually started rather earlier than 1960, meaning that the data should be left out from 1940 rather than 1960. This is shown clearly in fugure 5 of the Jones and Mann (2004) paper, which stated:
"The various other (smoothed) NH reconstructions shown in the enlargement to Figure 5a have been scaled by linear regression against the smoothed instrumental NH series over the common interval 1856–1980, with the exception of the ‘‘Briffa et al.’’ series, which has been scaled over the shorter 1856–1940 interval owing to a decline in temperature response in the underlying data discussed elsewhere [Briffa et al., 1998a]."
It was basically the same graph which was used in the EoS03 paper, which was prepared at the same time. Sadly, although Mike Mann stressed in his email the importance of making sure the caption correctly reflected this, he then got married and went off on his honeymoon. Whoever was supposed to make the changes in his absence clearly failed to do so.
Paul
Complain about this comment (Comment number 93)
Comment number 94.
At 10:39 13th Dec 2011, RobWansbeck wrote:@87 , LabMunkey wrote:
“ If data has been deleted, esecially raw data, it needs to be fully documented- however, this CAN be done in other papers/work- so long as it's referenced. “
I agree that there are times when referencing is acceptable, even necessary, but in this case the deleted data was a central part of S&B's criticism of Mann et al. The fact that the team chose not only to avoid discussing this criticism but also to hide evidence of it from the viewer must be questioned.
It also means that S&B's criticism, since it was not even mentioned let alone addressed, must still stand.
Complain about this comment (Comment number 94)
Comment number 95.
At 10:42 13th Dec 2011, jazznick wrote:@92 John Cogger
You seem to be combining two different comments (verbal-Blue Peter 1996) and the ('poppycock' article 2004) and choosing the later comment as the reference point for the 10 year 'delay'.
Is this not cherrypoppycocking ?
Complain about this comment (Comment number 95)
Comment number 96.
At 10:48 13th Dec 2011, RobWansbeck wrote:Deleting data for 'unknown reasons' is hardly a 'sound scientific reason'.
This was the whole point of S&B's criticism; if we do not know what caused the divergence we have no idea how often it happened in the past.
The team response completely failed to address this issue. In fact they even took steps to avoid it being brought up.
Complain about this comment (Comment number 96)
Comment number 97.
At 11:33 13th Dec 2011, Paul Briscoe wrote:RobWansbeck @ #84
Surely the true scientific way would have been to show all the data and then give the 'sound scientific reasons' for ignoring it. Problem is there were no 'sound scientific reasons' then and there are still no 'sound scientific reasons' now."
This is purely a matter of opinion. As stated above, yourself and others may not LIKE Briffa's judgement that deleting the divergent data was appropriate, but the fact remains that he was entirely open about it and the reasons why he had done it. Both the original reviewers of the papers in question AND the Climategate reviews (carried out by scientists rather than bloggers!) found no problem with the approach used.
You then quote from the S&B paper. This was just their opinion. However, if you consider things in more detail, it becomes clear that their logic was flawed. S&B relied on the proxy reconstructions to draw the conclusion that earlier times were warmer than today, yet implicit in this conclusion is the assumption that the proxies calibrate correctly with instrumental data. S&B need to make up their mind whether the reconstructions DO accurately reflect actual temperature, in which case any lack of proxy data post 1980 is unimportant (meaning that direct comparison of proxies with post 1980 temperatures is valid) or whether they DON'T, in which case they can't safely draw any conclusion that the past was warmer.
The above inconsistency, coupled with S&B's use of mean 20th century conditions, effectively ignoring the sharp temoerature rise post 1980, is the main reason why S&B was so heavily criticised and why it should never have been published. The Climateaudit assertion is a red herring, as a close reading of the paper quickly reveals.
"If the team had 'sound scientific reasons' they could have challenged S&B's statement. They didn't."
They didn't need to specifically challenge it, as they were able to demonstrate that it was flawed by other means. Meanwhile, the divergence issue was well documented already.
"If you believe that there are 'sound scientific reasons' perhaps you could list them.
(note: in normal science failure to give the desired result is not a 'sound scientific reason' for excluding data.)"
In novel scientific research there are rarely hard and fast rules and it is ultimately down to the reviewers to decide what is acceptable. However, given that we are really discussing a correlation between temperature and proxies, it is hardly unreasonable to end the plot if the relationship suddenly beaks down (and for reasons that are obviousl
Complain about this comment (Comment number 97)
Comment number 98.
At 11:36 13th Dec 2011, Paul Briscoe wrote:RobWansbeck (continued)
One more point........
I note that you haven't addressed the key question - why would Mann have stressed the importance of getting the caption in Figure 1 correct if he was really trying to hide anything? This destroys the entire premise of the Climateaudit attack.
Paul
Complain about this comment (Comment number 98)
Comment number 99.
At 11:53 13th Dec 2011, Paul Briscoe wrote:LabMunkey @ #87
"Firstly, no proof that the emails were stolen."
That's not true. Whether they were leaked internally or hacked, they were still taken illegally, which is why they are the subject of an ongoing police investigation.
"Secondy, they were not private emails as they were on a work server and fully actionable by FOIA."
Let's not play with semantics here. The scientists were expressing private thoughts in many of these emails and there are a number of exclusions in the UK FOIA that might have led to them being excluded from release if an FOI request had been posted. What is far more important, yet ignored by far too many, was the obvious theft. I would also ask you how you would like snippets from your emails, frequently posted out of context, all over the internet?!
"Finally, you many say that they were taken out of context, given the second release, which you've just admited that you didn't read, the context makes them even more damning."
Based on the emails I have seen, I completely disagree with you on this point. Let's leave it at that. On this particular issue, though, RobWansbeck presented an exerpt from email 0285.txt as "evidence" of deliberate dishonesty by the scientists, yet the very next sentence (which he failed to show) made it absolutely clear that this was false. This is the danger of reading too much into email exerpts.
"You're happy to push a line of argument on the back of WUWT behaviour, but not that of your side. curious."
I base my conclusions on evidence rather than assertions. The criticisms of the scientists are based on opinion, innuendo and smear, NOT demonstrable facts.
Paul
Complain about this comment (Comment number 99)
Comment number 100.
At 12:03 13th Dec 2011, Paul Briscoe wrote:RobWansbeck @ #96
"This was the whole point of S&B's criticism; if we do not know what caused the divergence we have no idea how often it happened in the past."
No Rob, the main purpose of S&B was to "prove" that past temperatures were warmer than the present day - this is the way their paper was used by right wing politicians as well. S&B's criticisms of the divergence issue were justified, as openly acknowledged by Briffa himself, so the critique of S&B was defintiely NOT about this issue.
Paul
Complain about this comment (Comment number 100)
Page 1 of 2