
UAH Satellite global temperature update
The latest global temperature for November has finally been released and according to the UAH measure it showed little change from the previous month with an anomaly of +0.123C above the running 30 year mean, shown on the graph below.
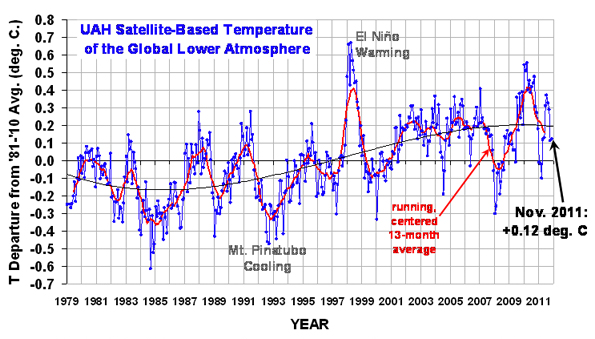
Adjusted to the more standard time period, the anomaly is approximately +0.376C above the 1961-1990 time period used by the Met Office and WMO.
Follow me on twitter @Hudsonweather
 Hello, I’m Paul Hudson, weather presenter and climate correspondent for BBC Look North in Yorkshire and Lincolnshire. I've been interested in the weather and climate for as long as I can remember, and worked as a forecaster with the Met Office for more than ten years locally and at the international unit before joining the BBC in October 2007. Here I divide my time between forecasting and reporting on stories about climate change and its implications for people's everyday lives.
Page 1 of 2
Comment number 1.
At 18:02 16th Dec 2011, newdwr54 wrote:Failing exceptionally cold temperatures in December, 2011 looks like being the 9th warmest year on the UAH record.
2011 was dominated by a 'La Nina' weather system that brings cooler than average conditions globally.
The top 10 warmest years in UAH have all occurred since 1998. As has every monthly and seasonal 'warmest' temperature record.
Currently no annual, monthly, or seasonal cold temperature records occur after 1993 in the UAH data, and the top ten 'coldest' years all occurred before 1997.
Laying aside the thorny issue of attribution, is there still *anyone* who does not agree with the consensus scientific view that this is sound evidence supporting an overall warming pattern in global temperatures?
Complain about this comment (Comment number 1)
Comment number 2.
At 18:38 16th Dec 2011, Spanglerboy wrote:In the 70's the consensus scientific view was that the world was cooling. Now, we are told the consensus scientific view is that the world is warming. The only conclusion to be drawn is not to trust anyone who claims a consensus scientific view. Is there *anyone* that fits the bill?
Complain about this comment (Comment number 2)
Comment number 3.
At 18:39 16th Dec 2011, QuaesoVeritas wrote:#1. - newdwr54 wrote:
"Failing exceptionally cold temperatures in December, 2011 looks like being the 9th warmest year on the UAH record. "
The current AQUA CH5 temperature is currently the lowest since 2002 (limit of available data), and is equivalent to a UAH of about 0.064c, and even if the temperature does not fall further, that points to a final UAH of about -0.015c.
I agree with you however, that the year as a whole is likely to be the 9th warmest on record. However, that is against a background in which temperatures were expected to rise, due to continually increasing CO2 levels.
"Laying aside the thorny issue of attribution, is there still *anyone* who does not agree with the consensus scientific view that this is sound evidence supporting an overall warming pattern in global temperatures?"
Agreeing with the view that temperatures have warmed in the past, is not the same thing as agreeing entirely with the theory of AGW and the theory of "climate change".
All that the evidence in the form of temperature data supports, is that temperatures have risen in the past. However, that isn't really the issue. The major issues *are* attribution and the question of whether the PAST warming is going to continue, at least over the next couple of decades.
When the NASA/GISS monthly data are available, I intend to produce an estimate of the final 2011 temperature figures and the rankings which would result from them.
Complain about this comment (Comment number 3)
Comment number 4.
At 18:55 16th Dec 2011, lateintheday wrote:QV - nicely not said.
Complain about this comment (Comment number 4)
Comment number 5.
At 19:06 16th Dec 2011, Morley-press wrote:QuaesoVeritas wrote: "Agreeing with the view that temperatures have warmed in the past, is not the same thing as agreeing entirely with the theory of AGW and the theory of "climate change"."
Like has been said, man made climate change is our best guess. Since it might be very dangerous for us to ignore the 'posibility' we should be preparing for a warmer climate. Even the countries that have signed up to cut co2 are doing very poorly.
Complain about this comment (Comment number 5)
Comment number 6.
At 20:21 16th Dec 2011, QuaesoVeritas wrote:#5. - Morley-press wrote:
"Like has been said, man made climate change is our best guess. Since it might be very dangerous for us to ignore the 'posibility' we should be preparing for a warmer climate. Even the countries that have signed up to cut co2 are doing very poorly."
If there was no potential cost, either financial or environmental, I would probably agree with you, but how exactly would you propose "preparing for a warmer climate"?
Some of the schemes I have seen suggested, to restore the climate to "normality" are frankly horrifying and could result in unexpected environmental consequences.
If the warming is natural, any attempt to lower temperatures may be futile and if added to any natural cooling, could result in a much colder world, which would be worse than a warming one. In any case, I believe that those zealots who believe that lowering temperatures would somehow return the world to a fictional climate in which there were no weather extremes are sadly misguided.
Don't worry however, that cuts in CO2 have not been as great as promised, since temperatures are currently rising more slowly that predicted based on zero growth in CO2 levels since the year 2000.
Complain about this comment (Comment number 6)
Comment number 7.
At 02:35 17th Dec 2011, NeilHamp wrote:Once again here are our forcasts for 2011
Met Office +0.44
SmokingDeepThroat +0.39
quake +0.36
ukpahonta +0.35
QuaesoVeritas +0.31 (original estimate)
Gadgetfriend +0.30
NeilHamp +0.27
LabMunkey +0.25 (revised)
millinia +0.24
Joe Bastardi +0.2
Ken Sharples +0.18
nibor25 +0.15
We will await QV's estimate of the year to date
Looks like quake and ukpahonta are the likely winners
Complain about this comment (Comment number 7)
Comment number 8.
At 03:07 17th Dec 2011, NeilHamp wrote:Hmm! AMSU-A temperature trends channel 5 dropping like a stone
Complain about this comment (Comment number 8)
Comment number 9.
At 06:48 17th Dec 2011, MangoChutney wrote:@Morley-press #5
picking up from QV
windmills. Setting aside the death they cause to local wildlife and their inefficiency, it stands to reason that a wind farm takes energy out of the air, potentially disrupting wind patterns, which means that areas down wind could receive less wind causing unknown problems - look at what happened ta Kilimanjaro when they cut down the trees. Perhaps a wind farm on the slopes of Kilimanjero would help restore the snow?
There is a Polish study, which I can't lay my hands on at the moment, which shows this is not only feasible, but likely to happen.
So, the cost of "doing something" could be many more Kilimanjaro's or the loss of agricultural land
Sometimes doing nothing is the correct response
Complain about this comment (Comment number 9)
Comment number 10.
At 09:38 17th Dec 2011, newdwr54 wrote:3. QuaesoVeritas; 8.NeilHamp:
Re AQUA CH5 temperatures:
Roy Spencer wrote earlier this month that "channel 5 on the Aqua AMSU instrument has become increasingly noisy in recent years, so we anticipate at some point we will no longer be able to rely on it."
It appears that that point may not be far off. According to Ch 5 September 2011 was only the 9th warmest out of the ten Septembers since 2002, ditto for October 2011. Yet in the final UAH values September 2011 was 4th warmest since 2002, and October 2011 was the coldest. Ch 5 is not currently a reliable indicator of surface temperature. (This may be temporary; it has been suggested that La Nina conditions may bias satellite temperature data overly low).
___________________________
3. QuaesoVeritas wrote:
"....[2011] as a whole is likely to be the 9th warmest on record. However, that is against a background in which temperatures were expected to rise, due to continually increasing CO2 levels."
Who "expected" temperatures to rise? The only firm prediction I saw from any scientist re 2011 came from NASA's Gavin Schmidt, who said it would easily be in the top ten warmest on record. As you've agree, according to UAH he is likely to be right; though we might quibble about the word 'easily'. As of October, 2011 was also 9th warmest year-to-date in the NASA set.
The fact is that 'no one' should expect to see a successive annual rise in temperature with rising CO2. That has never been expected or predicted. The only firm projection is that over periods of sufficient length (currently believed to be from 17-30 years) an accelerating warming 'signal' from increased CO2 should begin to progressively emerge and become clear.
There is a clear warming signal over 30 years from all the global data sets. It is currently +0.17 C/decade (+/- 0.01 C) in *all* of them. This rate is more than twice the rate of warming observed over the 20th century.
Complain about this comment (Comment number 10)
Comment number 11.
At 09:53 17th Dec 2011, newdwr54 wrote:2. Spanglerboy wrote:
"In the 70's the consensus scientific view was that the world was cooling."
There was *not* a scientific consensus in the 1970s that the world was cooling. That is a myth.
A NOAA-backed study (Peterson (2008) - available in PDF off Google) reviewed 68 climate-related papers published between 1965-1979 and found that 62% of these predicted warming against 10% that predicted cooling (28% neutral).
It was the media that picked up and ran with the 'global cooling' ball, not the scientific consensus.
The climate scientists predicting cooling today remain in a minority, though lately this minority has shrunk to far lower than 10%.
Complain about this comment (Comment number 11)
Comment number 12.
At 11:11 17th Dec 2011, QuaesoVeritas wrote:#10. - newdwr54 wrote:
"Roy Spencer wrote earlier this month that "channel 5 on the Aqua AMSU instrument has become increasingly noisy in recent years, so we anticipate at some point we will no longer be able to rely on it.""
Yes "at some point".
Anyway, nobody is "relying on it".
At the moment it is the only available guide to what the daily UAH anomaly might be. Currently the coefficient of correlation between AQUA CH5 and UAH is about 0.8, although it varies from month to month.
"Who "expected" temperatures to rise?"
Most of the IPCC climate models in AR4, including those in the "commitment" scenario, based on ZERO growth in CO2.
"As you've agree, according to UAH he is likely to be right; though we might quibble about the word 'easily'. As of October, 2011 was also 9th warmest year-to-date in the NASA set."
I would argue that 9th cannot be considered to be "easily". I would have thought that to meet this definition, it would have to be in at least the top 5, and ideally top 3. But the term was ambiguous, possibly deliberately so.
I can't remember on which dataset Schmidt's prediction was based (presumably NASA/GISS), but according to some, it may not even be in the top 10.
Complain about this comment (Comment number 12)
Comment number 13.
At 11:14 17th Dec 2011, QuaesoVeritas wrote:#11. - newdwr54 wrote:
"There was *not* a scientific consensus in the 1970s that the world was cooling. That is a myth."
Fast forward 10 or 20 years, and I wonder if the same will be said of warming?
Complain about this comment (Comment number 13)
Comment number 14.
At 11:20 17th Dec 2011, RobWansbeck wrote:@9, MangoChutneyUKOK wrote:
“ windmills. Setting aside the death they cause to local wildlife and their inefficiency, it stands to reason that a wind farm takes energy out of the air, potentially disrupting wind patterns, which means that areas down wind could receive less wind causing unknown problems … “
Here is an impressive example:
https://www.windaction.org/pictures/25251
Complain about this comment (Comment number 14)
Comment number 15.
At 11:23 17th Dec 2011, QuaesoVeritas wrote:#8. -NeilHamp wrote:
"Hmm! AMSU-A temperature trends channel 5 dropping like a stone."
Yes, I keep expecting it to turn upwards but it refuses to do so.
at 251.911k, it hasn't quite reached the lowest figure in the record of 251.871k for January 14, 2008, but it may be only a few days away. Who knows how low it will go in January.
At the moment I estimate it is equivalent to a UAH of 0.06c and even if there are no further falls, the final UAH for December could be -0.03c.
Complain about this comment (Comment number 15)
Comment number 16.
At 12:08 17th Dec 2011, Spanglerboy wrote:the concept of a scientific consensus has the appearance of being a scientific concept but is actually a political construct. It is pure propaganda which is all you would expect from propagandistas. post # 1 is pure propaganga. But then I am sure we all realised that, even the author.
Complain about this comment (Comment number 16)
Comment number 17.
At 12:28 17th Dec 2011, Sheffield_city wrote:The dangerous thing is all the eggs are in one basket. What happens if the world is cooling and food production drops. Gordon Brown said he had broken the boom bust cycle and look what happened. Scientists and business leaders make mistakes, they are only human. Science is only as good as the information put into a computer. Garbage in garbage out.
Complain about this comment (Comment number 17)
Comment number 18.
At 12:33 17th Dec 2011, oldgifford wrote:Hi Guys, await the knock of the police on your door.
https://www.telegraph.co.uk/earth/environment/climatechange/8960701/Climategate-police-raid-home-of-blogger-in-UEA-stolen-emails-probe.html
Complain about this comment (Comment number 18)
Comment number 19.
At 13:10 17th Dec 2011, Lazarus wrote:Spanglerboy wrote:
"the concept of a scientific consensus has the appearance of being a scientific concept but is actually a political construct."
I'm a bit confused by this SB. You seemed to make a previous statement that the scientific consensus in the 70s was for cooling and expected that to be taken seriously but now you are suggesting the whole concept of consensus is flawed when newdwr54 clearly pointed out that your beliefs about the 70s are wrong and the consensus was always for warming. Any comment?
Do you now also accept that the 'cooling in the 70s' idea is a myth now you have been shown some peer reviewed research and can we expect you not to repeat this myth from now on?
Lastly your quoted statement in nonsense any way because scientific consensus has nothing to do with either propaganda or politics. If it were true then it must apply to all scientific consensus. So you apparently believe that the idea of the Earth not being flat is propaganda and politics decided that smoking causes an increased cancer risk - not scientific research.
You do come across as someone with some very odd perspectives on the world.
Complain about this comment (Comment number 19)
Comment number 20.
At 15:04 17th Dec 2011, Spanglerboy wrote:I did not expect my statement about the alarm over cooling in the 70's to be taken any more seriously than the current unjustified hysteria about global warming. Both are simply the crise du jour. In 20 years it will be back to global cooling alarmism.
I stand by my view that post # 1 is a piece of propaganda by one of the many warmist alarmists who seek to preach religion under the guise of science. I am not swallowing it. If others want to, so be it.
Complain about this comment (Comment number 20)
Comment number 21.
At 15:30 17th Dec 2011, Lazarus wrote:Spanglerboy,
But do you accept that there was no scientific consensus for global cooling in the 70s?
If you don't then you should provide strong counter evidence to the research given by newdwr54 if you expect to be taken seriously.
If you do now accept that you were taken in by the myth then you have no logical basis to compare the two.
Complain about this comment (Comment number 21)
Comment number 22.
At 16:02 17th Dec 2011, Spanglerboy wrote:Lazarus
that's the way propaganda works - without logical basis
I think you will get there if you take off the CO2 blinkers
Complain about this comment (Comment number 22)
Comment number 23.
At 16:16 17th Dec 2011, Pkthinks wrote:QuaesoVeritas,
You ask us to acknowledge the long term warming trend, and that is not difficult to agree. Furthermore a warming trend was present long before the anthropogenic rise in CO2 began.
Then you make an interesting switch from trend to ranking warmest years.
I put it to you, deliberately or not you do this to disguise the fact that the decadal warming trend is slowing since 2001from when the projections in the AR4 run. That is important as it is the record from that time that will validate or disprove those projections.
Now a decadal trend is only that and it would need some time to make this trend significant. But, the length of time since the last warmest year (using all records as the test) now 14 years is increasing and the lack of warming (over that time) is slowly becoming more significant at the moment.
It really does not matter how warm it is now compared to the 1950s or the 1850s it is the trend in the 21st century that matters. It can be argued that there are many much more serious problems for humankind and the planet.
So whats your forecast for next year?
Complain about this comment (Comment number 23)
Comment number 24.
At 16:34 17th Dec 2011, Paul Briscoe wrote:Spanglerboy
This video explains how the urban myth of a "consensus" of global cooling in the 1970's developed:
https://www.youtube.com/watch?v=EU_AtHkB4Ms&feature=plcp&context=C3cebe14UDOEgsToPDskKubBFvbRhpSGG-DUk2IS7p
Paul
Complain about this comment (Comment number 24)
Comment number 25.
At 18:04 17th Dec 2011, lateintheday wrote:newdwr54 @10
"There is a clear warming signal over 30 years from all the global data sets. It is currently +0.17 C/decade (+/- 0.01 C) in *all* of them. This rate is more than twice the rate of warming observed over the 20th century.
This made me think of the recent Santer 'at least 17 years are needed' claim. It strikes me that you are comparing a thirty year trend against a century scale trend. Surely, with the flattening over the last 10 years, the early 20thC (30year period) must now show a very similar rise to the latest 30year warming of +0.17 C/decade. Not my speciality as you know, but presumably quite a few thirty year periods since 1900 could be found to show much higher trends than the 20thc average?
Pkthinks - if you click on QVs handle you should get a list of all of his posts and a better understanding of where he's coming from.
Newdwr54 . . . I'm not trying to pick a fight here, but earlier this year I thought we'd agreed that Gavin's prediction was most likely based on NASA GISS since that is where he works.
Complain about this comment (Comment number 25)
Comment number 26.
At 18:34 17th Dec 2011, PingoSan wrote:Any comment on Climategate2, Paul Hudson? Why are you not talking about the absolute despicable trashing of science that is going on?
Climate science is a mess. Michael Mann used one tree in Yamal series to divine temperatures for a millennium. But its OK, because an upside down sediment record agreed with him.
What a mess. You know it's a mess. We know it's a mess. Even the Vested Interests know it's a mess.
The released emails also reveal as much.
That is why TallBloke has been arrested.
Never mind. Plenty of useful idiots to request that this comment is deleted.
Complain about this comment (Comment number 26)
Comment number 27.
At 21:36 17th Dec 2011, greensand wrote:@26. PingoSan
Normally I don't do "the emails" normally only interested in the actual observational data.
But I have this irritation, a sort of nagging, why have we not seen the email that "tipped off" Paul that his post "Whatever happened to global warming? was not appreciated in certain circles?
Maybe someday it will appear in the public domain?
Complain about this comment (Comment number 27)
Comment number 28.
At 22:11 17th Dec 2011, RobWansbeck wrote:@27, greensand see:
Climategate 2009 0248.txt
Michael Mann wrote:
“ extremely disappointing to see something like this appear on BBC. its particularly odd, since climate is usually Richard Black's beat at BBC (and he does a great job). From what I can tell, this guy was formerly a weather person at the Met Office.
We may do something about this on RealClimate, but meanwhile it might be appropriate for the Met Office to have a say about this, I might ask Richard Black what's up here?
mike “
Complain about this comment (Comment number 28)
Comment number 29.
At 22:22 17th Dec 2011, greensand wrote:@28. RobWansbeck
Hi Rob, yup seen all that, but who sent what to our dear Paul?
Who thought it appropriate that our host should be informed that his post was not appreciated?
Complain about this comment (Comment number 29)
Comment number 30.
At 23:15 17th Dec 2011, greensand wrote:1. newdwr54
Eh up dw.
"the 9th warmest year on the UAH record."
Do you think in a 33 year dataset that it is significant?
All the great and good accept that we have warmed but are now in an "hiatus", their words, so the least you would expect is "9th". Anything less I doubt would even be commented upon.
Complain about this comment (Comment number 30)
Comment number 31.
At 23:44 17th Dec 2011, openside50 wrote:These massive rises in temperatures Kyoto and Durban have been trying to avoid?
How much did temperatures rises in the 1st decade of this century?
Looks to me like zero
Complain about this comment (Comment number 31)
Comment number 32.
At 01:04 18th Dec 2011, greensand wrote:@31. openside
There you go again; coming over all logical, you can only expect retribution from the thought police.
Complain about this comment (Comment number 32)
Comment number 33.
At 09:39 18th Dec 2011, Paul Briscoe wrote:Greensand @ #32
I was under the impression that a couple of threads ago we all agreed that the present slow-down is not yet long enough to draw any conclusions - in other words, as pointed out in the peer-reviewed literature, periods of little or no warming, lasting for anything up to 17 years, are an expected part of a long-term warming trend with lots of background noise.
So why are you now reinforcing the "zero" warming meme once again?
You also need to bear in mind that the satellite data shows a positive energy imbalance at the top of the atmosphere, despite the levelling out in surface temperature. You should therefore be asking yourself where all of this extra heat energy is going (remember Trenberth's "missing heat"?). If this TOA energy imbalance continues, physics dictates that it will eventually manifest itself in the surface temperature as well!
Paul
Complain about this comment (Comment number 33)
Comment number 34.
At 09:51 18th Dec 2011, Sheffield_city wrote:Pump out enough propaganda and people believe it. WMD's were exaggerated beyond believe and have never been found.
Complain about this comment (Comment number 34)
Comment number 35.
At 10:25 18th Dec 2011, Spanglerboy wrote:Paul Briscoe # 24
the argument from authority is not science and does not work with me
the argument from the authority of YouTube less so
and in any event you have missed the point. The point is that propaganda needs to be identified for what it is. You True Believers are so full of it you cannot recognise when it comes back at you
Merry Chrimble
Complain about this comment (Comment number 35)
Comment number 36.
At 10:34 18th Dec 2011, Sheffield_city wrote:Spanglerboy. Happy Global cooling.
Complain about this comment (Comment number 36)
Comment number 37.
At 11:31 18th Dec 2011, Paul Briscoe wrote:Spanglerboy @ #35
"the argument from authority is not science and does not work with me"
If peer-reviewed literature is not science, then perhaps you can tell me what is?!
The video I linked to is NOT an argument from authority, as Potholer provides documentary evidence in support of everything he says (which is more than you do). If you doubt his claims, then perhaps you would like to go and check for yourself what the peer-reviewed literature actually says....... but of course that would force you to do some work checking facts for yourself rather than blindly believing what blogs tell you......... and it might cause you the discomfort of having to re-evaluate your own assertions!
Paul
Complain about this comment (Comment number 37)
Comment number 38.
At 11:35 18th Dec 2011, Spanglerboy wrote:Sheffield_City
I appreciate the sentiments but really I wont be happy until Science has been re-instated in the world of climatology. When we have climate scientists searching for truth, following the scientific method, being transparent, publishing data and methods and encouraging reproducibility, complying with the law of the land, eschewing activism and above all speaking out when colleagues fail to attain those high standards then I will be happy.
So a grumpy Christmas for me than
Complain about this comment (Comment number 38)
Comment number 39.
At 11:38 18th Dec 2011, greensand wrote:@33. Paul Briscoe
"So why are you now reinforcing the "zero" warming meme once again?"
Because the "great and good" do! Trenberth and Hansen both agree that it needs explaining, so with respect direct your questions at them.
"If this TOA energy imbalance continues, physics dictates that it will eventually manifest itself in the surface temperature as well!"
You and I don't live at the TOA, so if and when any imbalance does manifest itself where we do live I am sure we will take notice. Until then I will live in the real world and stick with what is happening in the here and now and what has been happening through the whole life of any child under the age of 12.
PS, thanks for making my prediction in 32 come true.
Have fun!
Complain about this comment (Comment number 39)
Comment number 40.
At 11:43 18th Dec 2011, Paul Briscoe wrote:greensand @ #33
You clearly missed the point. The "missing heat" does indeed need to be explained.
The problem was that you were, once again, discussing the present pause in the surface temperature rise as though it somehow disproves AGW. The science simply does not support this view and your apparent determination to make it do so only betrays your own bias!
Paul
Complain about this comment (Comment number 40)
Comment number 41.
At 11:44 18th Dec 2011, Spanglerboy wrote:Paul @ 37
I had not seen your comment when I posted 38. But there you have your answer. That is science. What you support is quasi religious pseudo-science mumbo jumbo alarmism. Until you denounce the behaviour of Team scientists, I will continue to regard you as nothing more than one of the Faithful. And as I have said before there is no point trying to engage True Believers. So good bye.
Complain about this comment (Comment number 41)
Comment number 42.
At 11:52 18th Dec 2011, Sheffield_city wrote:Spanglerboy. We have seen corruption all through society, banking, politicians, education, institutions etc. At some stage things have to change and hopefully the truth will come back to science. But what concerns me is the damage being created by organisations like the Carbon Trust. My biggest concerns are destruction of the rain forests and dangerous pollutants.
Complain about this comment (Comment number 42)
Comment number 43.
At 11:54 18th Dec 2011, greensand wrote:@40. Paul Briscoe
Paul, I cannot "clearly miss the point" becasue all I have done and all the Trenberth and Hansen have done is accept the facts about what is happening in th here and now. You can put forward all sorts of thoughts memes, theories etc but they cannot and do not change the actual facts.
Hansen and Trenberth accept that they have to explain away the present decade+ "hiatus" I do not, all I do is endorse what they say i.e. that it exists.
Check what I have written I have not claimed that what is actually happening is proof of anything other than what it is. The fact is that it is real and now.
It is the "great and good" that say it needs an explanation.
Complain about this comment (Comment number 43)
Comment number 44.
At 12:13 18th Dec 2011, QuaesoVeritas wrote:#23. - Pkthinks wrote:
"I put it to you, deliberately or not you do this to disguise the fact that the decadal warming trend is slowing since 2001from when the projections in the AR4 run. That is important as it is the record from that time that will validate or disprove those projections."
Hello Pkthinks,
Since you don't provide a reference, I am not sure which if my posts you are referring to, but I can't help thinking that you have misinterpreted something I have said, or you are confusing me with someone else.
From your post, if I understand it correctly, I think I agree with everything you say, and as "lateintheday" says, if you check some of my previous posts, I think that you will find that I am on the same side of the argument as you are.
Complain about this comment (Comment number 44)
Comment number 45.
At 12:16 18th Dec 2011, Paul Briscoe wrote:greensand @ #43
You simply haven't addressed the point I made in my last post.
On the one hand you say that we have to accept the word of the "great and good", which in my view we do if they say it in the peer-reviewed literature. Yet when you look back at the context of your other comments, you are clearly suggesting that the "hiatus", as you called it in post #30, somehow casts doubt on AGW. Neither Trenberth nor Hansen would accept this, as you well know!
Paul
Complain about this comment (Comment number 45)
Comment number 46.
At 12:23 18th Dec 2011, Paul Briscoe wrote:Spanglerboy @ #41
"What you support is quasi religious pseudo-science mumbo jumbo alarmism."
No Spanglerboy. I am a scientist, so when it comes to evaluating science I only accept properly conducted scientific research reported in the peer-reviewed literature. This is what gave you the electricity, the computer and the internet which you are using to post your uncorroborated assertions, based on the claims of blogs which clearly have their own pseudo-scientific agenda.
"Until you denounce the behaviour of Team scientists, I will continue to regard you as nothing more than one of the Faithful."
Until you come up with real evidence that counters the findings of the various independent reviews, then the "team", as you call them, have actually done nothing wrong.
Paul
Complain about this comment (Comment number 46)
Comment number 47.
At 12:42 18th Dec 2011, RobWansbeck wrote:@29, greensand wrote:
“ Who thought it appropriate that our host should be informed that his post was not appreciated? “
I had always thought that it was Richard Black but I can't remember where I got that from.
He wrote a post at the time (before climategate):
https://www.bbc.co.uk/blogs/thereporters/richardblack/2009/10/climate_issue.html
Sadly the post features a picture of the 'Hockey Stick' which was so obviously wrong that I couldn't understand how the climate science community couldn't see this. The climategate emails show us that many climate scientists were indeed aware of this but would not say so in public.
Complain about this comment (Comment number 47)
Comment number 48.
At 13:07 18th Dec 2011, Paul Briscoe wrote:RobWansbeck @ #47
"Sadly the post features a picture of the 'Hockey Stick' which was so obviously wrong that I couldn't understand how the climate science community couldn't see this."
I'm afraid you're going to have to enlighten me, Rob, as I can't immediately spot what's wrong with the graph. As far as I can see (without a magnifying glass!) it is a NH reconstruction taken from IPCC TAR WGI.
Paul
Complain about this comment (Comment number 48)
Comment number 49.
At 13:18 18th Dec 2011, Lazarus wrote:Spanglerboy wrote:
"I think you will get there if you take off the CO2 blinkers"
Somehow I don't think I'm the blinkered one since you cannot present any evidence to support your beliefs.
PingoSan wrote:
"That is why TallBloke has been arrested."
He was not arrested - no one was. But no doubt it fits your belief system to convince yourself that he was and unjustly so of course.
Strange how science deniers think that if a scientist comes under investigation they are probably guilty on something and they are certain they are guilty if the investigation finds no evidence to act upon.
Yet when the police investigate the theft of personal correspondence any one they investigate in the course of their inquiries is 'arrested' if it happens to fit their fantasy narrative.
Complain about this comment (Comment number 49)
Comment number 50.
At 13:28 18th Dec 2011, Lazarus wrote:RobWansbeck wrote:
"Sadly the post features a picture of the 'Hockey Stick' which was so obviously wrong that I couldn't understand how the climate science community couldn't see this."
Which Hockey stick?
We have seen a sea level hockey stick, an underwater hockey stick, a South American hockey stick, an Arctic summer temperature hockey stick, a tropical glacier hockey stick, a North American mountain snowpack hockey stick, a glacier length hockey stick, a warming of Atlantic water into the Arctic hockey stick and a Arctic sea ice retreat hockey stick.
Or are you still flogging the 23 year old Mann graph than is supported by all the research above and every single other temperature reconstruction which all show 'hockey stick' when graphed?
Complain about this comment (Comment number 50)
Comment number 51.
At 13:53 18th Dec 2011, newdwr54 wrote:25. lateintheday:
"It strikes me that you are comparing a thirty year trend against a century scale trend."
There was a thirty year 0.17 C/decade trend that peaked in 1945. This is attributed to the increased solar activity seen in the first have of the 20th century.
The recent 30 trend last peaked in 2008 at 0.19 C/decade. This is not explained by solar activity.
Re Schmidt's prediction: yes I agree that he is referring to NASA, but they only had temps up to October published last time I checked.
My point in using this example was that no one was predicting that 2011 would necessarily be warmer than 2010 just because of increased CO2 concentrations. There will always be 'noise' in the system.
Complain about this comment (Comment number 51)
Comment number 52.
At 15:43 18th Dec 2011, lateintheday wrote:thanks for the neutral (these are the numbers)confirmation of the early 20thC rise newdwr54. I agree, no one in their right mind should expect 2011 to be warmer than 2010 based on CO2 concentrations alone - even I would admit that to be a ridiculous premise.
Those of us who believe in the entirely (or mostly) natural warming of the late 20thC are soon to have our own beliefs tested. The cold PDO and reduced solar cycle may well have masked or attenuated AGW (if it exists) over the last ten years or so. We shall see.
If we get another step jump in temps whilst these conditions persist, then I for one, will find it difficult to hold onto my 'natural' warming position. I note that OHC has not increased since 2003 and one might have expected a rise due to the cold PDO.
Is this significant historically? Were the flatter periods that Santer refers to always/sometimes/never associated with a rise in OHC?
Complain about this comment (Comment number 52)
Comment number 53.
At 16:18 18th Dec 2011, newdwr54 wrote:23. Pkthinks:
I think this comment was addressed at my post rather than QV's?
I've never tried to deny the fact that the decadal trend in global temperatures has levelled off. What I've tried to get across is that the decadal trend is always going to have too much noise within it to draw any firm conclusions from it. The WMO recommends a 30 year period, and this is the period over which most of the surface data providers base their anomaly reference temperature. Recently some climate scientists have suggested that 17 years is sufficient to discern an AGW signal from temperature records.
Re the IPCC models: yes they are running on the low side but they are very likely still well within 95% of the model runs. RealClimate usually update the models' performance against the surface stn data in January. Here is a link to last years: https://www.realclimate.org/index.php/archives/2011/01/2010-updates-to-model-data-comparisons/
Complain about this comment (Comment number 53)
Comment number 54.
At 17:01 18th Dec 2011, newdwr54 wrote:52. lateintheday:
I've looked at Hsdsst2 vrs hadcrut3 and they appear to be pretty much in lock-step with one another. OHC and global surface temperatures appear to be very closely related. If anything the peaks and troughs in OHC are slightly more pronounced than in surface temps.
For the record, the 30 year trend in hadsst2 is currently +0.14 C/decade.
Complain about this comment (Comment number 54)
Comment number 55.
At 17:14 18th Dec 2011, newdwr54 wrote:30. greensand:
Hi greensand,
["the 9th warmest year on the UAH record."
Do you think in a 33 year dataset that it is significant?]
--------------------------------
No. That in itself is not significant. Of far greater significance is the fact that UAH has no 'coldest' records for month, year or season after 1996.
Also of significance is that *every* 'warmest' record for month, year and season occurs from 1998 onwards, and the top ten warmest years have all occurred since 1998.
Even in a dataset as short as UAH that is remarkable.
I see I have been accused of 'propaganda' (not by you) because I pointed these facts out @ post 1. To the extent that I am trying to influence people's attitudes then I suppose that might be true.
However I have not at any stage consciously posted inaccurate information to support my views. The UAH data is there for anyone to check. No one will ever accuse Roy Spencer of flying a flag for AGW!
Complain about this comment (Comment number 55)
Comment number 56.
At 18:01 18th Dec 2011, greensand wrote:55. newdwr54
Hi DW
'propaganda', you! Heaven forbid! Can’t see it myself:-)
"Also of significance is that *every* 'warmest' record for month, year and season occurs from 1998 onwards, and the top ten warmest years have all occurred since 1998."
"Even in a dataset as short as UAH that is remarkable."
I agree DW! I agree! The period since 1998 is quite remarkable. It is distinctly different to the previous 20 years.
I suppose the reason why you find the last one third of the dataset, the period of least if any warming to be “remarkable” is an attempt to offset any further accusations of ‘propaganda’?
With regard to the “top ten warmest years have all occurred since 1998." After a 20 year warming trend where would you expect the "warmest" years to be, at the beginning or at the end of the dataset?
Anyhow nice to agree, the period since 1998 in the UAH dataset is “remarkable” we just now need to agree on why!
Have fun!
Complain about this comment (Comment number 56)
Comment number 57.
At 20:45 18th Dec 2011, jkiller56 wrote:How appropriate that we are now in one of the high points of the religious calendar, that unadulterated conviction should feature so strongly in many of the above blogs!
Paul Briscoe and co.- try hard as you might, you will never win the scientific arguments you set out so painstakingly (and repeatedly), because most sceptic posts are based on the conviction that AGW cannot be true. NO! NO! NO! It has nothing to do with science.
Any scrap of contrary evidence, however tenuous or dubious is paraded like a talisman - and woe betide scientists who besmirch or fail to see its power. May they burn amid their infernal e.mails.
The fact that anyone could possibly think that AGW is true can only mean one thing -that the world is in the grip of a complex, global conspiracy involving almost all scientists, most politicians, the BBC, the Met Office, IPCC, NASA.etc. All amazingly coordinated (possibly by aliens?)- all hellbent on decieving the entire world for their own ends (whatever could that be I wonder?)!
Alone against all these deluded fools only climate sceptics are aware of what is REALLY going on. The great army of science is out of step - only they are marching in time!
More seriously, I know there are some sceptics who genuinely ask pertinent questions. But if I were them, I would be quite worried about being associated with some of the "conspiracy" lot who come close, in my view, to being deranged. I mean, just READ some of the posts! What sort of a world do they inhabit?
Anyway, happy Xmas, or winter solstice, or whatever. Raise a toast to true belief, or the return of the sun (to influence our weather?!) or to science - whichever you prefer.
Complain about this comment (Comment number 57)
Comment number 58.
At 23:03 18th Dec 2011, Pkthinks wrote:#53, by newdwr54 ,
Yes sorry about that well spotted, and apologies to Quaesoveritas
mix up between #10 and#12 I think
The analysis by realclimate you refer to is deceptive.
As you know the main diagram has that huge gray 95% range because its an ensemble mean of a large collection of models some highly improbable eg one still trending negative after 20 years
Therefore you can draw a flat line from one side to the other and still remain within the 95% range.(so this is not even the 95% range for .2 degrees per decade say) here is the range of the trends in that 'gray zone')
https://www.realclimate.org/images/trends_dist.jpg
Rather too much wriggle room for good science that ie. any answer you want essentially over 20 years
Complain about this comment (Comment number 58)
Comment number 59.
At 00:46 19th Dec 2011, newdwr54 wrote:56. greensand wrote:
"Anyhow nice to agree, the period since 1998 in the UAH dataset is “remarkable” we just now need to agree on why!"
I've striven to avoid that issue in this thread, yet have still managed to get myself called a 'propagandist'!
It's pretty clear that my belief is simply that of the current scientific consensus. I understand that yours is not, and I respect that. The science is *not* settled. It never is.
Complain about this comment (Comment number 59)
Comment number 60.
At 00:49 19th Dec 2011, newdwr54 wrote:57. jkiller56:
Nice one. And season's greetings to you also, fellow alien (shhh...!)
Complain about this comment (Comment number 60)
Comment number 61.
At 01:01 19th Dec 2011, newdwr54 wrote:58. Pkthinks:
The 'wriggle room' as you call it has not just been invented. It was always there, within the models' range.
All models are ultimately wrong on detail, as I expect you'd agree?
But if current surface temperatures are within the projected IPCC range then the projected IPCC range has been *right*, insofar as it goes.
So far they are on the low side; later they may be on the high side. If they are within the range, then they are *right*.
Complain about this comment (Comment number 61)
Comment number 62.
At 10:06 19th Dec 2011, ukpahonta wrote:Good to see that the debate is still ongoing
The persistence of solar activity indicators and the descent of the Sun into Maunder Minimum conditions
https://www.agu.org/pubs/crossref/2011/2011GL049811.shtml
Complain about this comment (Comment number 62)
Comment number 63.
At 10:08 19th Dec 2011, openside50 wrote:Global temp rise 2000-2010 - ZERO
Accelerated sea level rises - NOT DETECTED
Antarctica ice coverage (where 90% of the worlds ice resides) INCREASING
Someone is pulling someone else's leg
Complain about this comment (Comment number 63)
Comment number 64.
At 10:20 19th Dec 2011, QuaesoVeritas wrote:NASA/GISS anomalies for November are now published:
Global = 0.48c, compared to a revised 0.55c last month.
N.H. = 0.56c, compared to a revised 0.86c last month.
S.H. = 0.40c, compared to a revised 0.23c last month.
The above November figures are equivalent to 0.0, 0.496c and 0.263c after adjustment to the HadCRUT3 base period of 1961-90.
There have also been many minor, but mostly positive revisions to past anomaly figures, which I haven't had a chance to evaluate yet, due to the format of the NASA/GISS data file.
Taken together, all of the November anomalies published so far, now point to a small fall in the global HadCRUT3 anomaly, a larger fall in the N.H. anomaly and a small rise in the S.H. anomaly, although the predictions based on HadSST2 suggest that there could be a slight rise in the HadCRUT3 global anomaly.
Complain about this comment (Comment number 64)
Comment number 65.
At 10:48 19th Dec 2011, QuaesoVeritas wrote:#53. - newdwr54 wrote:
"Re the IPCC models: yes they are running on the low side but they are very likely still well within 95% of the model runs. "
As I have pointed out in the past, global temperature, as measured by the 3 year mean HadCRUT3 (adjusted to 1980-99) to 2010, were below the vast majority of the individual model runs in Scenarios A2, A1B and B1, and even 12 of the 16 models in the "commitment" scenario, which assumed a ZERO RISE in CO2 emissions since the year 2000. No doubt when the lower 2011 figure is included, the situation will be worse for the models.
Temperatures may be within the range of 95% of the models, but they still in the lower half of that range, which makes them below the vast majority of those models.
Complain about this comment (Comment number 65)
Comment number 66.
At 10:51 19th Dec 2011, QuaesoVeritas wrote:#61. - newdwr54 wrote:
"So far they are on the low side; later they may be on the high side. If they are within the range, then they are *right*."
By all means go on deluding yourself if you wish.
Complain about this comment (Comment number 66)
Comment number 67.
At 10:54 19th Dec 2011, openside50 wrote:How many of these models pre 2000 predicted zero temperature increase for the following 11 years?
Complain about this comment (Comment number 67)
Comment number 68.
At 17:44 19th Dec 2011, QuaesoVeritas wrote:#67. - openside50 wrote:
"How many of these models pre 2000 predicted zero temperature increase for the following 11 years?"
I haven't done that particular check, and it is a difficult question to answer. I do know, for example that in scenario A1B, that the 3 year means of only 3 of the 21 models are at or below the re-based HadCRU3 3 year mean. Those were:
giss_aom
mpi_echam5
mri_cgm2_3_2a
This does not mean however, that the above show a zero increase, since each model starts at a different point.
The latter model appears to be the "best", over the short-term, since it shows very little increase over the period 2000-2011 and is one of the lowest by 2020. It is also one of the lowest in scenario A2 and in scenario B1, but for some reason, not in the "commitment" scenario.
I believe that model originates from the Meteorological Research Institute in Japan.
It shouldn't be assumed however, that this is the most accurate model overall, since the performance of individual models varies over different time periods and I haven't done a detailed comparison of individual models.
Complain about this comment (Comment number 68)
Comment number 69.
At 18:07 19th Dec 2011, QuaesoVeritas wrote:It turns out that the November HadCRUT3 figures have been published, despite the fact that the "Most recent month" page still showed October, although it has been changed now. A bit earlier than recently, possibly they are keen on finishing early for Christmas, which has caught me a bit by surprise! Anyway, the figures are:
Global = 0.263c
N.H. = 0.323c
S.H. = 0.203c
I haven't had a chance to fully digest these figures, but they are much lower than I had expected from the HadSST2 figures (does that suggest a rapid fall in land temperatures?), and while the Global and S.H. figures are within the limits of my predictions using HadSST2, the N.H. figure is actually outside my lower limit.
Having said that, the changes are very similar to those shown in the other series.
I make the rolling 2011 figure based on the above to be 0.348c, although the MO data file currently shows 0.353c, but I am not sure if that has been updated.
Complain about this comment (Comment number 69)
Comment number 70.
At 18:52 19th Dec 2011, greensand wrote:@89. QuaesoVeritas
Thanks QV, I hadn't even bothered looking, thought it too early!
Confirm 0.348c for 2011 so far. I assume they will update the 0.353c number.
Global at 0.263c is cooler than thought, land must have backed off towards the SST?
All interesting data.
Complain about this comment (Comment number 70)
Comment number 71.
At 18:59 19th Dec 2011, QuaesoVeritas wrote:#70. - greensand wrote:
@89. QuaesoVeritas
"Confirm 0.348c for 2011 so far. I assume they will update the 0.353c number."
Remember that the official MO annual figure isn't the same as the simple average of the months, so 0.353c could be correct.
Complain about this comment (Comment number 71)
Comment number 72.
At 19:03 19th Dec 2011, QuaesoVeritas wrote:Lowest Global HadCRUT3 for November since 2000, so outside the top 10 (just).
Complain about this comment (Comment number 72)
Comment number 73.
At 19:12 19th Dec 2011, greensand wrote:@71 QuaesoVeritas
"Remember that the official MO annual figure isn't the same as the simple average of the months,"
Are you sure QV? I seem to remember checking this for the "satellite" years, last 30 or so, and I am sure every year was posted at the average of the 12 months?
Am I missing something?
Complain about this comment (Comment number 73)
Comment number 74.
At 19:19 19th Dec 2011, QuaesoVeritas wrote:Greensand,
Did you get the data from the CRU site?
They use the simple average, but the MO use a different method.
It's all "explained" here:
https://www.metoffice.gov.uk/hadobs/indicators/index.html
See under:
Q. How do you obtain a global annual average temperature from the monthly data?
and
Q. Why aren't your estimates of the global annual average exactly the same as those that CRU publish?
Complain about this comment (Comment number 74)
Comment number 75.
At 19:27 19th Dec 2011, greensand wrote:QuaesoVeritas
MO site, just been back and checked it. Since 1979 every year apart from one is an average of the 12 months to 3dp.
The one year is 2000 when they posted +0.271c when the average was +0.270C, I took that to be a rounding issue?
Have to go out will look at the pointers you have kindly linked to later.
regards
Complain about this comment (Comment number 75)
Comment number 76.
At 19:31 19th Dec 2011, greensand wrote:QV
Hold the last post, the data might be CRU, will have to check on return
Complain about this comment (Comment number 76)
Comment number 77.
At 20:05 19th Dec 2011, Pkthinks wrote:#61. - newdwr54
The problem is that the models are a mix of completely different forcings and these are averaged to produce a 95% range rather than shown individually with confidence intervals, its not a noise or variability problem (detail)
see
https://rankexploits.com/musings/2011/surface-temperatures-cooler-than-multi-model-mean/
#67 Openside50
this graph above gives a rough answer to your question but not for the same years
https://www.realclimate.org/images/trends_dist.jpg
Complain about this comment (Comment number 77)
Comment number 78.
At 20:37 19th Dec 2011, QuaesoVeritas wrote:#75. - greensand wrote:
"The one year is 2000 when they posted +0.271c when the average was +0.270C, I took that to be a rounding issue?"
Annual figures for year 2000:
UKMO = 0.239c
CRU = 0.271c
Incidentally, for 1998:
UKMO = 0.517c
CRU = 0.548c
Both have 1998 as the warmest year, but they don't agree on how warm.
For 2010:
UKMO = 0.499c
CRU = 0.478c
So according to UKMO, 2010 was closer to 1998 than it was according to CRU.
At the moment, UKMO have this year as 0.353c and CRU have 0.357c, but the latter definitely isn't up to date and UKMO might not be.
Complain about this comment (Comment number 78)
Comment number 79.
At 22:51 19th Dec 2011, greensand wrote:@78. QuaesoVeritas
Thanks QV, I think I am finally there. It was CRU data, got incorrectly designated during my computer issues.
So now I have another complication re the MO and CRU annual numbers! Not to worry all will eventually become clear:-)
I have had a look at the MO explanation you pointed to - "The mean of the 12 monthly global averages does not equal the annual average. Why not?"
At present it is as clear as mud, will have another try later.
Complain about this comment (Comment number 79)
Comment number 80.
At 00:53 20th Dec 2011, RobWansbeck wrote:@79, greensand wrote:
“ I have had a look at the MO explanation you pointed to - "The mean of the 12 monthly global averages does not equal the annual average. Why not?" “
Firstly all months are not the same length so a small error can be introduced here e.g. February is over-represented.
Also the monthly mean uses grid squares that have data for that full month; the annual mean requires the squares to have data for the full year so there are less squares.
Complain about this comment (Comment number 80)
Comment number 81.
At 07:00 20th Dec 2011, QuaesoVeritas wrote:#80. - RobWansbeck wrote:
"Also the monthly mean uses grid squares that have data for that full month; the annual mean requires the squares to have data for the full year so there are less squares."
I have no doubt that the reasons for the differences are perfectly valid and may not be statistically different, but that doesn't alter the fact that there are two separate annual HadCRUT3 figures, from effectively the same monthly data.
This does complicate matters, particularly since differences are not consistent and can lead to different conclusions about temperature trends and relative temperatures from year to year. Moreover, it is very difficult to replicate the UKMO version of the annual figure.
Complain about this comment (Comment number 81)
Comment number 82.
At 10:25 20th Dec 2011, greensand wrote:@80 & 81 Rob & QV
"This does complicate matters, particularly since differences are not consistent"
I have plotted MO minus CRU annual numbers from 1979 to 2010 and if I have done it correctly they vary from -0.034c to +0.025c. So not a great deal just would be nice to know why the variance. Will go back and read some more.
The chart sort of "drifts" from +0.025c in 1980 down to -0.034c in 1999 and then "drifts" back up to +0.021c in 2010.
As QV says no doubt all perfectly valid, just don't know enough to make it predictable.
Complain about this comment (Comment number 82)
Comment number 83.
At 11:27 20th Dec 2011, lateintheday wrote:Note to all who showed an interest in my garden Holly Bush a few weeks ago. It appears that it's 'predictions' for a mild winter have been borne out so far - indeed, I suspect that it has out forecast many of the professionals! So, in respect of its success so far, I can report that it still bears the sign of the berry, which I contrive to interpret as an indication of a generally mild January for the UK.
All praise the bush!
Complain about this comment (Comment number 83)
Comment number 84.
At 15:45 20th Dec 2011, openside50 wrote:HadCrut3 global mean temperature anomaly Nov 1999 0.338ºC
HadCrut3 global mean temperature anomaly Nov 2011 0.330ºC
Interesting
Complain about this comment (Comment number 84)
Comment number 85.
At 15:47 20th Dec 2011, quake wrote:CET is now down to 0C anomaly for the month so far. Even though the next few days are forecast to be warm I think 2nd warmest year now looks unlikely as the month has to be something like +0.5C for that to happen. 2nd, 3rd and 4th place are very close so failing to take 2nd place will likely leave 2011 in 5th place.
Complain about this comment (Comment number 85)
Comment number 86.
At 15:53 20th Dec 2011, quake wrote:Re 84:
? November 2011 is 0.26 isn't it?
Complain about this comment (Comment number 86)
Comment number 87.
At 16:10 20th Dec 2011, QuaesoVeritas wrote:#83. - lateintheday wrote:
"So, in respect of its success so far, I can report that it still bears the sign of the berry, which I contrive to interpret as an indication of a generally mild January for the UK."
Sorry, I must have missed your earlier "Holly Bush" forecast. Are you saying that the berries mean a mild January? I thought that berries were supposed to be a sign of cold weather.
Complain about this comment (Comment number 87)
Comment number 88.
At 18:06 20th Dec 2011, Sheffield_city wrote:0.12c above the thirty year mean isn't a big deal is it. Bearing in mind we are only at the start of a thirty to forty year cold cycle.
Complain about this comment (Comment number 88)
Comment number 89.
At 18:13 20th Dec 2011, john_cogger wrote:@88 Sheffield_City
Didn't your cold cycle start last year? Or do you keep moving it back....and back.....and back....
Complain about this comment (Comment number 89)
Comment number 90.
At 18:53 20th Dec 2011, Lazarus wrote:openside50 wrote:
"HadCrut3 global mean temperature anomaly Nov 1999 0.338ºC
HadCrut3 global mean temperature anomaly Nov 2011 0.330ºC
Interesting"
I'm more interested in why you find Cherry Picking interesting. Any significance in 1999 other than it was bigger?
Complain about this comment (Comment number 90)
Comment number 91.
At 19:08 20th Dec 2011, QuaesoVeritas wrote:#84. - openside50 wrote:
"HadCrut3 global mean temperature anomaly Nov 1999 0.338ºC
HadCrut3 global mean temperature anomaly Nov 2011 0.330ºC
Interesting"
Can you explain where these figures are from?
I make them 0.210c and 0.263c.
Complain about this comment (Comment number 91)
Comment number 92.
At 19:35 20th Dec 2011, H2SO4 wrote:I don't make a comment very often but with my limited mathmatical knowledge can anyone tell me how on earth (no pun intended) we can measure these global temperatures to within three decimal places of a degree? And which came first - the change in temperatures or the change in CO2? If the earth is warming then there is not a cat's chance in hell that governments will be able to stop it.
Complain about this comment (Comment number 92)
Comment number 93.
At 20:04 20th Dec 2011, greensand wrote:@91. QV
Maybe they come from HadCRUT4?:-)
https://www.metoffice.gov.uk/media/pdf/9/s/MOSAC_16.4.pdf
"The update to the data set has adjusted the annual temperature anomalies in comparison to the previous version of the dataset. Most notably, the inclusion of new bias adjustments for marine data has resulted in a warming in the mid 20th century, relative to HadCRUT3. The inclusion of new land station data at high latitudes and in Russia has resulted in a warming of years in the late 20th century/early 21st century. These temperature differences, although small, make some differences to the annual temperature rankings but long-term trends in HadCRUT4 are not greatly different than those of HadCRUT3."
"Once accepted by peer review, the HadCRUT4 dataset will supersede HadCRUT3 as the principal dataset used by the Met Office Hadley Centre to assess global temperature change."
----------------------------------
"It would be good to remove at least part of the 1940s blip, but we are still left with "why the blip"."
Tom Wigley - Sept 2009
Maybe out of context but it will sure raise questions.
Complain about this comment (Comment number 93)
Comment number 94.
At 20:17 20th Dec 2011, jkiller56 wrote:To lateintheday#83
Glad to hear your holly is performing as per expectation - there is no sign of a cold surge at the moment so the winter migrants will be having an easy time of it.
Do keep up QV# 87 - we had this discussion a couple of weeks ago - to the conclusion that an influx of bird winter migrants ahead of a cold surge was responsible for the berries being eaten quickly - mild weather meant they would probably be left on the tree.
There are a few other indicators of mildness around. Some hazel catkins are loosening already (even though some bushes have hardly finished shedding the last of their summer leaves yet!). I expect if we get a sustained mild spell over Xmas the catkins will extend fully and start shedding pollen. I have seen this New Year blooming on the far west coast before but it is more unusual here. Although December has been fairly chilly so far, I would guess that the very warm November has put the hazels ahead of schedule and primed to respond to any mild weather in the next few weeks.
I also have one or two snowdrops on the verge of flowering, though they are not the common species and always bloom early - though if out before new year, this will be unusual.
Complain about this comment (Comment number 94)
Comment number 95.
At 23:57 20th Dec 2011, lateintheday wrote:QV @87 said "Sorry, I must have missed your earlier "Holly Bush" forecast. Are you saying that the berries mean a mild January? I thought that berries were supposed to be a sign of cold weather."
Mine is no ordinary bush QV. Tis the Holly bush of truth!
(Well, either that or the birds don't like it much)
Complain about this comment (Comment number 95)
Comment number 96.
At 00:51 21st Dec 2011, RealAnteros wrote:H2SO4 @ 92 -
Perhaps because I too rarely comment here, I can have a stab at answering your question! Easy answer - we can't. Certainly not to three (or more) decimal places. But no-one here would likely dispute that, or that a 'global average' has more meaning than it does, or that trends of a decade or so really tell us what is going on... But it doesn't stop 1) It being the only temperature data we have, and 2) It being interesting!
I follow the data as much as many people here and I'm going to take a disproportionate and slightly irrational interest in when RSS shows 15 years of cooling [Jan or Feb] and the same with Hadcrut [March?]
Unless the paleo records are all fibbing, I don't think Co2 levels are going to jump from 280 to 400ppm with the rise of barely 1 degree C. Otherwise, you might have expected the last 6 degrees of increase in temperature to have had more of an effect. So mostly in the last 100 years, temperature has likely followed Co2.
To your last statement - I agree. Certainly if the evidence of the last 25 years is anything to go by.
Complain about this comment (Comment number 96)
Comment number 97.
At 08:44 21st Dec 2011, Sheffield_city wrote:John_cogger. The last 5 winters have been very cold and we haven't had a decent summer since 2005. What planet do you live on? We have already had snow that has stayed on the ground for 4 days. This winter looks like being the reverse of last year, cold after and warmer before Christmas.
Complain about this comment (Comment number 97)
Comment number 98.
At 09:54 21st Dec 2011, quake wrote:"The last 5 winters have been very cold"
Really? 5 winters back looks to be the 2nd warmest on record. And 4 winters back was something like the 4th warmest on record.
https://www.metoffice.gov.uk/climate/uk/actualmonthly/16/Tmax/UK.gif
Complain about this comment (Comment number 98)
Comment number 99.
At 10:12 21st Dec 2011, john_cogger wrote:The last 5 winters have not been very cold. Only the last 2 have.
Winter Mean Temps (against 1971 to 2000)
06/07 = +1.9
07/08 = +1.2
08/09 = -0.5
09/10 = -2.0
10/11 = -1.3
Snow on the ground for 4 days? Call the record books!
Complain about this comment (Comment number 99)
Comment number 100.
At 10:42 21st Dec 2011, John Marshall wrote:Today is the start of winter, based on the planet's orbital position, not some date decided by the UK Met. Office.
Complain about this comment (Comment number 100)
Page 1 of 2