As graphic descriptions go, sometimes a graph is hard to beat

Jonathan Stoneman
is a freelance journalism trainer and consultant, specialising in data journalism
Among the many thousands of words written upon the death of Baroness Thatcher, just one article stuck in my mind. There were three reasons: it tested a well-worn so-called fact about the Thatcher years, took some real figures, and then, most importantly, used a graphic to answer its own question.
How much did Mrs Thatcher’s policies change home ownership in Britain?
We remember what we see much better than we remember what we read. Putting the figures in a table wouldn’t have worked as well. Although the figures were vital to testing the hypothesis, it was the graphic which stayed in my mind. We are ‘visual creatures’. Yet journalists often shy away from graphs. That’s a pity - look at these two pieces of information:
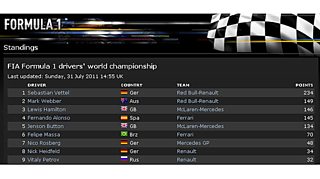
“Hamilton goes into the summer break third in the championship, 88 points behind Vettel, with Alonso one point back in fourth and Button remaining fifth, 100 points adrift.”
A graphic often tells multiple stories better than any paragraph can. This one displays all UK government spending as surface area. It puts everything in context, but everyone brings their own interest - you may want to know about health spending, while the next person is interested in how defence spending relates to other government expenditure. Imagine how many words you’d need to satisfy every reader’s interest…
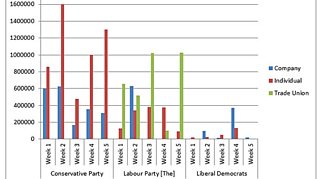
There are many free tools available to help make interesting graphics tell important stories. But sometimes you may just use something simple such as MS Excel’s built-in graphic-maker to grab the eye and pique interest in a story. Take this one: the summary of donations to UK political parties at the 2010 general election, which makes a good spreadsheet to practise on. If you are looking at the table of what kind of donors (businesses, individuals, trade unions) gave and how much money to each party in each week of the 2010 campaign, there’s nothing quite as clear as the graph Excel creates.
The message is clear: don’t be afraid of graphs. But, equally, don’t go mad and annoy audiences with clichéd graphics for their own sake!
