Data journalism: the important difference between transparency and clarity

Martin Rosenbaum
is a BBC News specialist in FOI and executive producer in BBC Political Programmes

BMJ report on the surgeon data
It’s all part of the public sector drive towards greater transparency, and from the journalistic point of view all this information is a good thing.
But it also contains challenges - how do we avoid being drowned in the data deluge and surface to spot the stories?
The BBC College of Journalism recently organised an event to consider how data can feed into our output. This is an example I discussed in my talk:
Last month the Royal College of Surgeons (RCS) released figures on death rates for major blood vessel surgery, analysed by individual, named surgeons. It showed that for many surgeons none of their patients had died in the wake of these operations, but for others several patients had died.
This was the first step in a plan by NHS England to open up more data about the outcomes of surgery in different specialisms.
The statistics prompt a set of difficult questions.
Do they tell you which vascular surgeon you want to repair your aorta? The one with the lowest mortality rate? Or could it be that the more skilled consultants perform the trickier operations and have worse mortality rates as a result? Or does the data simply show random variation without statistical significance?
The RCS issued a reassuring message with the data, proclaiming that "all surgeons are performing within the range expected". This was widely reported as part of the coverage - and it was how the British Medical Journal (BMJ) headlined its story (above). But was that really true of all the nearly 500 vascular consultants involved?
The difficulty in knowing how best to report the data was illustrated by the varied approaches adopted by different news outlets:
- The Daily Mail took a different angle to the BMJ. Its headline was “The surgeons whose patients were up to 30 times likelier to die” and focused on three consultants with apparently high mortality rates.
- The Daily Telegraph went with “NHS surgeons with the highest death rates named.” It identified four surgeons, the three named by the Mail and another who the Telegraph reported as having a mortality rate of 14% - although as he had only performed seven operations this meant just one death.
- In contrast the Independent’s angle was “Surgeons fear being vilified by release of mortality figures” (a fear possibly linked to what readers of some newspapers were being told).
- The Guardian’s take was “Medics' NHS league table mortality figures mired in confusion.” This highlighted some of the flaws in the published figures which soon became apparent. One common problem with reporting data releases is that large datasets very often contain errors.
- The BBC’s online headline was “Surgeon data: 'Historic' move for NHS.” It was indeed a historic move, but what was the real story?
After looking at the statistics in detail and comparing them to the RCS and Vascular Society policy document on performance outliers, it became clear to me that actually an alert would be triggered in relation to the record of several surgeons and the standard of their work would now be scrutinised. This was then confirmed to me by the Vascular Society.
In fact, as I wrote on my BBC blog, 10 vascular surgeons are to have their work reviewed to investigate whether they have been performing operations at an acceptably safe level.
But none of them are those mentioned by the Mail and the Telegraph.
That’s because those papers focused on consultants with the worst rates in the published raw data, whereas the safety alerts are triggered by risk-adjusted data which takes into account the age of patients and the nature of the surgical procedures.
Yet it’s not surprising that journalists used the raw data. The RCS did not actually disclose the risk-adjusted details on a named surgeon-by-surgeon basis. It told me that it thought the public would find the release of both raw and risk-adjusted figures “too confusing”. In this way I think it contributed to some misleading coverage.
The real picture was only made clear by two detailed funnel-plot graphs (below) in the report which were based on the risk-adjusted data - but it took some time to establish this.
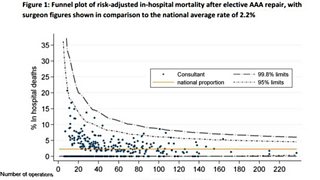
Risk adjusted surgeons data
This case illustrates some of the problems journalists will have with the rapidly growing flow of data issued by public authorities.
If the dataset is sufficiently large it should be expected to contain errors. And there is now so much data that interesting and important stories can be easily missed.
Much of it is raw data and is released without the contextual information to explain it properly. It may need interpretation, which takes time. And like anything else it can still be spun misleadingly at the time of publication by the authority releasing it.
