Maps, charts and graphs
Learn when to introduce maps, charts or graphs into your writing.
In this article you can learn:
- How to use a map in your writing
- How to use different types of graphs and charts
- What a key, scale and axes are
This resource is suitable for informative writing for primary school learners.
Video - Maps, charts and graph
Watch this video to learn how to use maps, charts and graphs in factual writing.
Learn when to introduce maps, charts or graphs into your writing.
How to use maps, charts and graphs in writing.
Graphs, charts and maps are very useful for presenting complicated information in a visual way that is easier to understand.
Imagine that we are putting together some details for the live online programme about the Monster Games.
Let's look at where all of the different events are taking place.
That's a lot of information to take in. How about we use a map instead?
This way we can sure where all the events are taking place using a key like this.
We can see how far away everything is using the scale.
There, that's much easier to understand now.
Where is the one hundred metre race taking place?
Ah yes, in the Ghastly Garden. Right, that will be a good one to watch.
Just in time and they're off.
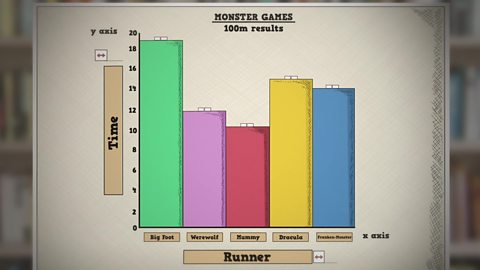
Well, that's an unusual way to win a race. Lets look at the results.
We can see the Mummy came first, but by how much?
If we use a bar graph, we can see this information much more clearly.
We will put the runners along the X axis along the bottom and the time up the Y axis up the side.
Each runner's time is then represented by a bar in the graph.
You should label your graph so that it is easy for your reader to see what they are looking at. There, that's better.
Just look how quick the Mummy was or at least his arm.
I wonder how many medals each monster has won?
A pie chart is a good way to show this clearly.
Each section of the pie chart represents how many medals each monster has won as a portion of the total number of medals.
The bigger the piece of pie, the more medals they have won.
Remember to give your chart a title. Much better.
My goodness, the Mummy has been doing very well at these games, hasn't he? Especially considering he's been dead for two thousand years.
But those two don't look very pleased with him.
Oh, there are some things that we don't need to see any more graphically. Thank you very much.
Why do we use maps, charts and graphs in writing?
Graphs, charts and maps are very useful for presenting complicated information in a visual way that is easier to understand.
Imagine that we are putting together some details for the live online programme about the Monster Games.
Maps, graphs and charts
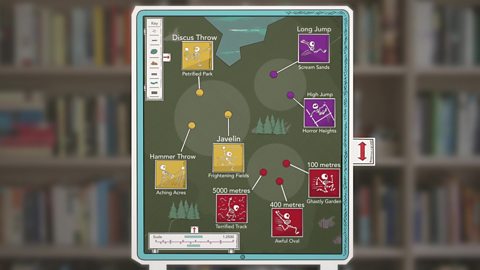
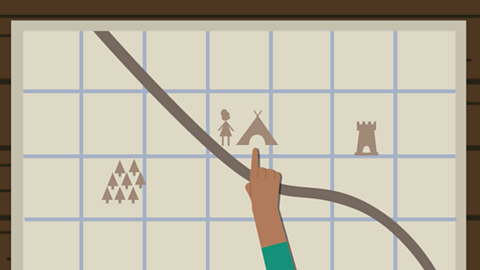
Image caption, Map
If we are writing about a place or event, a map can be a useful way to show information. A map needs a key and a scale to make it easy for people to understand.

1 of 3
When to use a map in writing
If we are writing about an event, like the Monster Games, we need to think about where all the different events are taking place. This is a lot of information in a list so we can use a map instead.
What is a map?
- A map is a two-dimensional drawing of an area.
- Maps can be on paper or on a mobile phone, tablet or computer.
- Maps are not drawn to the same size as the ground because they would be far too big! Instead they are drawn to a smaller scale. When we use a scale, we can see how far away everything is.
When to use a bar graph in writing
We can see information much more clearly using a bar graph:
- what you have counted along the bottom (the x-axis) and numbers up the left (the y-axis)
- the number of each thing is shown by a bar
- the height of the each bar shows how many of each thing there are
When to use a pie chart in writing
A pie chart is a good way to show information clearly. It shows a total number as a circle:
- the circle is divided into different slices for different things
- each section of the pie chart represents a portion of the total number
- the bigger the slice the bigger the number of things (quantity)
Remember, always give the chart a title.
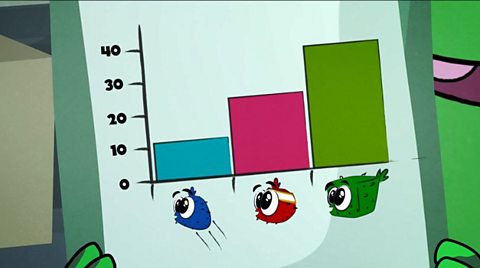
Learn more about different types of graphs and charts with Fin, Snoot and Plimble: How do I record and display data?

Key words about maps, graphs and charts
- Check your connection, refresh the page and try again. – Something made up of many different parts. For example: 'The recipe was too complicated so I choose an easier one.'
- Check your connection, refresh the page and try again. – A large spoon with a cup-shaped bowl. For example: 'A map key lists the symbols and what they mean.'
- Check your connection, refresh the page and try again. – Maps are not drawn to the same size as the ground because they would be far too big! Instead they are drawn to a smaller scale. For example: 'A scale on a map will help work out the distance on the land.'
- Check your connection, refresh the page and try again. – The lines used to measure data on graphs and grids. For example: 'We measured the number of people on the axes of the graph.'
- Check your connection, refresh the page and try again. – When something or someone is used on behalf of or in place of something else. For example: 'The pupil was delighted to represent the school at the gala opening.'
- Check your connection, refresh the page and try again. – A part of a whole thing. For example: 'David was disappointed when he only got a small portion of his favourite pizza.'
- Check your connection, refresh the page and try again. – The amount of something. For example: 'We were able to save some money when we bought a large quantity of bananas instead of only one.'
Test your knowledge
Quiz
Challenge
Make a survey then represent your results with a graph
- A survey is a way of collecting data or information about a topic. A survey is done by asking people questions and noting their answers. your friends and/or family to find out what their favourite fruit or chocolate bar is.
- When you have the results, make a graph or pie chart to show the information visually.
- You should be able to see the most popular fruit or chocolate and the least popular.
More about maps, graphs and charts
How do I record and display data? video
Learn more about using graphs and charts to display information.
Maps. revision-guide
Learn what a map is and how we use one.
How to write a report. video
Discover the skills you need to write clear and informative reports

More on Factual writing
Find out more by working through a topic
- count1 of 8
- count2 of 8
- count4 of 8