Fin, Snoot and Plimble use a tally table, bar graph and pie chart to count meebs.
NARRATOR: Hello you three, what are you doing?
ALIENS: (Alien language)
NARRATOR: Ah, you’re trying to count up all your different meebs. Some of them are a big ‘energetic’ aren’t they?
Maybe you should write down how many you’ve got.
Snoot, why don’t you count the blue jumping meebs.
ALIEN: (Alien language)
NARRATOR: Finn, you count up the red racing meebs.
ALIEN: Alien language)
NARRATOR: And Plimble, you count up the green stacking meebs.
ALIEN: (Alien language)
NARRATOR: So, how many meebs do you have?
ALIEN: (Alien language)
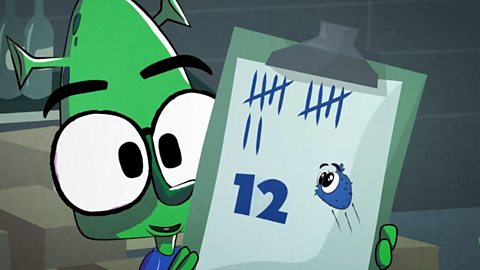
NARRATOR: I see you’ve used a tally to count them, Snoot. Your tally shows 5, 10, 11, 12 blue jumping meebs.
ALIEN: (Alien language)
NARRATOR: And your tally Finn, shows 24 red racing meebs.
ALIEN: Hello.
NARRATOR: And Plimble, your tally shows 38 green stacking meebs. That’s a lot of meebs.
I think you’d better write down all of these numbers in one place, so you don’t lose them. Let’s see what you’ve got Snoot…
ALIEN: (Alien language)
NARRATOR: Very nice, you’ve drawn up a table showing the types of meebs on the left, and the number of each type on the right.
ALIEN: (Alien language)
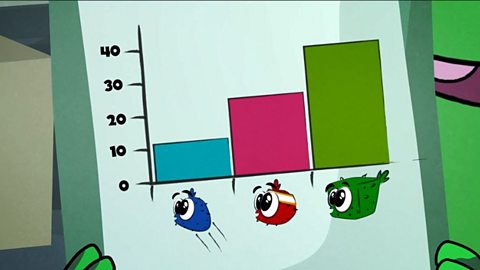
NARRATOR: That’s great Finn, a bar graph with the types of meebs along the bottom, and numbers of meebs up the left.
The taller the bar, the bigger the number.
What about you Plimble?
ALIEN: Plimble!
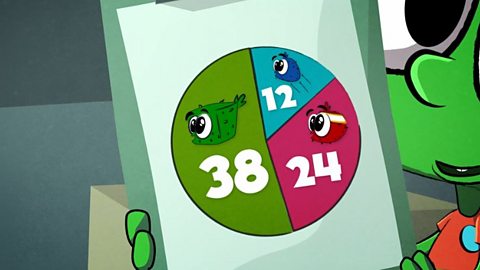
NARRATOR: That’s awesome! A pie chart showing different types of meebs as slices of pie.
That’s a great way of showing how the total number of meebs divides up. The bigger the slice, the more meebs it has.
ALIENS: (Alien language)
NARRATOR: Okay, there’s no need to argue, you’ve all done really well.
Snoot's table shows how many meebs there are in simple numbers.
Finn's bar graph, shows those numbers as different-sized bars.
And Plimble's pie chart shows those same numbers as different sizes slices of pie.
These are just three different ways of organising the same data.
ALIENS: Ah ha!
NARRATOR: Oh dear, the meebs are on the loose! I think we may need a re-count.
How can I count and display data?
A tally is a quick and easy way to record what you are counting.
- Draw a line like a 1 to mark each number you count.
- When you get to 5, draw a diagonal line across the first four lines
- Making groups of 5 like this makes it easier to count your tally later.
How can I show what I have counted?
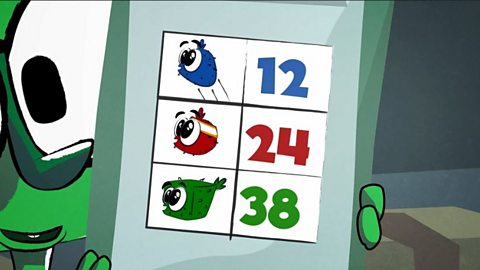
Image caption, A table shows what you have counted on the left and how many of each thing there are on the right as a number.
1 of 3

How can I show what I have counted?
A table shows:
- what you have counted on the left
- how many of each thing there are on the right as a number

A bar graph shows:
- what you have counted along the bottom and numbers up the left
- the number of each thing is shown by a bar
- the height of the each bar shows how many of each thing there are
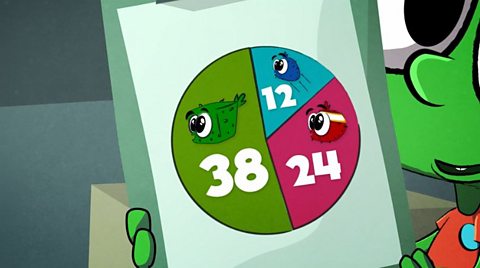
A pie chart shows a total number as a circle
- the circle is divided into different slices for different things
- the bigger the slice the bigger the number of things
More on Information and data
Find out more by working through a topic
- count2 of 6

- count3 of 6

- count4 of 6

- count5 of 6

