JANINE: Oh these two are fierce competitors, Jeff.
JEFF: That they are, Janine. Let’s help the viewers at home visualise it with some stats.
JANINE: No problem, Jeff, let’s look at a table of their best score so far…
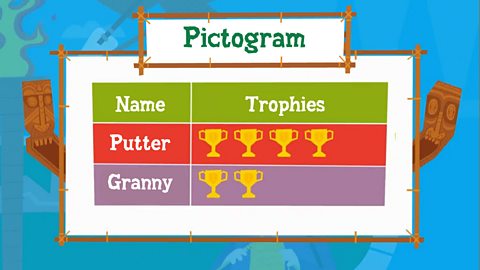
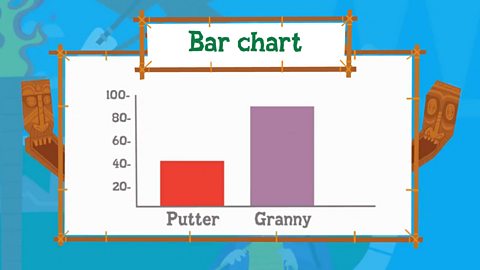
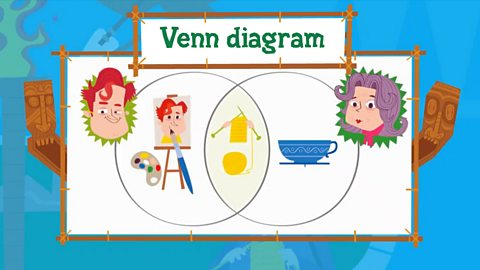
A pictogram of their trophies, a bar chart showing their ages, I’ve even got a Venn diagram showing their holidays.
JEFF: I never knew they both liked knitting.
Oh it looks like Putter Mulligan is about to take his shot…
JANINE & JEFF: Ohhhhh!
JANINE: Oh should have seen that one coming, Jeff.
There are lots of ways to visualise data.
Displaying data
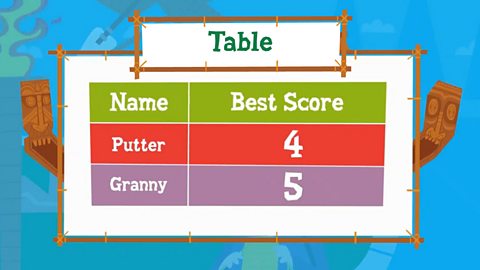
Image caption, A table is used to write down a number of pieces of data about different things. This table shows each player's best score.
1 of 4
End of image gallery
More on Information and data
Find out more by working through a topic
- count3 of 6

- count4 of 6

- count5 of 6

- count6 of 6

