Key points
A distance-time graph, sometimes referred to as a travel graph, is a way of representing a journey.
It is helpful to have prior knowledge of speed, distance and time as well as how to work out the gradient of a straight line, in order to interpret distance-time graphs.
- Each straight A specific part of a line between two points. of the journey represents one part of the whole journey.
- An A line that is slanted, neither horizontal nor vertical. segment represents a moving part of the journey.
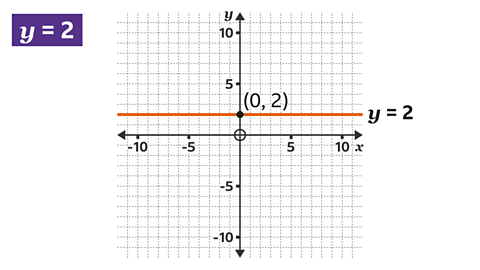
- A The right-left direction on a graph or map. Parallel to the horizon. line segment represents no movement - this is the part of the journey where the object is stationary.
The A measure of the slope of a line. The steeper the line, the greater the gradient. The gradient is represented by 𝒎 in the equation 𝒚 = 𝒎𝒙 + 𝒄 of a distance-time graph gives the A number or quantity that does not vary. A constant speed is a steady speed. Eg, the speed of light is constant. The speed of a car is not constant, it varies. speed for that part of the journey. The steeper the line, the faster the A measure of how the distance travelled by a moving object changes with time. The average speed of a moving object is defined as the total distance travelled/time taken to travel that distance. The units of speed are length/time, eg kilometres per hour, or metres per second..
Drawing a distance-time graph
How to draw a distance-time graph:
Decide on the size of the axes.
- The \(x\)The line on a graph that runs horizontally (left-right) through the origin. It is used as a reference to measure from. represents the time taken.
- The \(y\)The line on a graph that runs vertically (up-down) through the origin. It is used as a reference to measure from. represents the distance travelled.
Draw each part of the journey in sections.
- For each stage of the journey, plot the distance travelled against the time taken and draw the line segment.
- Remember that any stop during the journey will be a horizontal line segment.
- A return journey means the line segment is drawn going back towards the \(x\)-axis.
Examples
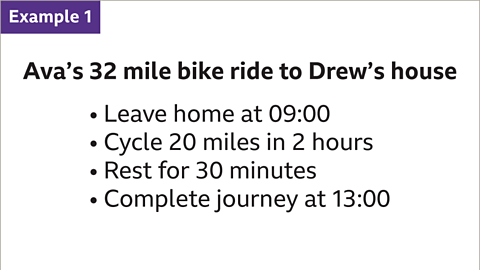
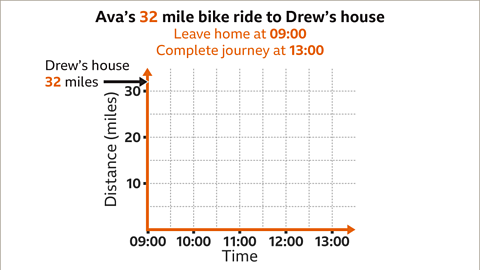
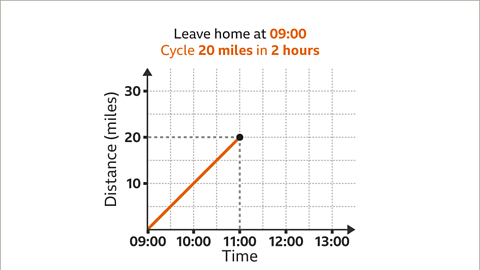
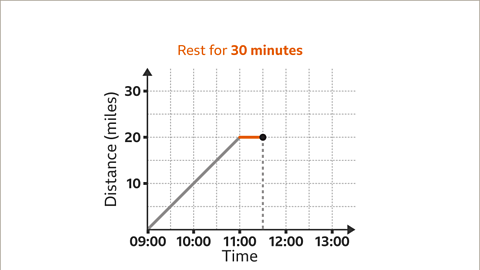
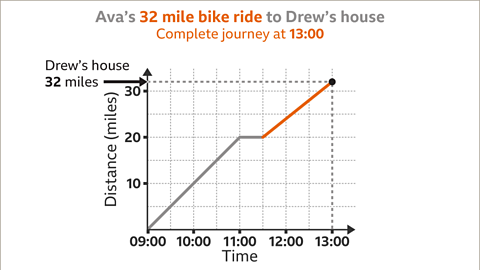
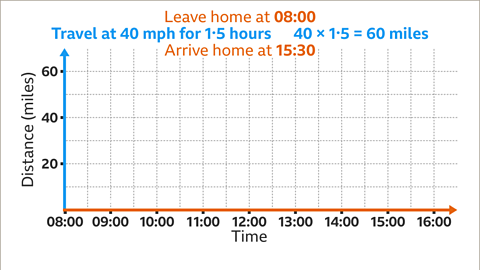
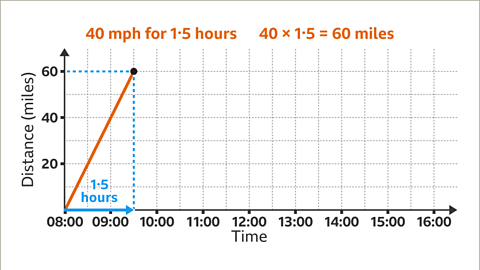
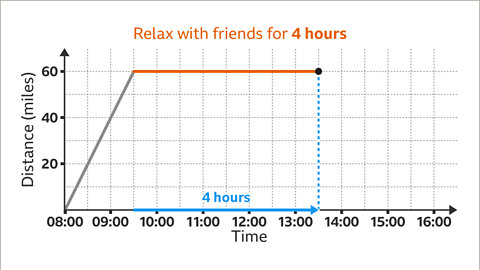
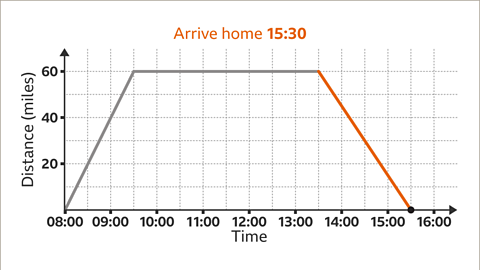
Image caption, Ava is cycling 32 miles to Drew’s house. Ava leaves home at 09:00 and cycles 20 miles in 2 hours. She stops for a 30-minute break and then continues and arrives at Drew’s house at 13:00. Draw the distance-time graph for this journey.
1 of 10
Questions
Question 1:
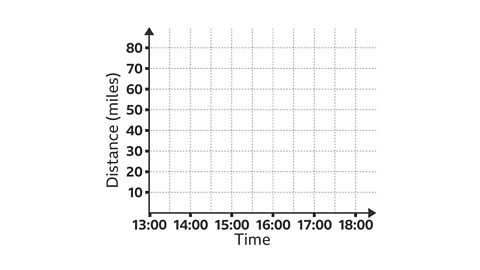
A vehicle starts its journey at 13:00.
It travels at a speed of 20 mph for 2۰5 hours.
The vehicle stops for 1۰5 hours before continuing its journey.
It travels a further 30 miles and arrives at its destination at 18:00.
On a piece of graph paper, draw a distance-time graph of this journey. Alternatively, click here to download and print out a graph you can use.
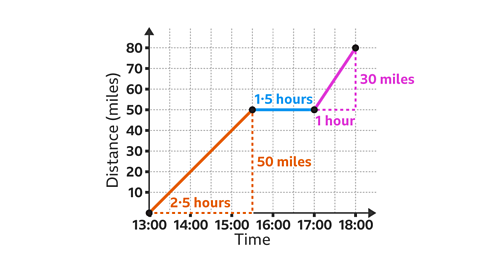
Stage 1:
- Starting at 13:00, the vehicle travels at a speed of 20 mph for 2۰5 hours. The time is now 15:30.
- Calculate the distance (speed × time), 20 × 2۰5 = 50. The vehicle has travelled 50 miles.
- Draw a line segment from (13:00, 0) to (15:30, 50).
Stage 2:
- The vehicle stops for 1۰5 hours. The time is now 17:00, the distance is still 50 miles because the vehicle has not moved.
- Draw a horizontal line segment from (15:30, 50) to (17:00, 50).
Stage 3:
- The vehicle travels a further 30 miles and arrives at 18:00. Calculate the total distance travelled, 50 + 30 = 80. The journey is 80 miles.
- Draw a line segment from (17:00, 50) to (18:00, 80).
Question 2:
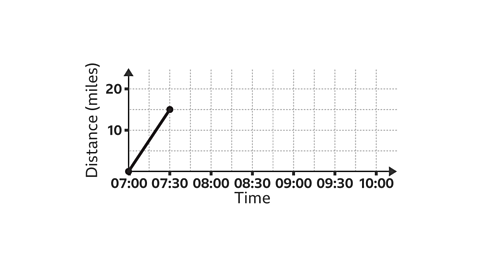
Omar and Rosie set off on their holiday.
They leave at 07:00 driving at 30 mph for 30 minutes before realising Omar has forgotten his passport.
They travel back home at 10 mph due to traffic.
The partially completed graph shows the start of their journey.
Complete the graph on a piece of graph paper to find the time that they got home. Alternatively, click here to download and print a graph you can use.
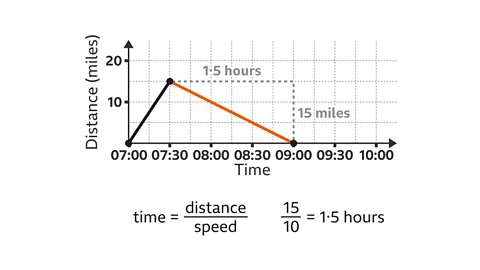
They arrive home at 09:00.
Stage 1:
- Omar and Rosie set off at 07:00, travelling at a speed of 30 mph for 30 minutes. The time is now 07:30.
- Calculate the distance (speed × time), 30 × 0۰5 = 15. The vehicle travels 15 miles.
- The line segment has been drawn from (07:00, 0) to (07:30, 15).
Stage 2:
- The vehicle returns home. The speed is 10 mph, and the distance home is 15 miles.
- The time that this journey will take is worked out by using the formula 'time = distance ÷ speed', 15 ÷ 10 = 1۰5. This is 1 hour and 30 minutes.
- The time is now 09:00 and the distance is 0 because they have returned home.
- Draw the line segment from (07:30, 15) to (09:00, 0).
Using a distance-time graph to find speed
The A measure of the slope of a line. The steeper the line, the greater the gradient. The gradient is represented by 𝒎 in the equation 𝒚 = 𝒎𝒙 + 𝒄 of a line segment on a distance-time graph gives the A number or quantity that does not vary. A constant speed is a steady speed. Eg, the speed of light is constant. The speed of a car is not constant, it varies. speed of the object for that stage of the journey.
The steeper the line segment, the greater the speed. A horizontal line segment shows that the object is stationary, so not moving.
The absolute value of a number is just the value of the number, ignoring the sign. are used for speed. A return journey is not given a negative value as it is not completed in reverse or backwards. Speed is worked out by dividing distance by time.
To work out the speed of one stage of a journey:
- Find the distance travelled.
- Find the time taken.
- Divide the distance travelled by the time taken.
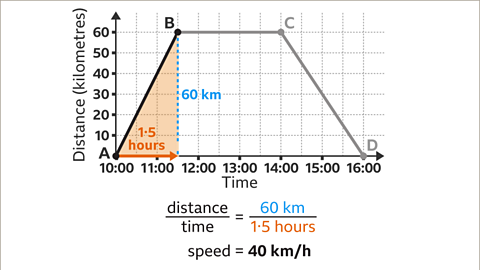
\( speed = \frac{distance}{time} \)
Example
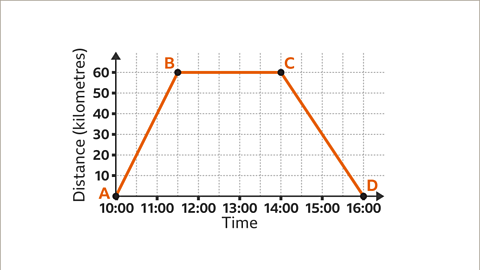
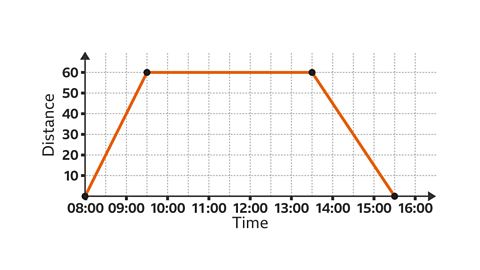
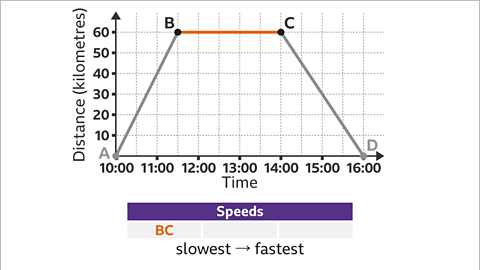
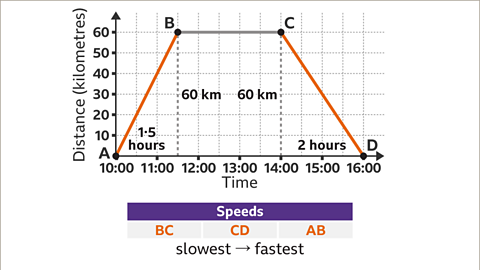
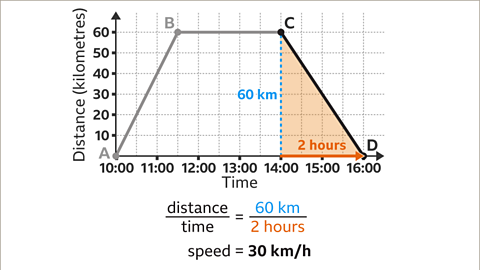
Image caption, This journey has three stages, shown by the three line segments AB, BC and CD. Put these stages in order of speed from slowest to fastest.
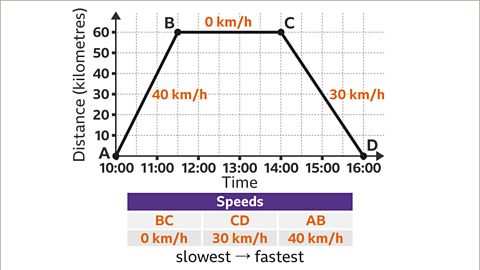
1 of 6
Question
Find the speed for the return journey shown on this distance-time graph.
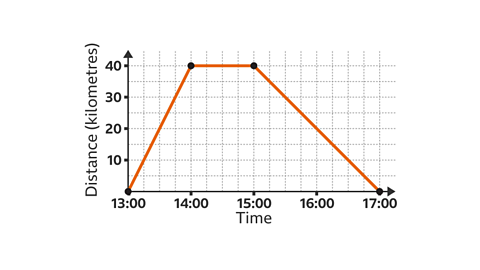
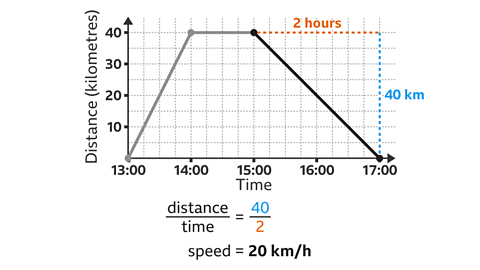
A return journey is shown by a line drawn towards the \(x\)-axis.
The distance travelled is 40 km and it takes 2 hours.
The speed is distance divided by time. 40 ÷ 2 = 20
The speed of the return journey is 20 km/h.
Practise using distance-time graphs
Quiz
Practise reading and plotting distance-time graphs with this quiz. You may need a pen and paper to help you with your answers.
Real-life maths
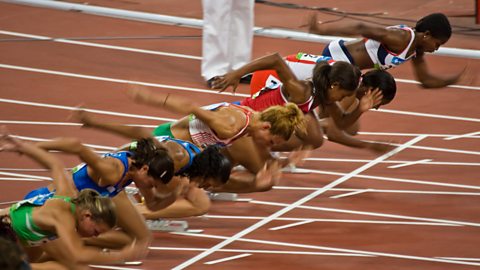
Professional sprinters may use distance-time graphs to identify weaknesses in their performance. The information they can get from graphs like these allows them to find out where they are:
- accelerating, shown by a curve with an increasing gradient.
- moving at a constant speed, shown by a straight line.
- slowing down, shown by a curve with a decreasing gradient.
Successful sprinters can reach their maximum speed quickly and maintain it for their entire race.
A distance-time graph of an Olympic sprinter during a 100-metre race will show how fast they accelerate to a constant speed. They will aim to maintain this for the rest of the race, with little loss of speed until the last fractions of a second.
Play Sudoku with BBC Bitesize!
Every weekday we release brand new easy, medium and hard Sudoku puzzles. Perfect for testing your skill with numbers and logic.

More on Graphs
Find out more by working through a topic
- count7 of 7
- count1 of 7
- count2 of 7
- count3 of 7