Speaker 1: Charts are visual representation of the results that we get.
Speaker 2: A pie chart is, is obviously is you know it's round, it's like a pie.
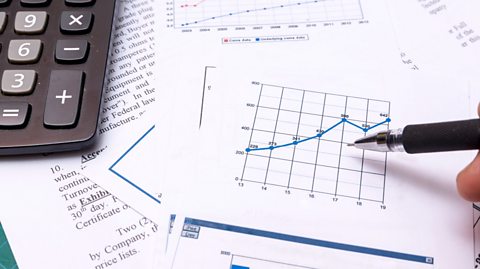
Speaker 1: The chart I think is most commonly used within hospitals and the medical environment is the line chart.
Speaker 3: In a bar chart you have columns kind of thing.
It goes up like buildings.
Speaker 4: A chart's important 'cause hairdressers are visual.
Visual charts speak louder than letters and numbers and words.
People can physically see the difference and you can see the existing clients and the amount of new clients that we attract each month which is important.
So you can see that, that 30% of our client base was new which is about the right average to have that at.
Speaker 5: When managing a business, it's very important that we track what we're doing numerically as well as by looking around the business.
We collect a lot of data and we use graphs to try and tell stories out of our mass of numbers.
We're looking here at a chart which compares the blue line of the number of computers we support per engineer and the orange and red lines show our measurements of, of performance against our standards.
We have to gather a lot of data but out of it we try and produce very simple answers.
Simple charts, simple stories that we can then take action on.
Graphs and charts can help you visualise and understand figures more clearly.
Quick tips for tutors
Graphs and charts includes:
- Explanation and illustration of the different ways in which data is presented in charts and diagrams
- Worked examples of creating and interpreting a range of graphs and charts, tables and other diagrams
- Everyday examples of charts and diagrams from which we extract information
- Activities to practise working with graphs and charts
Downloadable Factsheets
Entry 3 - Bar charts
How to take data from a tally chart and display it in the form of a bar chart.

Entry 3 - Comparing data using bar charts
How to use a dual bar chart to compare data.
Entry 3 - Reading bar charts
How to interpret bar charts and use the scale markings to extract information.
Entry 3 - Reading scales
How to read and understand the scale markings of a bar chart.
Entry 3 - Using clear labels on your chart or diagram
How to present data in charts and diagrams to make sure they are complete and can be read clearly.
Entry 3 - Understanding pictograms
How to read a pictogram and how using pictures to represent numbers can make information easy to understand.
Level 1 - Charts and diagrams: Everyday examples
How to understand and read a variety of everyday examples of charts and diagrams.
Level 1 - Charts and diagrams: Holiday information
How to read holiday information in the form of charts and diagrams.
Level 1 - Extracting and interpreting data from line graphs
How to extract data from a line graph, using the example of a line graph showing a baby's temperature taken over a week.
Level 1 - Interpreting information from line graphs
How to extract data from a line graph.
Level 1 - Interpreting information from bar charts
How to use information from charts and diagrams to help make decisions.
Level 1 - Reading pictograms
How to interpret information from a pictogram.
Downloadable Worksheets
Entry 1 & 2 - Creating a chart
An activity in using information to create a bar chart.
Entry 3 - Creating a bar chart
Exercise in creating your own bar chart using the conventions for presenting data such as correct labelling and using a scale.
Entry 3 - Extracting information from pictograms
Exercise in reading a pictogram to answer the questions on the worksheet.
Entry 3 - Extracting information from bar charts: Football results
Exercise in reading information from a bar chart about football results to answer the questions on the worksheet.
Entry 3 - Interpreting a bar chart
Exercise in adding the missing information to a bar chart.
Entry 3 - Extracting information from bar charts: Pizza sales
Exercise in reading a pizza sales bar chart and answering the questions on the worksheet.
Entry 3 - Interpreting a pictogram
Exercise in adding missing information to a pictogram.
Entry 3 - Spotting errors in tables and charts
Exercise in finding the error in the tables and charts provided by the worksheet.
Level 1 - Reading a table: Cup final results
Exercise in reading a cup final results table and answering the questions on the worksheet.
Level 1 - Interpreting information from pictograms
Exercise in reading a pictogram showing the number of visitors to the local library.
Level 1 - Interpreting line graphs
Exercise in reading a temperature line graph and answering the worksheet questions.
Level 1 - Reading a bar chart: Student punctuality
Exercise in reading a bar chart on student lateness and answering the questions on the worksheet.
Level 1 - Reading line graphs
Exercise in reading a temperature and currency conversion line graph and answering the questions on the worksheet.
Level 1 - Reading and amending a pictogram
Exercise in reading and amending a pictogram on favourite meals and answering the questions on the worksheet.
Level 1 - Reading pie charts
Exercise in reading pie charts and answering the questions on the worksheet.
Level 1 - Interpreting a results table
Exercise in reading a Tour de France results table and answering the questions on the worksheet.
Level 1 - Using a distance table
Exercise in reading a distance table and working out the distance between two cities.
Level 1 - Reading a bar chart: Eye colours
Exercise in reading a bar chart on children's eye colour to answer the questions on the worksheet.