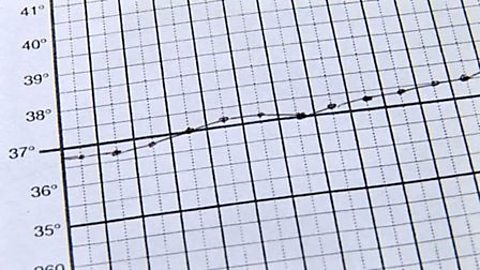
Speaker 1: Collecting data is a huge part of our jobs because we need to monitor a patient's progress over time.
Speaker 2: When you collect that information you have to be, it's like your sharing it with other health care professionals.
Speaker 3: Stock is really important and having a good understanding and control of stock.
Speaker 4: So we'll just around bit by bit counting off all the products.
Tally marking them off so then at the end we would add it all up.
Speaker 5: Five, 10, 15, 20, 30.
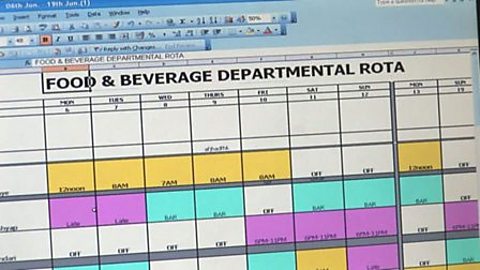
Every Monday we check the clean linen so that we know we have enough linen for the whole hotel.
We write the clean linen in the table so that we will send the information to the linen company so that the linen company will send back the clean linen that we need for the whole week.
Recording data is useful in many jobs, like taking stock in a shop, or a patient's temperature.
Quick tips for tutors
Collecting data includes:
- Using charts and tables including tally
- Labelling pictograms, bar charts and line graphs
- Writing questions for surveys
- Choosing samples for surveys
Downloadable Factsheets
Entry 3 - Presenting data in different ways
Summary of why it makes sense to present data in different ways, including lists, tables, maps, diagrams and charts.

Entry 3 - Collecting data and presenting it as a list
How to make a list under different headings, using the example of a café menu.
Entry 3 - Pictograms
Summary of the main features of a pictogram for displaying information, using the example of sunshine hours recorded.
Entry 3 - Tables
Summary of how to organise and display information in a table using column and row headings.
Entry 3 - Tally tables
How to make a tally table, using the example of a survey of sports activities which demonstrates the use of a five bar gate.
Level 1 - Collecting data: Bar charts
How to collect, organise and represent data in a bar chart.
Level 1 - Collecting and presenting data using line graphs
How to use a line graph to show how something changes over time.
Level 1 - Designing questions
Summary of the basic guidelines for writing questions in a questionnaire.
Level 1 - Surveys
Summary of the basic guidelines for carrying out surveys, including how to choose an appropriate sample.
Downloadable Worksheets
Entry 3 - Creating your own bar chart
Exercise in drawing a bar chart, including the essential parts of a bar chart, such as the title and labels.

Entry 3 - Representing data in a bar chart
Exercise in using your imagination to add fitting information and labels missing from the bar chart provided.
Entry 3 - Representing data in a pictogram
Exercise in using your imagination to add fitting title and labels missing from the pictogram provided.
Level 1 - Carrying out a questionnaire
Exercise in working out whether questionnaire samples are appropriate or not.
Level 1 - Representing data using a line graph
Exercise in plotting provided data onto a line graph.
Level 1 - Designing questionnaires
Exercise in identifying a 'leading question' and practise in changing open-ended questions to multiple choice.