Key points
- A frequency diagram is a type of graph used to represent a Continuous data can take any value within a range. It is data which has been measured rather than counted, eg time, length, mass. set of grouped data.
- This may be a set of data with many individual values. Only by grouping the data and producing a graph can meaningful analysis be achieved. Eg the amount of rainfall each day over a year.
- A frequency diagram is similar to a bar chart in appearance as it uses different height bars to represent the The number of times something occurs. of each range. However, there are no gaps between the bars.
- In a frequency diagram the frequency is represented on the The line on a graph that runs vertically (up-down) from the origin.. The labelling on the The line on a graph that runs horizontally (left-right) from the origin. is a continuous number scale.
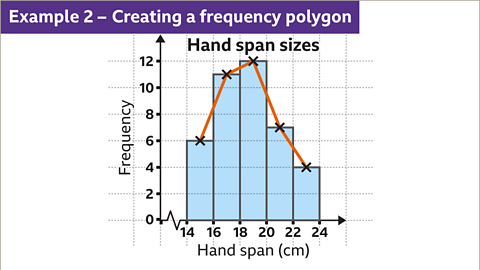
- A frequency polygon is similar to a frequency diagram but uses connected lines to represent the frequencies rather than bars.
Drawing and interpreting frequency diagrams and polygons
To produce a frequency diagram data is required. The data often comes in the form of a table.
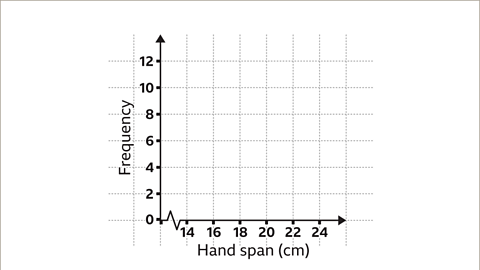
To create a frequency diagram:
- Look for the largest frequency in the table.
- Draw a vertical axis on square paper or graph paper.
- Choose an appropriate scale for this axis and label the axis up to the largest frequency. For example increments of one, two, five and ten may be appropriate.
- Look at the range of data for the horizontal axis. Choose an appropriate scale for this axis. A A symbol indicating a break in the scale on an axis. may be required.
- Draw and label the horizontal axis.
- Draw each bar the correct height, based on the frequencies, and between the The range of values allowed within that band, when grouping data.
- Check each axis is labelled correctly and then give the frequency diagram a title.
Examples
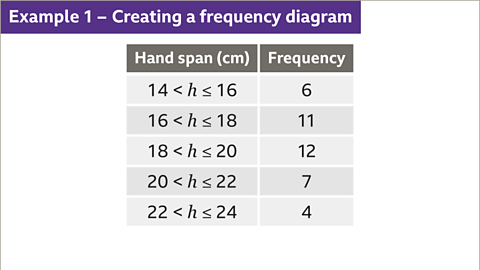
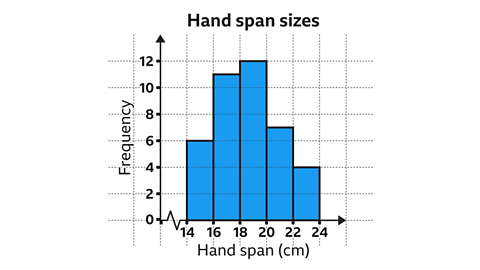
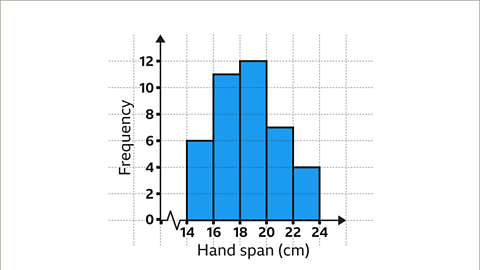
Image caption, A student recorded the length of 40 pupils’ hand spans. Construct a frequency diagram based on the data.


1 of 9
Question
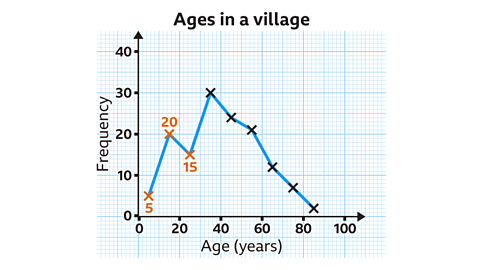
The frequency polygon shows the distribution of ages in a village. How many people living in the village are under the age of 30?
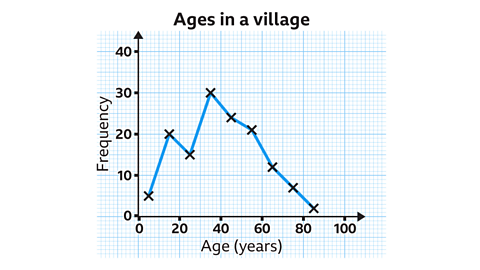
The first three data points represent the groups of ages less than 30 years old.
Villagers = 5 + 20 + 15 = 40
Therefore, there are 40 villagers under the age of 30
Practise using frequency diagrams and frequency polygons
Quiz
Practise understanding and using frequency diagrams and frequency polygons with this quiz. You may need a pen and paper to help you with your answers.
Real-life maths

Manufacturers of products employ testers and A person who studies statistics or uses statistics in their work. to assess new products before they go on sale to the general public.
For example, how long a lightbulb will stay working can be different from one lightbulb to the next. This may depend on tiny variations in the manufacturing process.
By testing a sample of lightbulbs, and plotting how long they last on a frequency diagram, the manufacturer can use this information to provide a sensible estimate of the lifespan of their product.
Play Sudoku with BBC Bitesize!
Every weekday we release brand new easy, medium and hard Sudoku puzzles. Perfect for testing your skill with numbers and logic.

More on Representing data
Find out more by working through a topic
- count6 of 6
- count1 of 6

- count2 of 6
- count3 of 6