Key points
- A pictogram is a type of chart used to represent a Data that is not numbers, eg, words. or Data that takes specific values, often whole numbers, eg, the number of siblings, shoe sizes. set of data.
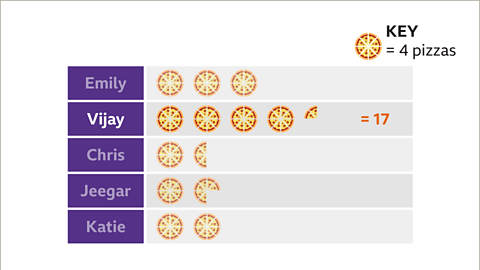
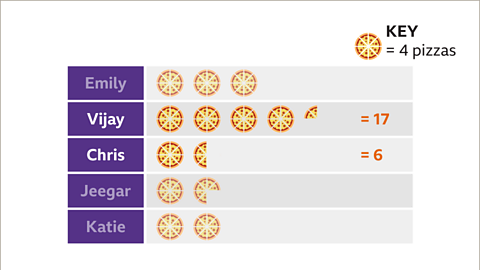
- A pictogram uses pictures, or icons, to represent the The number of times something occurs. of each category. The total frequency is dependent on the number of icons used.
- In a pictogram the icons used are the same size, equally spaced and are aligned for each category. This makes it easy to spot the The most frequent piece of data..
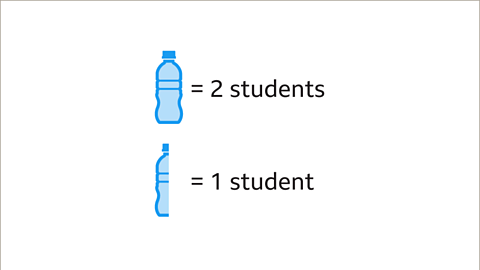
- A An illustration that explains the colours or symbols on a graph. is included to indicate what value each icon represents. Fractions of the icon, usually a half or a quarter, might be used to indicate some values.
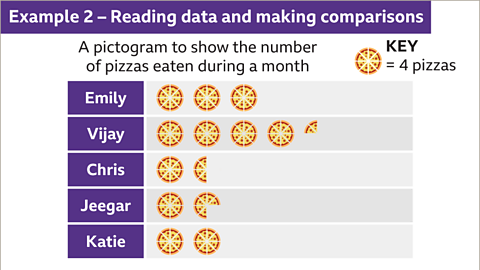
- A pictogram can be used to make comparisons between the categories in a set of data.
Creating a pictogram
To produce a pictogram, data is required. The data often comes in the form of a table.
To create a pictogram:
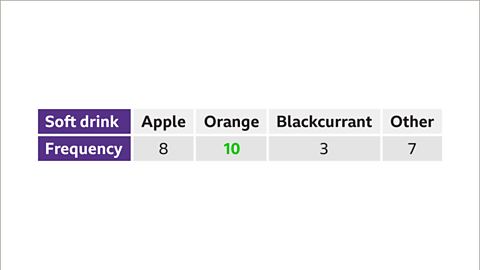
- Look for the largest frequency in your table.
- Decide on an appropriate icon and what value it will represent. Ones, twos or fours work best.
- Draw a table with two columns, one for the category and one for the icons.
- Label the categories in the table.
- Draw the correct number of images for each frequency.
- Check you have included a key and give your pictogram a title.
Examples
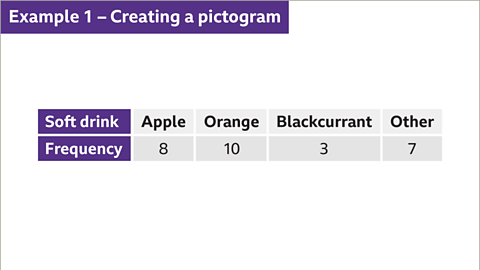
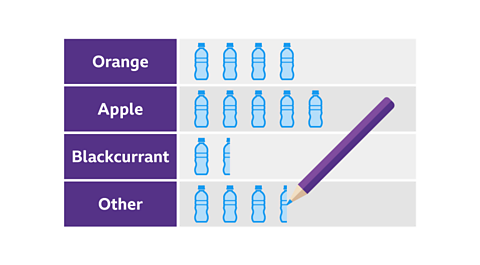
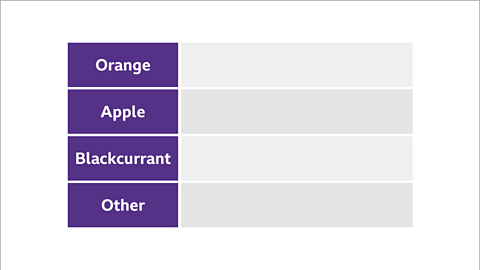
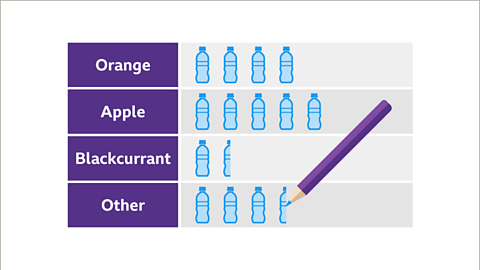
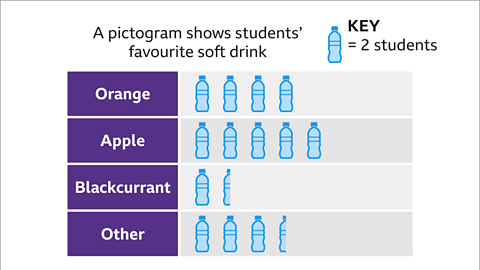
Image caption, Thirty students were asked which their favourite soft drink was. The table shows the results. Create a pictogram to represent the data in the table.

1 of 10
Question
The pictogram shows the number of driving lessons some students had during a month.If Simon had 7 lessons, how many lessons did Samaira have?
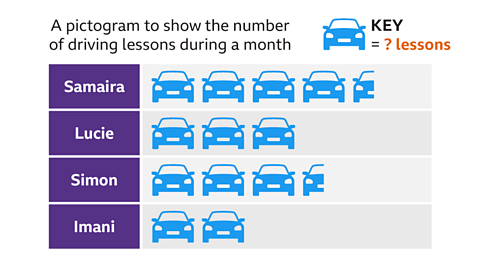
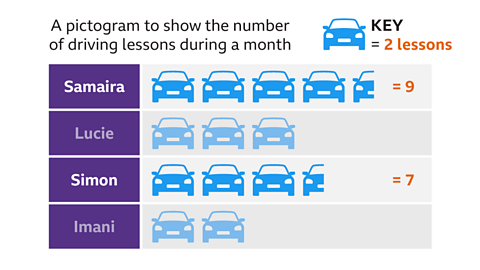
Simon has three and a half icons. This represents seven lessons.
Icon = 7 ÷ 3.5 = 2
Each icon represents two lessons.
Samaira has four and a half icons.
Samaira = 4.5 × 2 = 9
Samaira had nine lessons.
Practise reading data and making comparisons with pictograms
Quiz
Practise reading data and making comparisons with this quiz. You may need a pen and paper to help you.
Play Sudoku with BBC Bitesize!
Every weekday we release brand new easy, medium and hard Sudoku puzzles. Perfect for testing your skill with numbers and logic.

More on Representing data
Find out more by working through a topic
- count4 of 6
- count5 of 6

- count6 of 6
- count1 of 6

