Data means information. You can collect data by showing it in tables, charts or graphs.
It will make the information easier to read and understand.
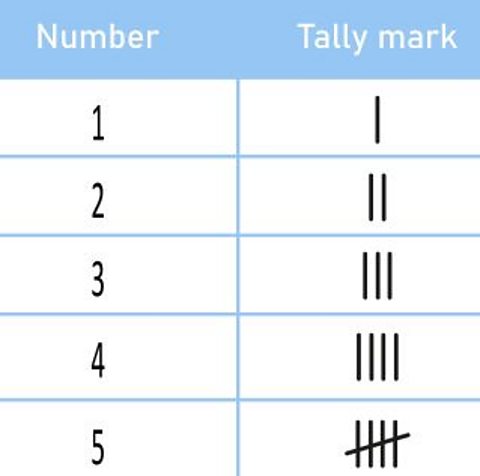
Tally charts
Tally charts are a good way of quickly collecting data.
On a tally chart you make a mark to represent a number, and group the marks into sets of five.
Doing this is much faster than writing out words and figures.
Can CAL make his soup?
In this video CAL is trying to decide if he has enough vegetables to make his soup.
He uses a tally chart to help him select how many of each ingredient he needs.
AMELIA: Morning, CAL. What are you up to today?
CAL: Morning, Amelia. I'm getting some ingredients from my garden. I'm going to cook my famous vegetable soup.
AMELIA: Yummy!
CAL: So, I need six carrots, two onions, four potatoes and three radishes. Hmm, but there are so many vegetables! Oh dear, how can I tell if I have enough of those vegetables? There are so many! Oh no! My soup! What am I going to do?
AMELIA: Calm down, CAL! Let's do something to make things a little easier. Let's use a chart to get the information we need.
CAL: Oh, OK. But how do we do that?
AMELIA: CAL, load a tally chart. So, let's mark down in our chart how much we have of each vegetable we need. Do we have enough?
CAL: Six carrots, two onions, four potatoes and three radishes. Yes, we do!
AMELIA: Excellent! A tally chart is a great way to see how much you have of lots of different things.
CAL: That's brilliant! Thank you, Amelia. I can't wait to make my vegetable soup. Look out kitchen, here I come! Oh no, my lettuces!
AMELIA: Maybe we can have soup tomorrow.
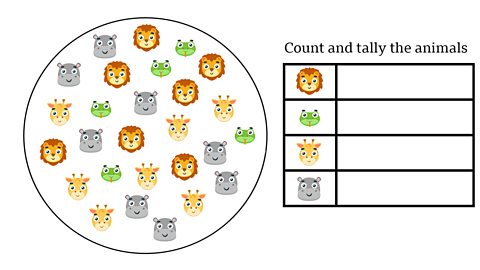
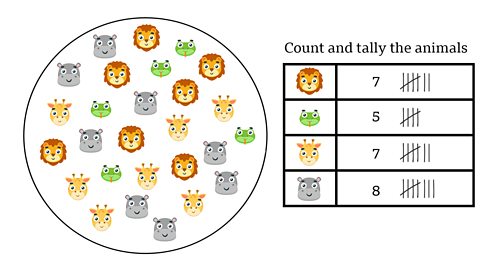
Save the zoo
Animals have escaped the zoo and it's your mission to find them. How many of each can you count?
More on Handling data
Find out more by working through a topic
- count2 of 6

- count3 of 6

- count4 of 6

- count5 of 6