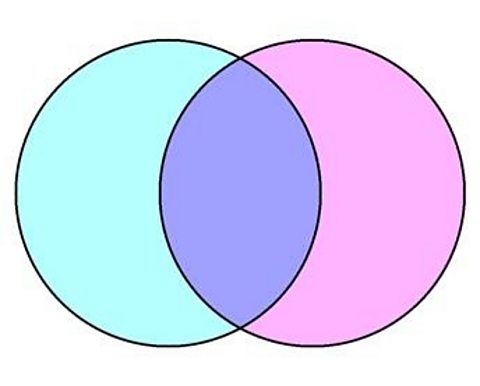
A Venn diagram shows the relationship between a group of different things. It allows us to sort data into two circles which overlap in the middle.
Venn diagrams are great for helping us organise two sets of things based on their similarities and their differences.
Things that have similarities are shown as overlapping circles, while things that are different stand alone.
For example, if you were to write down the number of children in your class who have brown hair in one circle, and the number of children in your class who wear glasses in another, then in the overlapping circles in the middle you would put down the number of children who have brown hair and wear glasses.
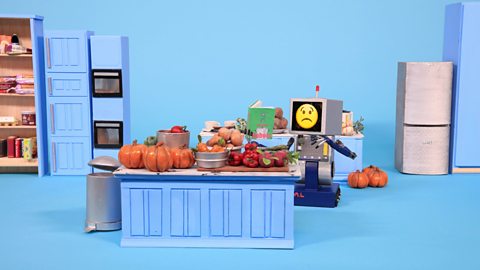
In this video CAL wants to make lots of different soups, but he cannot figure out which ingredients he has and does not have, in order to make the soups he wants.
CAL needs some help!
AMELIA: Hey CAL, ready to do a spot of cooking?
CAL: Hey Amelia. Yep. Time for CAL’s super-duper vegetable soup. Hmm, but it might be nice to make more than one soup. Maybe lots of different soups? I'll need a lot more vegetables though. Onions, broccoli, celery, sweet potato, pumpkin, carrots, peppers. But I already have potato. No, that's sweet potato, and carrot? Oh!
AMELIA: CAL, are you alright?
CAL: Oh, no, um, the recipes have so many different vegetables and I already have some. Ah! But which ones do I need? What do I do? Ah!
AMELIA: Hold on, CAL. I think I have a way of finding out what else you'll need for all the recipes.
CAL: Really?
AMELIA: Let's draw two circles that overlap. Now let's take all the vegetables you have and put the ones you don't need for your recipes in the left circle. Then we put the ones you do need in the middle and let's take all the vegetables from your recipe book and put the ones you don't need in the right-hand circle and the ones you do need in the middle. Now you can see that the overlapping part of the circles show you which vegetables you already have and what else you still need for your soups.
CAL: Oh that's useful! What a helpful drawing!
AMELIA: It's called a Venn diagram and it's great for helping us see how to organise two sets of things based on their differences and their similarities.
CAL: Right, I'm off to the supermarket. See you later.
AMELIA: CAL, don't forget your shopping list.
CAL: Oh my, yes, see you later!
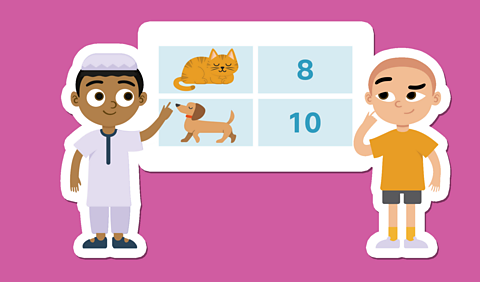
Test: Check your knowledge of Venn diagrams with this quiz about apples and oranges.
More on Handling data
Find out more by working through a topic
- count4 of 6

- count5 of 6

- count6 of 6
- count1 of 6