What is a box plot?
When data is presented as a list of numbers, it can be difficult to interpret.
If it is summarised in a diagram it is easier to draw conclusions and to compare with a different data set.
A box plot is a diagram which summaries the key features of a data set using just 5 key values.
These can be found easily once the values are arranged in order.
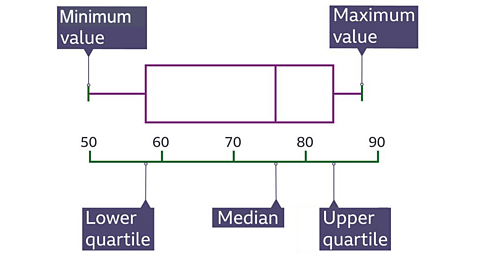
The 5 values to be identified are
• The minimum value – the smallest number in the data set
• The maximum value – the largest number in the data set
• The median - the middle value. 50% of the data is larger than this value and 50% of the data is smaller.
• The lower quartile is the value halfway between the minimum value and the median.
75% of the data is larger than this value and 25% is lower than this value .
• The upper quartile is the value half-way between the median and the maximum value.
25% of the data is larger than this value and 75% is lower than this value.
The ‘box’ has the lower quartile at one end and the upper quartile at the other.
The median is always somewhere inside the box. The height of the box is not important.
A box plot can be drawn from a data set using 5 key values.
Minimum, Maximum, Median, Lower Quartile and Upper Quartile.
Example
Miss Fitt, the PE teacher, uses a spreadsheet to record the times taken for pupils to complete a cross country run.
She uses the sort function to arrange the times from fastest to slowest.
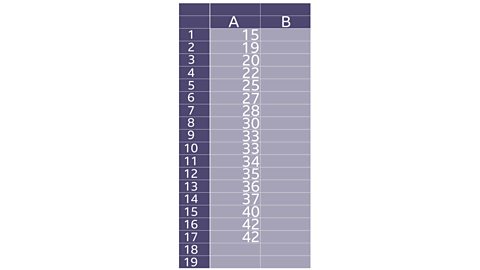
She wants to draw a box plot to show this data so first she needs to identify the 5 key values.
Minimum value = 15 minutes
Maximum value = 42 minutes
Median – There are 17 values so the median will be half-way - the 9th value which is 33 minutes
Lower Quartile – Half-way between the minimum and the median. This is the 5th value which is 25 minutes.
Upper Quartile – Half-way between the median and the maximum. This is the 13th value which is 36 minutes.
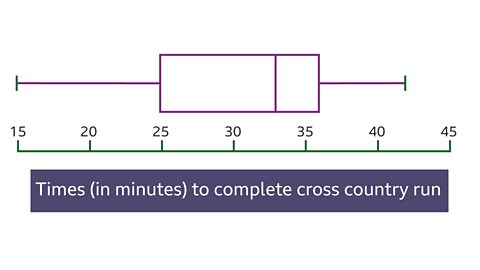
Miss Fitt uses the 5 values to draw the box plot below.
Question
A school librarian records the number of books borrowed in a school year by some Year 10 pupils. She arranges the data from smallest to largest.
5 6 10 12 12 14 14 16 18 18 19 19 20 22 23 25 27 27 28
What is the median number of books borrowed?
What is the lower quartile for the data?
What is the upper quartile for the data?
Answer
There are 19 values. The median is the middle value - the 10th value, which is 18.
The lower quartile is half-way from the lowest value to the median. There are 10 values up to and including the median. Themiddle value is half-way between the 5th and 6th values, which is 13.
The upper quartile is half-way from the median to the maximum value. This is half-way between the 14th and 15th values, whichis 22.5.
Test section
Look at the box plot below:
Question 1
What is the median value?
a) D
b) C
c) E
Answer
The correct answer is b) C.
Question 2
75% of the data is larger than which value?
a) D
b) C
c) E
Answer
The correct answer is a) D.
Question 3
75% of the data is smaller than which value?
a) A
b) E
c) D
The correct answer is b) E.
Question 4
25% of the data is larger than which value?
a) B
b) E
c) D
Answer
The correct answer is b) E.
The stem and leaf diagram below shows the ages of 21 people who applied for a job with an IT company.
Question 5
What is the median age of the applicants?
a) \(35\)
b) \(36\)
c) \(35.5\)
Answer
The correct answer is b) \(36\)
Question 6
What is the lower quartile for the data?
a) \(45\)
b) \(25.5\)
c) \(29\)
Question 6
The correct answer is c) \(29\).
Question 7
What is the upper quartile for the data?
a) \(45\)
b) \(25.5\)
c) \(28\)
Answer
The correct answer is a) \(45\).
Question 8
Which of these statements is true?
To draw a box plot for this data we need to know the median, the lower and upper quartiles and…
a) the range of the data
b) the mean of the data
c) the smallest and largest values
Answer
The correct answer is c) the smallest and largest values.
More on Representing and interpreting data
Find out more by working through a topic
- count3 of 3
- count1 of 3