Types of graphs and charts
The type of graph you use depends on the type of data you want to represent.
Examples
- Data values which can only take certain values, often whole number values, eg shoe sizes, number of brothers and sisters. is best represented using bar charts.
- Temperature graphs would usually be line graphs because the data is Data values that can take any value (not constrained to certain specific values), eg length of foot, body mass of newborn babies..
- When you are graphing percentages of a distribution a pie chart would be suitable.
- When you have two variables, such as marks in a Maths test and marks in a Science test, then a scatter diagram would be the one to use.
The other thing you need to remember is that all graphs need ‘SALT’.
Make sure you remember the following information:
S = Scale
A = Axes
L = Labels
T = Title
Bar charts
A bar chart is used to compare two or more values with a small set of results.
Drawing a bar chart
In a bar chart, the height of the bar shows the frequency of the result.
As the height of bar represents frequency, the vertical axis would be labelled 'Frequency'.
The labelling of the horizontal axis depends on what is being represented by the bar chart.
Take care to ensure an appropriate scale, to number the axes uniformly, and give the appropriate label on the axes.
Finally, remember to give the graph a suitable title.
Question
Leon conducts a survey to find the number of people in each of the cars arriving at the school gate between \({8.30}am\) and \({9.00}am\). His results are shown in the bar chart below:
Bar chart showing the number of people in each car arriving at school
a) How many cars contained \({1}\) person?
b) How many cars contained more than \({3}\) people?
c) Why are there only a small number of cars containing \({1}\) person?
d) How many cars arrived at the school gate between \({8.30}am\) and \({9.00}am\)?
Answer
a) \({8}\) cars contained \({1}\) person
b) \({14}\) cars contained more than \({3}\) people \((10 + 4 = 14)\)
c) Most cars would be driven by parents bringing their children to school - only a few would contain one person (such as a teacher or a sixth former).
d) \({64}\) cars (\({8+20+22+10+4}\)).
Line graphs
A line graph is often used to show a trend over a number of days or hours.
It is plotted as a series of points, which are then joined with straight lines.
The ends of the line graph do not have to join to the axes.
Line graph showing midday temperature over a period of 7 days
You can tell at a glance that the temperature was at its highest on Monday and that it started to fall in the middle of the week before rising again at the end of the week.
Question
a) What was the lowest temperature, and on what day did it occur?
b) On what day was the midday temperature \(26^\circ{C}\)?
Answer
a) The lowest temperature was \(19^\circ{C}\), and it occurred on Thursday.
b) The midday temperature was \(26^\circ{C}\) on Tuesday.
Pictograms
Pictograms use pictures to represent data. To make sense, a pictogram must always have a key.
In a pictogram it is important to make sure that each picture is the same size, equally spaced out and lined up one beneath the other.
Reading pictograms
This pictogram below shows the number of pizzas eaten by four friends in the past month.
The key tells you that one pizza on the pictogram represents \({4}\) pizzas eaten, so Alan ate \(4 + 2 = 6\) pizzas.
Pictogram showing the number of pizzas eaten by 4 friends in the past month
Question
a) Who ate the most pizzas?
b) How many pizzas did Bob eat?
c) What was the total number of pizzas eaten by the four friends?
Answer
a) Chris ate the most pizzas.
b) Bob ate \({9}\) pizzas.
Notice that each pizza on the pictogram represents \({4}\) pizzas, so \(\frac{1}{4}\) circle represents \({1}\) pizza.
c) There are a total of \(11\frac{1}{2}\) circles in the pictogram.
One circle represents \({4}\) pizzas, so \( 11\frac{1}{2} \times 4 = 46\) pizzas.
Pie charts
Pie charts use different-sized sectors of a circle to represent data.
In a pie chart it is important to understand that the angle of each sector represents the fraction, out of \({360}\), assigned to that data value.
Pie charts should always be labelled, either directly on the pie chart or by means of a colour-coded key.
Reading pie charts
Pie chart showing how students travel to school
a) What is the most common method of travel?
b) What fraction of the students travel to school by car?
c) If \({6}\) students travel by car, how many people took part in the survey?
Answer
a) The most common method of travel is bus as this has the largest sector on the pie chart.
b) \(\frac{1}{4}\) of the students travel by car because the angle of the sector is \({90}^\circ\), and the fraction is \(\frac{{90}^\circ}{{360}^\circ}=\frac{1}{4}\).
c) \({6}\) students travel by car, and this is \(\frac{1}{4}\) of the total.
Therefore, \({24}\) people were questioned for the survey.
Question
A supermarket chain sold \({3,600}\) packets of sausages last month.
Pie chart showing different varieties of sausages sold
a) How many packets of vegetarian sausages were sold?
b) How many packets of beef sausages were sold?
Answer
a) Vegetarian sausages account for \(\frac{1}{4}\) of the total sales, so calculate \(\frac{1}{4}\) of \({3,600}\).
\(\frac{1}{4}\times{3,600} = {900}\).
Therefore, \({900}\) packets of vegetarian sausages were sold last month.
b) There are \(360 ^\circ \) in a complete turn.
The 'beef' sector has an angle of \(150^\circ \), so the beef sector is \(\frac{150}{360}\) of the circle. \(\frac{150}{360}\times{3,600} = {1,500}\).
Therefore, \({1,500}\) packets of beef sausages were sold.
Constructing pie charts
To construct a pie chart you need to work out the fraction of the total that the sector represents.
Then convert this to an angle and draw the sector on the chart.
Example
The table shows the grades achieved by \({30}\) pupils in their end-of-year exam.
Constructing pie charts using a table
To present this information on a pie chart, use the following steps:
Work out the total number of pupils: \(7 + 11 + 6 + 4 + 2 = 30\)
To calculate the angle of each segment, work out the fraction of the total that got each grade. Start with A grades: \(\frac{7}{30}\)
There are \(360^\circ\) in a full turn. So to work out the angle, multiply the fraction by \(360\): \(\frac{7}{30} \times 360 = 84^\circ\)
Repeat this process to find the angles for the other segments. Check that the angles are correct by seeing if they add to \(360^\circ\).
Once you have calculated the angles of the segments, construct the pie chart.
Questions
Complete the following table. You could then use the data to construct a pie chart.
Answer
Frequency diagrams and frequency polygons
Frequency diagram showing heights of 200 people
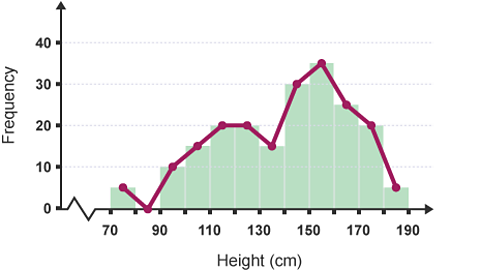
You can construct a frequency polygon by joining the midpoints of the tops of the bars.
Frequency polygons are particularly useful for comparing different sets of data on the same diagram.
Frequency polygon showing heights of 200 people
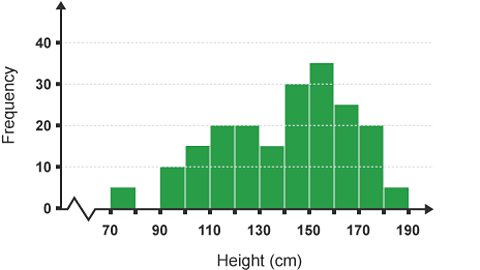
Image caption, Diagram showing data.
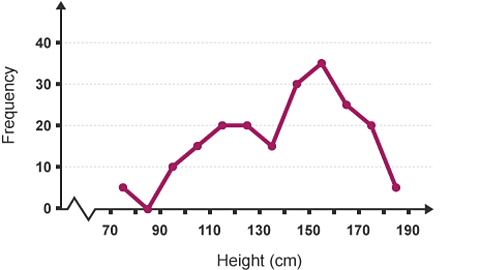
1 of 3
Scatter diagrams
Scatter diagrams show the relationship between two A quantity that can take on a range of values. .
By looking at the diagram you can see whether there is a link between variables.
If there is a link it is called correlation.
Reading scatter diagrams
The English and Maths results of ten classmates are shown in the table below:
| Sal | Kim | Bill | Tom | Gita | Alex | Bev | Ken | Alan | Jo | |
|---|---|---|---|---|---|---|---|---|---|---|
| Maths mark | 20 | 71 | 60 | 52 | 80 | 32 | 47 | 90 | 49 | 80 |
| English mark | 30 | 80 | 65 | 50 | 81 | 38 | 40 | 87 | 55 | 70 |
To see whether there is a correlation between the Maths marks and the English marks, you can plot a scatter diagram.
The Maths mark is on the horizontal scale and the corresponding English mark on the vertical scale.
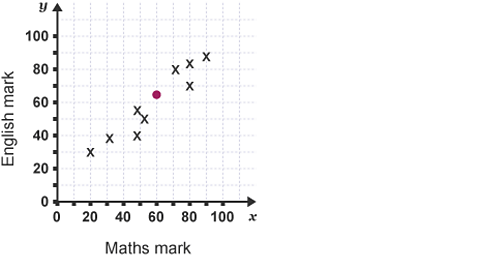
Bill's Maths mark was \({60}\) and his English mark was \({65}\), so his results are represented by the purple point at coordinates \(({60},~{65})\) on slide 2.
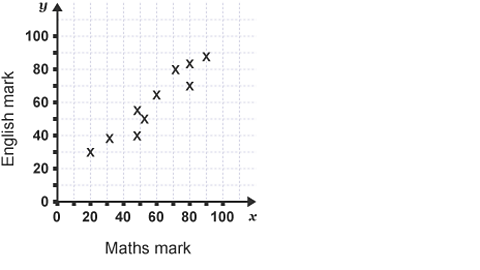
Image caption, Slide 1: Diagram showing Maths and English marks.
1 of 3
Question
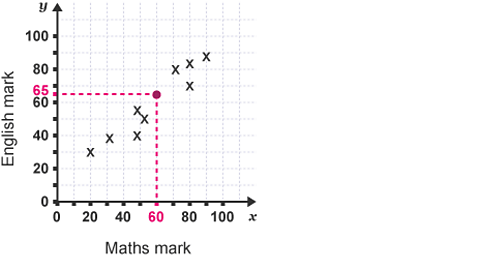
In the scatter diagram below, whose marks are represented by the small purple cross?
Answer
The coordinates of the cross are \(({80},~{70})\).
Therefore, the Maths mark is \({80}\) and the English mark is \({70}\).
So the small purple cross represents Jo's marks.
Notice that all the points representing Maths marks and English marks lie approximately along a straight line.
This shows that there is a correlation between these two variables.
The diagrams below show the correlations that you can deduce from different patterns of scatter.
Positive correlation
The points lie close to a straight line, which has a positive gradient.
This shows that as one variable increases the other increases.
Negative correlation
The points lie close to a straight line, which has a negative gradient.
This shows that as one variable increases, the other decreases.
No correlation
The points do not lie close to any straight line.
This shows that there is no connection between the two variables.
Question
Would you expect there to be positive correlation, negative correlation, or no correlation between the following pairs of variables:
a) temperature and sales of ice-cream
b) height and intelligence
Answer
a) As temperature increases, the sales of ice-cream are also likely to increase.
Therefore, there is likely to be positive correlation.
b) It is unlikely that there is a connection between height and intelligence.
Therefore, there is no correlation.
Scatter diagrams - line of best fit
The 'line of best fit' goes roughly through the middle of all the scatter points on a graph. The closer the points are to the line of best fit, the stronger the correlation is.
Example
Ten pupils in a school study French and German at GCSE.
Their marks in recent tests are recorded in the table below:
| Ben | Sarah | Sunil | Tom | Pete | Henry | Siobhan | Andrew | Jo | Gita | |
|---|---|---|---|---|---|---|---|---|---|---|
| Mark in French | 42 | 62 | 32 | 78 | 70 | 18 | 68 | 52 | 84 | 38 |
| Mark in German | 48 | 56 | 24 | 68 | ? | 22 | 76 | 54 | 89 | 39 |
Draw a scatter diagram to represent these marks.
As Pete was absent on the day of the German test you do not have enough information to mark his score.
Looking at this scatter diagram, there is strong positive correlation between the marks in French and the marks in German - so you can draw a line of best fit to show that trend.
Pete scored \({70}\) in French, so using the line of best fit, you can estimate that his mark in German would have been approximately \({72}\).
Key points
A line of best fit can only be drawn if there is strong positive or negative correlation.
The line of best fit does not have to go through the origin.
The line of best fit shows the trend, but it is only approximate and any readings taken from it will be estimations.
Test section
Bar chart showing the colour of cars passing Lisa’s house in one hour
Question 1
How many white cars passed the house?
Answer
The correct answer is \({5}\)
Bar chart showing the colour of cars passing Ben’s house in one hour
Question 2
Which colour was most popular?
Answer
The most popular colour is the colour represented by the highest bar: Red.
Line graph showing Suzie’s test marks over 7 weeks
Question 3
Which week saw the biggest increase in her marks?
Answer
The biggest increase is from week \({3}\) to week \({4}\).
Therefore week \({4}\) saw the biggest increase.
Question 4
How many pizzas did Chris eat?
Pictogram showing the number of pizzas eaten by 4 friends in a month
Answer
Take a look at the scale and note that \({1}\) pizza on the diagram represents \({4}\) real pizzas.
So, the correct answer is \({19}\)
Question 5
If \({10}\) people travel to school by car, how many people does the whole chart represent?
Pie chart showing the how pupils travel to school
Answer
A quarter of the people travel by car.
Therefore \({10}\times{4}={40}\) people in total.
Question 6
This is how much money Greg spent in a week:
Monday \(\pounds{3}\)
Tuesday \(\pounds{10}\)
Wednesday \(\pounds{7}\)
Thursday \(\pounds{18}\)
Friday \(\pounds{8}\)
Saturday \(\pounds{21}\)
Sunday \(\pounds{5}\)
If this data were shown on a pie chart, which angle would represent Saturday?
Answer
\(\pounds{1}\) is represented by \({5}^\circ\).
So the angle that represents Saturday is \({21}\times{5}={105}^\circ\).
Altogether Greg spent \(\pounds{72}\)
He spent \(\pounds{21}\) on Saturday.
\(\frac{21}{72}\times{360} = {105}^\circ\)
Question 7
How do you form a frequency polygon from a frequency diagram?
Answer
Connect the midpoint of the height of each bar with straight lines.
Question 8
What kind of correlation would you expect between a child's age and height?
Answer
Children grow in height as they grow older so it's a positive correlation.
Question 9
What kind of correlation would you expect between time spent watching television and time spent doing homework?
Answer
The more time is spent watching TV, the less time is spent on homework - so, a negative correlation.
Question 10
Which of these statements is incorrect regarding drawing a line of best fit on a scatter diagram?
a) You can only draw a line of best fit if there is an obvious positive or negative correlation.
b) The line of best fit has to go through the origin.
c) The line of best fit only shows a trend.
Answer
"The line of best fit has to go through the origin" is the incorrect statement as, very often, the line of best fit does not go through the origin.
More on Representing and interpreting data
Find out more by working through a topic
- count2 of 3
- count3 of 3