Key points
Frequency charts show the The number of times something occurs. of data using marks, called tallies.
Tallying is a way of recording data that counts in groups of five. The data is tallied as it is counted, with a mark for each piece of data, and then the frequency is recorded at the end.
Tally charts can be used for grouped and ungrouped data:
- Ungrouped data is data given as separate pieces. It is useful when there is a small number of A possible result..
- Grouped data is used when there are large numbers of possible outcomes. It makes the data easier to read.
How to use ungrouped frequency charts
Ungrouped data is data that is displayed exactly how it was gathered. It has a small number of outcomes which are Different in its own way from something else of a similar type..
Frequency charts show the tally next to each outcome, along with the frequency of the tally.
From the frequency chart, it is easy to read the The outcome with the most pieces of data. and the spread of the data.
Example
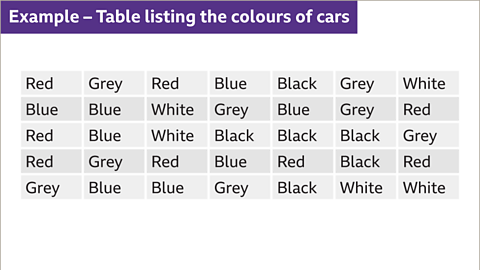
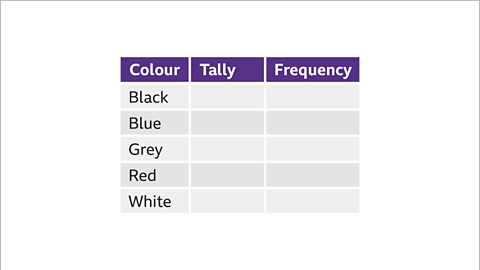
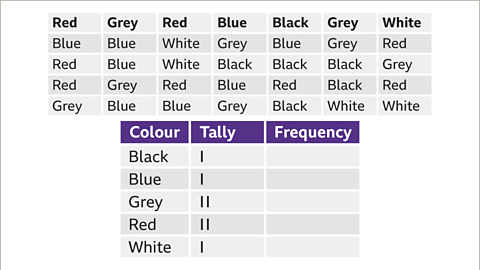
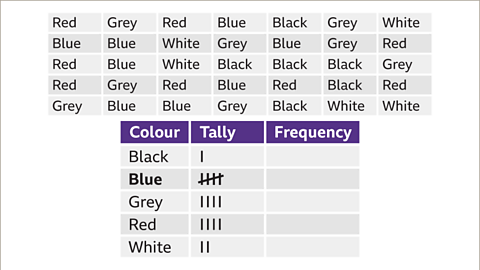
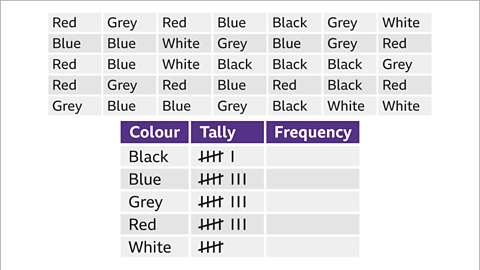
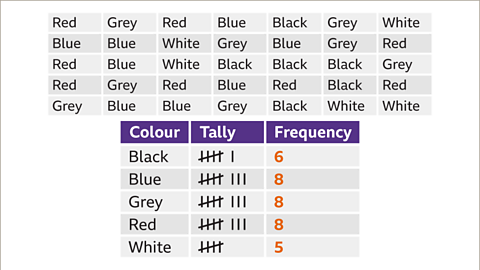
Image caption, This is the data gathered from a survey about the colours of cars in a car park. This data can be displayed in a frequency chart.
1 of 6
Question
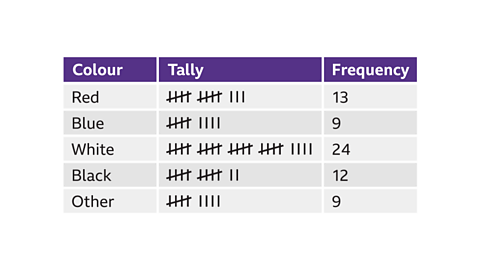
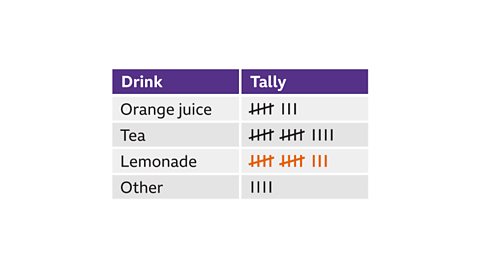
The chart below shows the results of a survey where people were asked which type of drink they preferred.
How many people preferred lemonade?
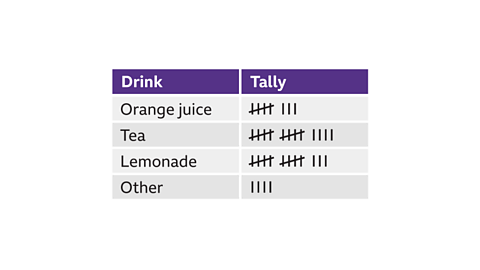
13 people preferred lemonade.
In the row for lemonade, there are two groups of five tally marks, and three further tally marks.
5 + 5 + 3 = 13
How to use grouped frequency charts
When there is a larger number of possible outcomes, it is often easier to group the data.
To group data, first decide on appropriate The range of values allowed within that band, when grouping data. based on the range of likely possible answers.
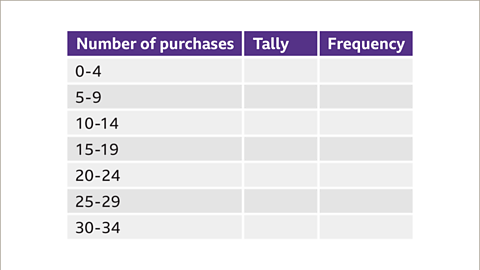
For example, in a survey about the number of magazines bought by students over the space of a year, the answers given range from 0 to 100. It would be sensible to group the data in class intervals of 5, so 0–4, 5–9, 10–14, 15–19 and so on.
When grouping data, it is important not to have an overlap of values in the class intervals. 0–5 and 5–10 would not be sensible groups as there is an overlap and 5 belongs in two class intervals.
Once finished, the table is known as a grouped frequency chart.
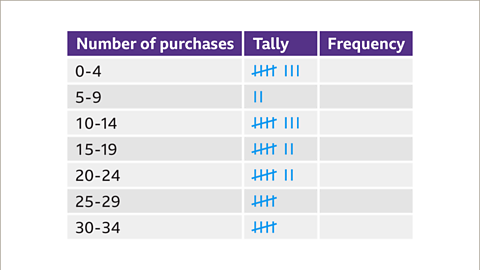
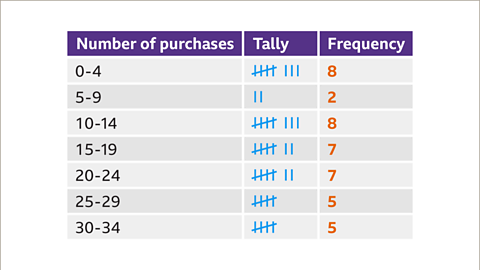
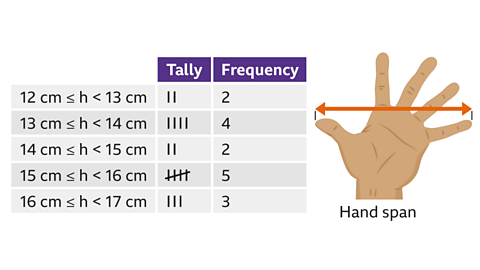
Example
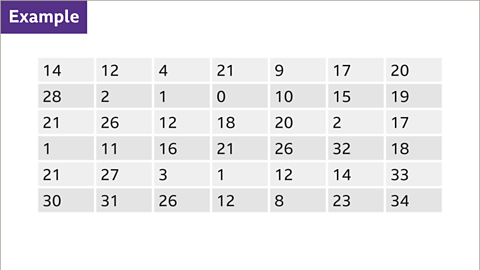
Image caption, Here is the data from a survey asking people how many times they bought a certain brand of yogurt in a month. There is a wide range of answers so it would make sense to group this data before making a frequency chart.
1 of 4
Question
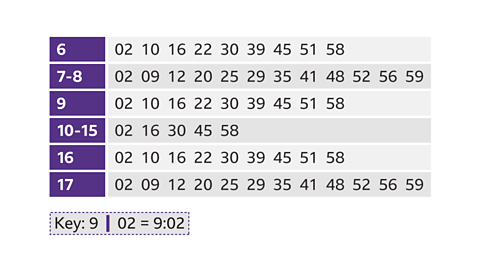
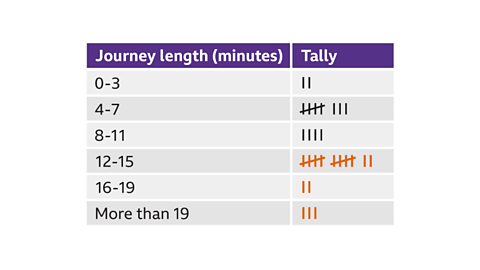
The chart below shows the results of a survey where people were asked how long it takes them to walk to school.
How many people took more than 11 minutes?
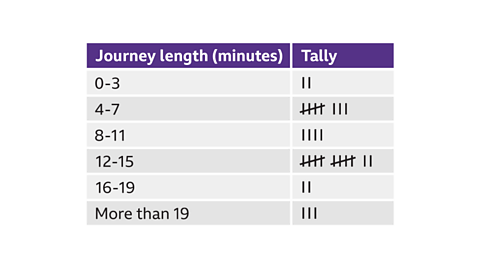
17 people had a journey length of more than 11 minutes.
‘More than 11 minutes’ means the people who had a journey time of 12 minutes or more. This includes everyone in the 12–15, 16–19 and more than 19 class intervals.
Practise working with tallying and frequency charts
Practise working with tallying and frequency charts with this quiz. You may need a pen and paper to help you with your answers.
Quiz
Real-life maths
Tally marks are written differently all around the world.
In some countries, such as Brazil and France, tallies are represented like this:

In other places, such as China and Hong Kong, it is more common to see tallies that look like this:

The common feature of all the different styles of tally marks is that after five marks have been recorded, another set starts. This is because counting used to be done more commonly using hands. With only four fingers and one thumb on one hand, anyone counting must start again after reaching a count of five.
Play Sudoku with BBC Bitesize!
Every weekday we release brand new easy, medium and hard Sudoku puzzles. Perfect for testing your skill with numbers and logic.

More on Collecting and recording data
Find out more by working through a topic
- count2 of 4
- count3 of 4
- count4 of 4