Key points
- Continuous data is A collection of facts or observations about something. that can take any value. Usually, continuous data can be measured. Some examples of continuous data include:
- time
- height
- weight
- Because continuous data can take any value, it must be grouped before it can be represented in a table or chart. Continuous data is grouped into The range of values allowed within that band, when grouping data..
- It can be useful to remember An inequality compares two values and uses inequality symbols (≤, <, >, ≥) to show which is larger or smaller. notation as this is used when writing class intervals:
- ≤ less than or equal to
- < less than
- > greater than
- ≥ greater than or equal to
Grouping continuous data
- Continuous data can take any value so before representing it in a table or chart, it must be grouped into distinct The range of values allowed within that band, when grouping data..
- Class intervals can be any size that suits the data, but they must not have any overlapping values:
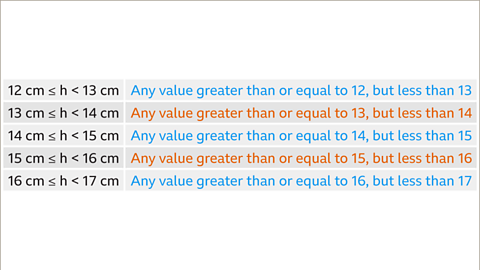
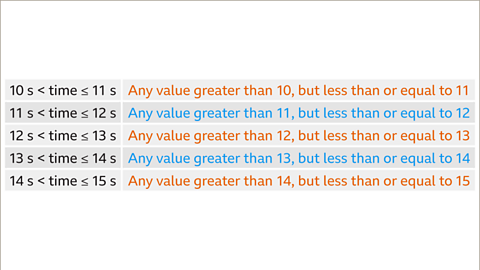
- The class interval 0 ≤ \(x\) < 10 can have any values greater than or equal to 0 but less than 10 in it.
- This group includes anything exactly equal to 0 but does not include anything exactly equal to 10
- To avoid any overlaps, the next class interval would be 10 ≤ \(x\) < 20. Any pieces of data which are greater than or equal to 10 but less than 20 fall in this interval.
- Once continuous data has been sorted into class intervals, it can be represented in a frequency chart, or a range of other types of graphs. These charts help to interpret the data.
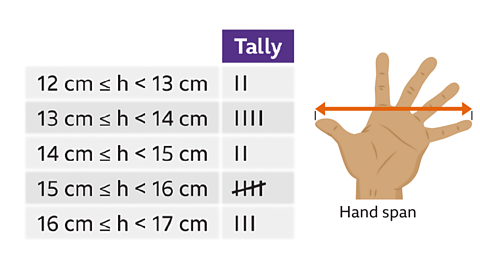
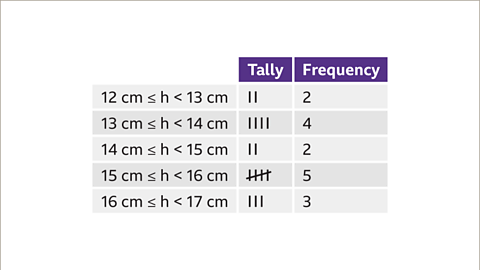
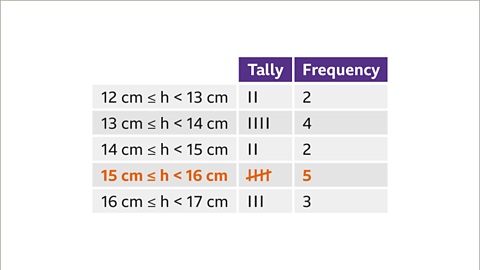
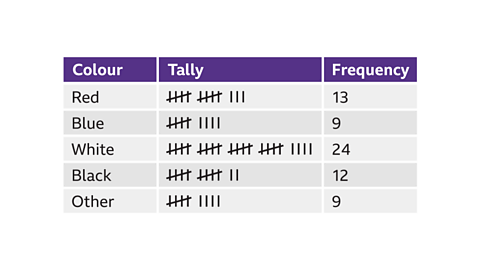
- It is useful to remember that tallies are used to count pieces of data, and they count in fives.
Examples
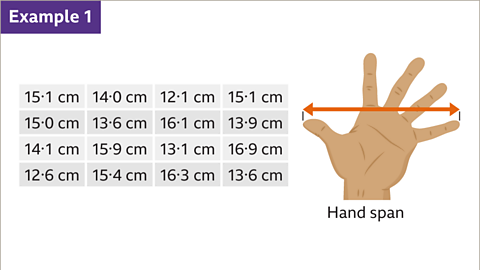
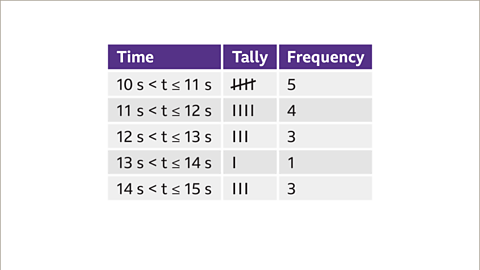
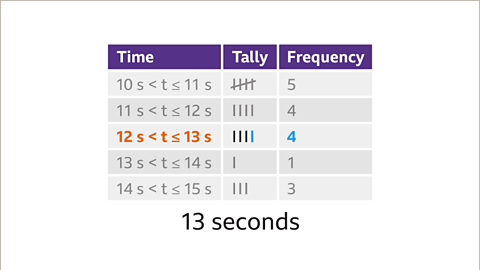
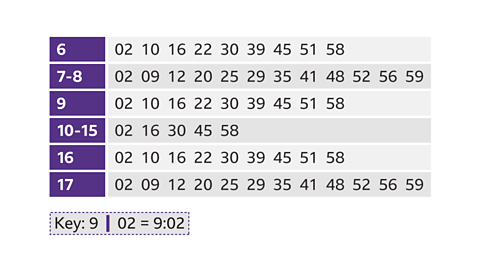
Image caption, The hand spans of a group of students are measured. Hand span is an example of continuous data, as it can take any value. The data collected is shown in this table.
1 of 8
Question
Which class interval should 30 m be put into?
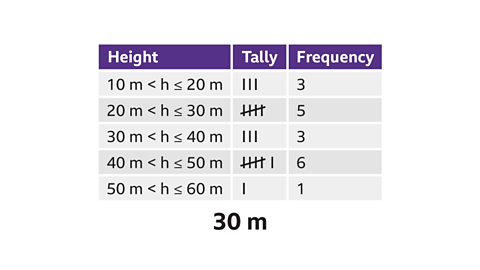
30 metres appears in two class intervals. However, the inequality signs show that 30 falls into the 20 m < height ≤ 30 m class as this group covers from 20 up to, and including, 30
Practise grouping continuous data
Quiz
Practise grouping continuous data and using tally charts with this quiz. You may need a pen and paper to help you with your answers.
Real-life maths
Class intervals are used for the bands of The tax people have to pay to the government based on their yearly income. paid by working adults in the UK.
This frequency chart shows the level of income, and the frequency of adults who paid that rate.
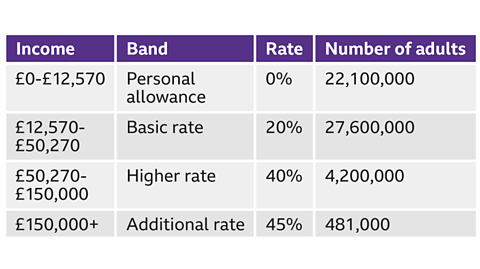
Anything up to, and including, £12,750 is taxed at 0%. This could also be expressed as 0 < £ ≤ 12,750
Any amount between £12,750 and £50,270 is taxed at 20%. Mathematically, this class interval can be written as 12,750 < £ ≤ 50,270
These groups vary slightly each year.
Play Sudoku with BBC Bitesize!
Every weekday we release brand new easy, medium and hard Sudoku puzzles. Perfect for testing your skill with numbers and logic.

More on Collecting and recording data
Find out more by working through a topic
- count4 of 4
- count1 of 4
- count2 of 4