Sampling and using quadrats
It is important to estimate the number of organisms in a population to better understand the relationships in a community. This information is useful for monitoring the impact of conservation projects that aim to conserve Animals that are close to extinction because of their low numbers. or A place where plants, animals and microorganisms live.. It is almost always impossible to count all the organisms in a population. So we look at a small representative section of a population to draw conclusions about the rest. This process is called The selection of subjects included in a study. and the area or part of the population looked at is called a sample.
Sampling
When sampling a population, the numbers of organisms are counted within a sample site, and then the results multiplied to estimate the total number in the entire habitat. Large animals and plants can often simply be counted. However, many smaller animals like insects and smaller mammals need to be trapped first so they can be counted and then released afterwards. Pitfall traps are small traps dug into the ground, which often have food inside to attract small animals. The sides of these traps are smooth to stop the animals escaping.
Another method is to use large nets to sweep through grasses or leaves of trees in a process called sweep netting. To catch aquatic organisms nets are often held downstream of an area of river bed which is then gently disturbed by the person doing the sampling. The small animals float into the net. This is called kick-sampling.
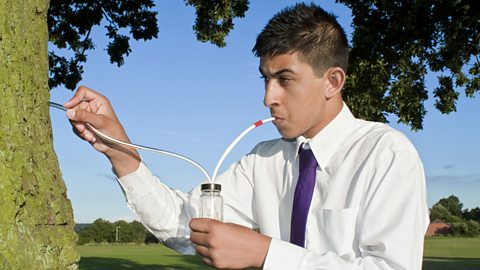
Pooters are small devices used when sampling to suck up small insects safely without them going into your mouth.
Using quadrats
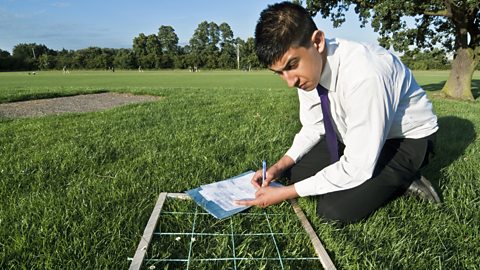
A square frame of known area used for sampling the abundance and distribution of slow or non-moving organisms. are square frames often 0.25 m2. These are placed on the ground to look at the plants or slow-moving animals within them. When looking at plants in a quadrat the following sampling can be used:
- Number of an individual species: the total number of individuals of one species - eg daisies - is recorded.
- Species richness: the number of different plant or animal species is recorded but not the number of individuals within a species.
- Percentage cover: the percentage of the quadrat area that is covered by one species - eg grass.
The percentage cover is easier to estimate if a quadrat has wires making smaller sections. Percentage cover rather than number of individuals is used when estimating plant frequencies if it is difficult to count individual plants, such as grasses or moss.
Random or systematic
Random sampling using a quadrat involves the placing of quadrats at Occurring without a pattern. Unpredictable. In statistics where each item has an equal probability of being selected. coordinates. Regardless of whether you are investigating the number of individual species, the species diversity or the percentage cover in different areas you would use random sampling.
What are we sampling for?
Sometimes we want to see if the number of species or percentage cover changes within an area. This is often as a result of a change in an Non-living elements of an ecosystem, such as climate, temperature, water, and soil type. factor.
An example of this is an investigation into whether the growth of seaweed depends upon the distance it is found on the seashore from the tide. As we are looking to link a linear change (in this case the number of hours the seaweed is covered by the tide) we would use systematic sampling.
A quadrat could be placed at regular distances, for example every five metres, along an imaginary line called a A line created, for instance, with a tape measure, along which sampling occurs., which would run down the shore. Systematic sampling would be used along the transect to link changes in A type of organism that is the basic unit of classification. Individuals of different species are not able to interbreed successfully. to abiotic factors, such as immersion by water, temperature fluctuations, light intensity, all of which are influenced by the tide.
The results from transects can be drawn into kite diagrams. The width of the bar from the middle at any distance shows how many individuals were observed at that point.
Question
At what distances were the most grasses and dandelions seen?
The most grasses were seen at 20 metres. The most dandelions were seen at five metres.
More guides on this topic
- What happens during photosynthesis? - OCR 21st Century
- How do producers get the substances they need? - OCR 21st Century
- How do producers transport the substances they need?
- How are organisms in an ecosystem interdependent? - OCR 21st Century
- How are levels maintained within an ecosystem? - OCR 21st Century
