Data can be presented in many ways that make it quicker and easier to read.
In this section we will look at some of these ways. It is important to choose the best way to present data.
Line graphs
A line graph can be used to show how one quantity changes as another is changed, e.g. how temperature changes over time or how a spring extends as the mass is increased.
It is plotted as a series of points, which are joined with straight lines.
The ends of the line graph do not have to join to the axes.
Example
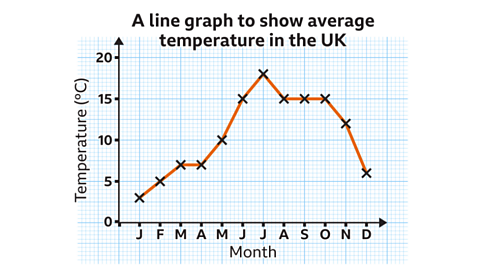
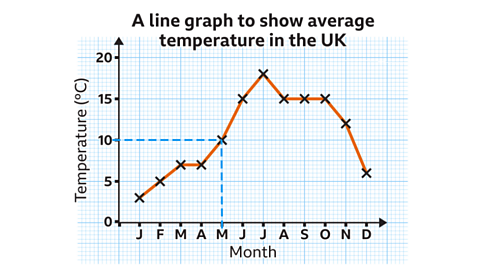
Image caption, What is the average temperature in May?
1 of 4
Line graph showing midday temperature over a period of 7 days
You can tell at a glance that the temperature was at its highest on Monday and that it started to fall in the middle of the week before rising again at the end of the week.
What was the lowest temperature, and on what day did it occur?
On what day was the midday temperature 26°C?
Answer:
The lowest temperature was 19°C and it occurred on Thursday.
The midday temperature was 26°C on Tuesday.
Scatter graphs
Scatter graphs are a good way of displaying two sets of Information such as facts and numbers used to analyse something or make decisions to see if there is a correlation, or connection.
Example
The number of umbrellas sold and the amount of rainfall on 9 days is shown on the scatter graph and in the table.
| Umbrellas sold | 1 | 10 | 25 | 0 | 1 | 32 | 47 | 8 | 15 |
| Rainfall (mm) | 3 | 2 | 4 | 0 | 0 | 5 | 6 | 1 | 1 |
The graph shows that there is a positive correlation between the number of umbrellas sold and the amount of rainfall. On days with higher rainfall, there were a larger number of umbrellas sold.
Types of correlation
Positive correlation
The points lie close to a straight line, which has a positive gradient.
This shows that as one variable increases the other increases.
Negative correlation
The points lie close to a straight line, which has a negative gradient.
This shows that as one variable increases, the other decreases.
No correlation
The points do not lie close to any straight line.
This shows that there is no connection between the two variables.
The scatter graph shows the temperature on 12 days in the summer and the number of ice creams sold by Jude’s Gelati on those days.
- How many ice creams were sold when it was 23°C?
- Describe the relationship between the temperature and the number of ice creams sold.
- 74 ice creams were sold when the temperature was 23°C.
- More ice creams were sold when the temperature was higher. There is positive correlation between the temperature and the number of ice creams sold.
Test yourself
More on M1: Handling data
Find out more by working through a topic
