Scatter graphs
Scatter graphs are a good way of displaying two sets of data to see if there is a The relationship between two sets of data. Usually described as positive or negative., or connection.
Example
The number of umbrellas sold and the amount of rainfall on 9 days is shown on the scatter graph and in the table.
| Umbrellas sold | 1 | 10 | 25 | 0 | 1 | 32 | 47 | 8 | 15 |
| Rainfall (mm) | 3 | 2 | 4 | 0 | 0 | 5 | 6 | 1 | 1 |
The graph shows that there is a positive correlation between the number of umbrellas sold and the amount of rainfall. On days with higher rainfall, there were a larger number of umbrellas sold.
Types of correlation
Graphs can either have positive correlation, negative correlation or no correlation.
Positive correlation
Positive correlation means as one variable increases, so does the other variable. They have a positive connection.
Negative correlation
Negative correlation means as one variable increases, the other variable decreases. They have a negative connection.
No correlation
No correlation means there is no connection between the two variables.
Outliers on scatter graphs
Scatter plots often have a pattern. We call a data point an outlier if it doesn't fit the pattern.
The scatter graph below shows data for students on a hiking trip.
Each student is carrying a backpack and each point on the graph represents a student.
Two of the points don't fit the pattern very well.
These points have been labeled Brad and Sharon, which are the names of the students they represent.
Sharon could be considered an outlier because she is carrying a much heavier backpack than the pattern predicts.
Brad could be considered an outlier because he is carrying a much lighter backpack than the pattern predicts.
Scatter graphs - Lines of best fit
A line of best fit is a sensible line that goes as centrally as possible through the coordinates plotted. It should also follow the same steepness of the crosses.
The line of best fit for the scatter graph would look like this:
Interpolation and extrapolation
From the diagram above, we can estimate how many umbrellas would be sold for different amounts of rainfall. For example, how many umbrellas would be sold if there was 3 mm of rainfall? What if there was 10 mm of rainfall?
To estimate the number sold for 3 mm of rainfall, we use a process called interpolation. The value of 3 mm is within the range of data values that were used to draw the scatter graph
Find where 3 mm of rainfall is on the graph. Use this line to estimate the number of umbrellas sold by going across from 3 mm and then down to find the number of umbrellas.
An estimated 20 umbrellas would be sold if there was 3 mm of rainfall.
If there was 10 mm of rainfall, we could extend the graph and the line of best fit to read off the number of umbrellas sold. This gives a value of approximately 80 umbrellas sold.
This process is called extrapolation, because the value we are using is outside the range of data used to draw the scatter graph. Since 10 mm is much higher than the highest rainfall recorded, we cannot assume that the line of best fit would still follow the pattern when the rainfall is 10 mm, so the value of 80 umbrellas is not a reliable estimate.
Question
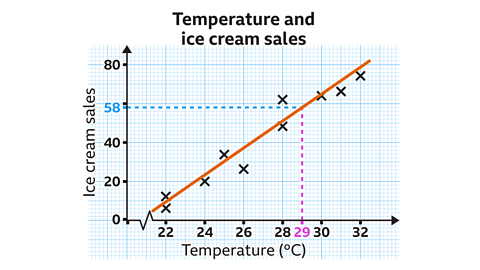
The scatter graph shows the relationship between the temperature on a given day and the number of ice creams sold in a café.
A line of best fit has been drawn.
Use the line of best fit to predict how many ice creams will be sold on a day when the temperature is 29°C.
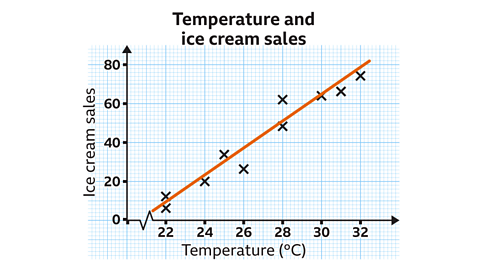
The vertical scale is going up in increments of 20
Between each multiple of 20 are ten subdivisions. Each subdivision is worth two ice creams.
Using the line of best fit, 58 ice creams would be sold when the temperature is 29°C.
Question
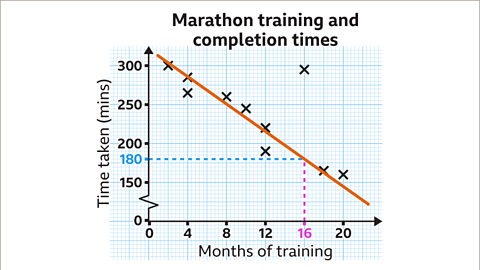
The scatter diagram shows the relationship between the months a competitor trained for and the time it took them to complete a marathon.
- What type of correlation does the graph show?
- Using the line of best fit, predict the time for someone who has been training for 16 months.
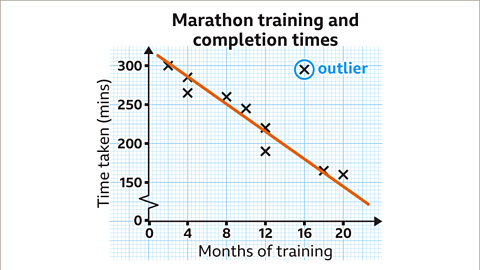
- The graph shows negative correlation
- The vertical scale is going up in increments of 50. Between each multiple of 50 are ten subdivisions. Each subdivision is worth 5 minutes. Someone who trains for 16 months could expect to complete the marathon in 180 mins.
Test yourself
More on M2: Handling data
Find out more by working through a topic
