What is osmosis?
Narrator: Osmosis is a special type of diffusion where water molecules move through a selectively permeable membrane.
This means the membrane only allows certain molecules through, according to their size.
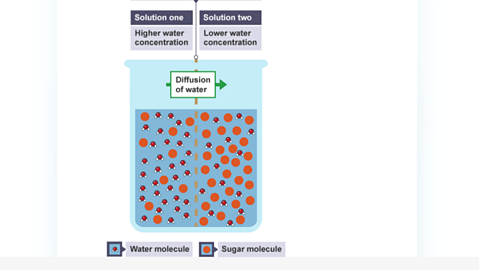
The water will move from a place where it is in high concentration to an area where it is in lower concentration.
When this happens, we say it moves down the concentration gradient.
Larger molecules cannot pass through the membrane.
Water molecules can move in any direction across the membrane until there is the same concentration at both sides.
Osmosis is the The random movement of a substance from a region of high concentration to a region of low concentration. of water molecules from a dilute solution (high concentration of water) to a more concentrated solution (low concentration of water) across a selectively The property of a membrane that controls the movement of molecules depending on their size..
Water moves down the The difference in concentration between two solutions, between different cells or between cells and a surrounding solution. without needing energy.
A selectively permeable membrane allows some small substances to pass through, but prevents larger substances doing the same.
The cell wall is totally permeable and has no role in controlling what enters and leaves a cell.
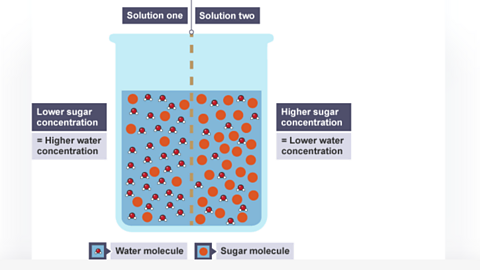
Image caption, The beaker contains water and sugar molecules
1 of 2
Osmosis in cells
The movement of water into or out of a cell depends on the The measure of the amount of a substance. of water surrounding it.
Animal cells
When water moves into an animal cell (eg a red blood cell), it gets bigger.
Eventually, the cell will burst. This is called cell lysis and it happens because there is no cell wall in animal cells to support them.
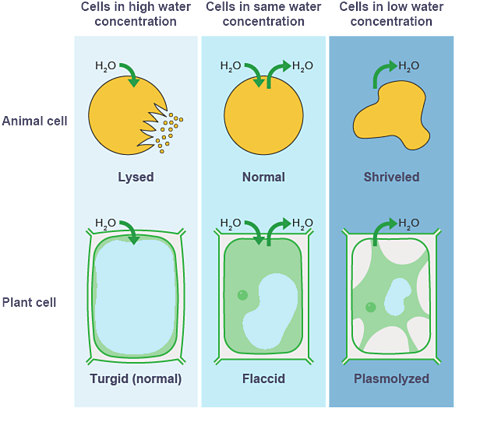
Plant cells
When water moves into a plant cell, the A space within the cytoplasm of plant cells that contains cell sap. gets bigger, pushing the cell membrane against the cell wall.
This makes the cell firm or Having turgor; enlarged and swollen with water..
Plasmolysis
If plants do not receive enough water the cells cannot remain turgid and the plant wilts.
Cells that are not turgid are Lacking turgor. Lacking in stiffness or strength. Soft and floppy..
When too much water moves out of a plant cell the vacuole shrinks and the cell membrane pulls away from the cell wall.
Practical 2.1
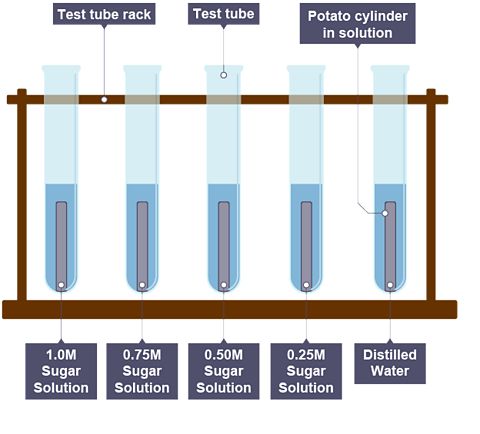
Investigate the process of The process by which water moves in and out of cells from a high concentration to a low concentration. by measuring the change in length or mass of plant tissue.
Procedure:
- Cut five potato cylinders of equal size with a cork borer.
- Measure the mass and length of each cylinder.
- Place one cylinder in test tube with different sugar concentrations.
- Leave for 24 hours.
- Remove cylinders, pat dry to remove excess water, and remeasure their mass and length.
- Record results in a table.
- Calculate the change in mass and % change in mass or length.
- Plot a graph of % change against sucrose concentration.
The percentage change in mass/length is calculated using the following equation:
\(\% {change} = \frac{change}{initial} {x} {100}\)
Results
| Sucrose Concentration (M) | Initial mass (g) | Final mass (g) | Change in mass (g) | % Change in mass |
|---|---|---|---|---|
| 1.00 | 3.0 | 2.5 | -0.5 | -16.7% |
| 0.75 | 3.0 | 2.7 | -0.3 | -10.0% |
| 0.50 | 3.0 | 3.0 | 0.0 | 0.0% |
| 0.25 | 3.0 | 3.2 | +0.2 | +6.7% |
| 0.00 | 3.0 | 3.6 | +0.6 | +20.0% |
Conclusion
The potato cylinders placed in pure water (0.0M) or weak sugar solutions will gain mass as water will have moved from an area of high concentration (outside the potato cells) to an area of lower concentration (inside the potato cells).
The potato cylinders placed in strong sucrose solutions (1.0M) will lose mass as water will have moved from an area of high concentration (inside the potato cells) to an area of lower concentration (outside the potato cells).
The sugar concentration (0.5M) that causes no change in mass is the concentration that is equal to the potato cell.
Watch: How to investigate osmosis
Transpiration
Transpiration is the evaporation of water from the The plant tissue in a leaf which has loosely packed cells and air spaces between them to allow gas exchange. cells, followed by the The random movement of a substance from a region of high concentration to a region of low concentration. of water through the air spaces and out of the Tiny holes in the epidermis (skin) of a leaf. They control gas exchange by opening and closing and are involved in loss of water from leaves. Singular is stoma..
Most of the water that enters a plant will exit the leaf into the atmosphere.
This provides a continuous supply of water, which is known as the transpiration stream.
Plants use water for:
- photosynthesis
- transpiration
- transport – carry sugar and minerals around the plant
- support – to keep firm and upright
If water availability is limited, plants will reduce transpiration by closing the stomata.
Factors affecting transpiration
| Factor | Effect on transpiration | How to change this factor experimentally |
|---|---|---|
| Surface area (not an environmental factor) | Smaller leaves will contain less stomata causing a decrease in transpiration | Remove leaves |
| Wind speed | A higher wind speed will increase the rate of evaporation causing an increase in transpiration | Use a fan |
| Temperature | A higher temperature will increase the rate of evaporation causing an increase in transpiration | Use a heater |
| Humidity | A higher humidity level will reduce the rate of evaporation causing a decrease in transpiration | Place a clear, plastic bag over the plant shoot |
| Light intensity | Darkness will cause the stomata to close causing a decrease in transpiration | Use a lamp |
If less water is being lost through transpiration the plant will absorb less water at the roots.
Potometer
A potometer measures the rate of water uptake in plants.
There are two types of potometer – the bubble potometer and the weight potometer.
Bubble potometer
As water is The loss of water from leaves by evaporation through the stomata. from the leaves, the shoot absorbs water from the potometer, causing the air bubble to move.
The distance moved over time indicates the rate of water uptake.
The apparatus is assembled underwater to avoid unwanted air bubbles, and the junction is sealed (eg with petroleum jelly) to prevent air leaks.
A reservoir or syringe resets the bubble position for repeated measurements or testing different environmental factors (eg light, The amount of water vapour in the atmosphere measured as a percentage., temperature, wind).
To ensure a fair test, all other factors must remain constant during experiments.
Weight potometer
A weight potometer measures water loss by weighing the plant before and after a set time. The difference indicates water loss.
Using a precise balance (eg to two decimal places) improves accuracy.
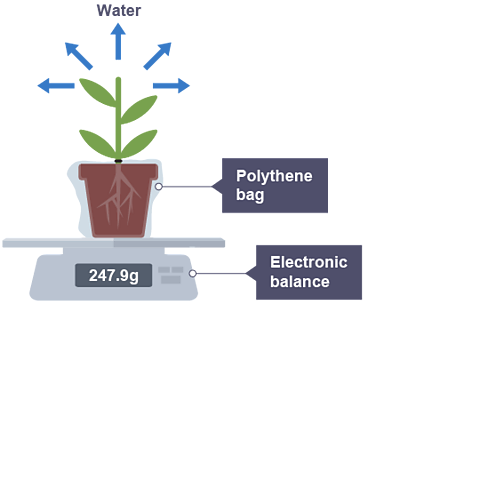
Practical 2.2
Bubble potometer investigation
Aim: To investigate the rate of water loss from a plant under different environmental conditions.
Procedure:
- Set up the bubble potometer: Fill with water, seal with petroleum jelly, and submerge under water and add plant.
- Record the initial position of the bubble.
- Leave the apparatus for 15mins.
- Record the final bubble position and calculate the rate of water uptake (distance/time).
- Reset the bubble and repeat under the same conditions to improve reliability.
- Change environmental factors: adjust light, temperature, or air movement and repeat the measurements.
Results:
| Condition | Initial bubble position (cm) | Final bubble position (cm) | Distance moved by bubble (cm) | Rate (cm/min) |
|---|---|---|---|---|
| Lamp, no fan, 20°C | 0 | 3 | 3 | 0.20 |
| No lamp, fan, 20°C | 0 | 5 | 5 | 0.33 |
| No lamp, no fan, 30°C | 0 | 8 | 8 | 0.53 |
| Lamp, fan, 30°C | 0 | 10 | 10 | 0.66 |
Conclusion:
Increased light intensity, air movement and temperature all increase the rate of transpiration.
Weight Potometer investigation
Aim: To investigate the rate of water loss from a plant under different environmental conditions.
Procedure:
- Set up a weight potometer and measure the initial mass of the pot and plant.
- Leave the setup for a set period (eg 12 hours).
- Measure the new mass of the container and plant.
- Calculate the rate of mass loss ( mass lost / time).
- Repeat for reliability.
- Change one environmental condition (eg temperature or light) and repeat steps 1-5.
Results:
| Condition | Initial Mass (g) | Final Mass (g) | Mass Lost (g) | Rate of Mass loss (g/hr) |
|---|---|---|---|---|
| Lamp, no fan, 20°C | 50 | 48 | 2 | 0.16 |
| No lamp, fan, 20°C | 50 | 46 | 4 | 0.33 |
| No lamp, no fan, 30°C | 50 | 43 | 7 | 0.58 |
| Lamp, fan, 30°C | 50 | 39 | 11 | 0.91 |
Conclusion:
Increased light intensity, air movement and temperature all increase the rate of transpiration.
Washing line investigation
Practical 2.2
Aim: To find out if plants lose water through their leaves.
Procedure:
- Remove four leaves from a plant.
- Smear petroleum jelly on various sides of the leaf (see table above) to waterproof them.
- Measure the initial mass of each leaf.
- Hang the leaves to dry using paperclips and a string.
- After a set period (24hrs), measure the mass of each leaf again.
- Calculate the mass loss for each leaf.
Results:
| Leaf | Mass before / g | Mass after / g | Difference in mass / g | Percentage change in mass / % |
|---|---|---|---|---|
| A – no Vaseline | 2.0 | 1.2 | 0.8 | 4.0 |
| B – Vaseline on upper side | 2.1 | 1.7 | 0.4 | 19 |
| C – Vaseline on lower side | 2.0 | 1.8 | 0.2 | 10 |
| D – Vaseline on both sides | 2.2 | 2.2 | 0.1 | 5 |
Conclusion:
Leaf A lost the most water since no stomata were covered in Vaseline.
Leaf D lost the least water because all stomata were covered in Vaseline.
As there are more stomata on the underside of the leaf, leaf C loses less water that leaf D because it had more stomata covered allowing more transpiration.
Watch: Osmosis Rap. A 2012 clip from the BBC Two programme Bitesize Science
Test your knowledge!
More on Body systems
Find out more by working through a topic
- count2 of 3
- count3 of 3

